Daily Technical Report
June 12, 2012
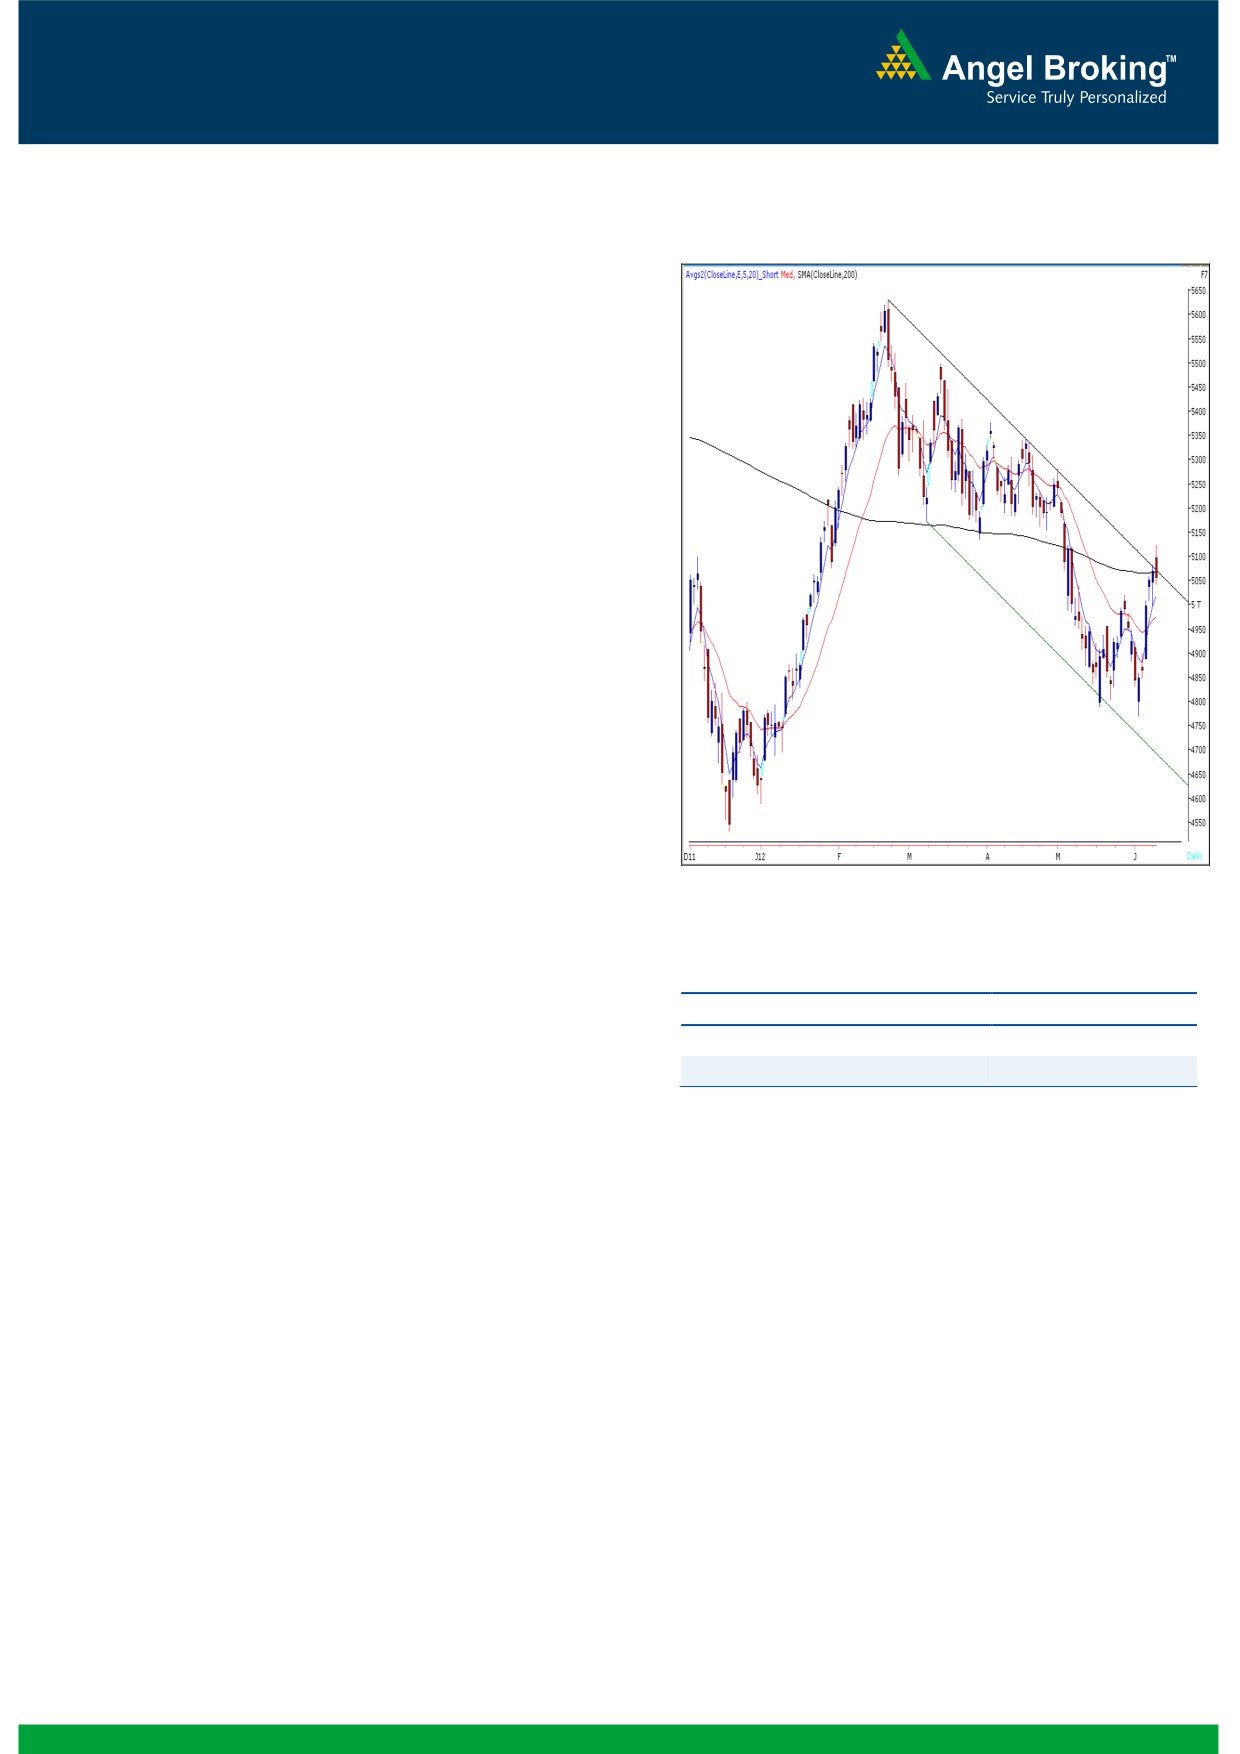
Exhibit 1: Nifty Daily Chart
Sensex (16668) / NIFTY (5054)
The week began on a cheerful note as indices opened
significantly higher in-line with strong positive cues
from other Asian markets. Indices managed to hold
their gains almost throughout the session, but
immense selling pressure during the last hour of the
trade dragged indices sharply lower to close on a flat
note. On sectoral front, Consumer Goods, Healthcare
and Realty counters were among the major losers;
whereas Consumer Durables and FMCG sector ended
with marginal gains. The advance to decline ratio was
in favor of advancing counters (A=1447 D=1260)
Formation
The 200-day SMA (Simple Moving Average) and
20-day EMA (Exponential Moving Average) have
now shifted to 16800 / 5070 and 16380 /
4967, respectively.
The ‘20-Week EMA’ is placed at 16830 / 5100
level.
Source: Falcon
Indices have taken a support near 15860 /
4766 level, which is the
78.6% Fibonacci
Retracement level of the rise from 15135 / 4531
Actionable points:
(Low on December 23, 2011) to 18524 / 5630
View
Neutral
(High on February 22, 2012).
Resistance Levels
5079 - 5125
On the daily chart, indices are trading near the
Support Levels
5040 - 4995
upper range of ‘Downward Sloping Channel’
drawn by joining two highs of February 22,
2012 - April 19, 2012 and low of March 7,
We are now observing that indices have closed near
2012.
its hourly '20-EMA', which is known as decent
support. Therefore, a sustainable closing above
The weekly ‘RSI’ momentum oscillator is
'200-day SMA' would push indices higher to test its
signaling a positive crossover.
target of 17400 / 5270 mentioned in our weekly
report. Conversely, a violation of yesterday's low of
16627 / 5040 may reinforce further selling pressure,
Trading strategy:
which may eventually drag indices to test 16490 /
Friday's sharp up move during the second half was
4995 level. We reiterate our view that positional
followed by yesterday's decent gap up opening on the
traders should use declines up to 4950 to buy into
back of positive sentiments across the globe. As a
the market.
result, we were observing a 'Downward Sloping
Channel' breakout. However, indices faced strong
resistance around '200-day SMA' and corrected
sharply after trading marginally above it. Hence, at
this juncture the breakout cannot be termed as a
convincing technical breakout.
1
Daily Technical Report
June 12, 2012
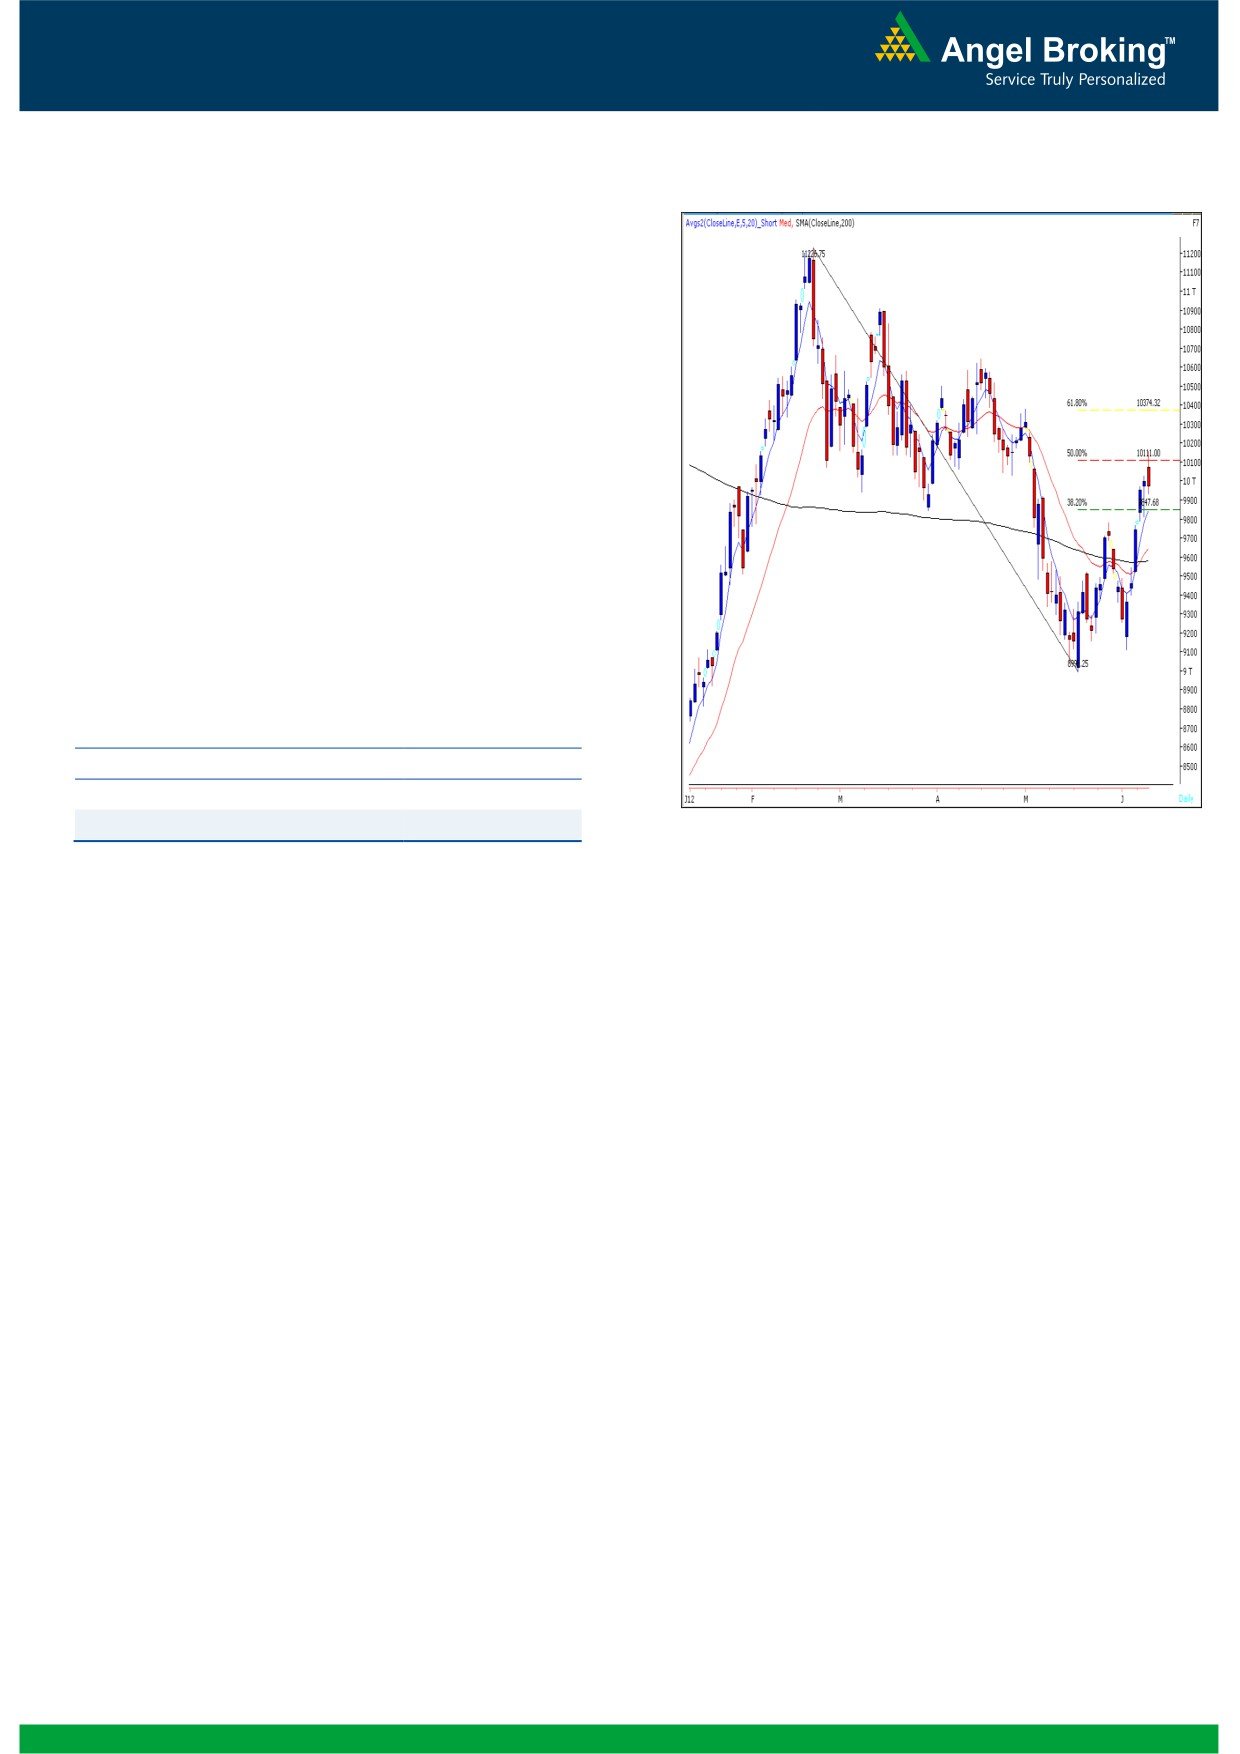
Exhibit 2: Bank Nifty Daily Chart
Bank Nifty Outlook - (9969)
Yesterday, Bank Nifty opened with an upside gap in
line with our benchmark indices and traded in a
narrow range during first half of the session.
However, selling pressure in the last hour of trade led
the index to close in the negative territory. We are
now witnessing a “Bearish Engulfing” candlestick
pattern near 50% Fibonacci retracement of the fall
from February 22, 2012 - May 18, 2012. Moreover,
the momentum oscillators on the hourly chart are
negatively poised. The effect of mentioned candlestick
pattern will be seen if the index manages to close
below yesterday’s low of 9934. In such a scenario the
index is likely to drift towards, 9755 - 9632 levels. On
the upside the zone of 10158 - 10200 is likely to act
as resistance for the day.
Actionable points:
View
Neutral
Resistance Levels
10158 - 10200
Support Levels
9810 - 9755
Source: Falcon
2
Daily Technical Report
June 12, 2012
Daily Pivot Levels for Nifty 50 Stocks
SCRIPS
S2
S1
PIVOT
R1
R2
SENSEX
16,463
16,566
16,730
16,832
16,996
NIFTY
4,989
5,022
5,073
5,105
5,157
BANKNIFTY
9,797
9,883
10,020
10,107
10,244
ACC
1,127
1,138
1,154
1,165
1,180
AMBUJACEM
148
149
151
152
154
ASIANPAINT
3,773
3,805
3,850
3,881
3,926
AXISBANK
1,006
1,021
1,047
1,062
1,088
BAJAJ-AUTO
1,513
1,538
1,557
1,582
1,602
BANKBARODA
692
703
719
730
746
BHARTIARTL
298
301
305
308
312
BHEL
208
212
219
223
229
BPCL
695
703
715
723
736
CAIRN
311
316
323
328
336
CIPLA
295
298
305
308
315
COALINDIA
324
328
333
337
342
DLF
187
190
195
198
203
DRREDDY
1,582
1,596
1,617
1,632
1,653
GAIL
330
333
337
340
343
GRASIM
2,303
2,322
2,339
2,357
2,374
HCLTECH
464
473
486
495
508
HDFC
650
653
659
662
668
HDFCBANK
533
537
543
548
554
HEROMOTOCO
1,925
1,950
1,987
2,013
2,050
HINDALCO
118
119
121
122
124
HINDUNILVR
426
431
434
439
443
ICICIBANK
807
817
833
843
858
IDFC
127
129
132
134
137
INFY
2,393
2,409
2,431
2,447
2,469
ITC
235
237
239
242
244
JINDALSTEL
416
424
437
445
458
JPASSOCIAT
67
68
70
71
73
KOTAKBANK
569
573
577
581
586
LT
1,240
1,262
1,297
1,318
1,354
M&M
664
672
684
692
704
MARUTI
1,077
1,094
1,119
1,135
1,160
NTPC
152
154
156
158
160
ONGC
250
253
257
260
265
PNB
745
758
779
793
813
POWERGRID
106
107
108
108
109
RANBAXY
474
479
487
492
500
RELIANCE
707
715
726
733
744
RELINFRA
484
497
514
527
543
SAIL
92
94
96
97
99
SBIN
2,117
2,141
2,179
2,203
2,242
SESAGOA
177
181
188
192
198
SIEMENS
664
673
685
693
705
STER
97
99
102
104
108
SUNPHARMA
568
573
580
586
593
TATAMOTORS
227
231
238
242
248
TATAPOWER
93
95
97
98
100
TATASTEEL
400
405
412
417
424
TCS
1,217
1,225
1,236
1,244
1,255
WIPRO
391
396
402
406
412
3
Daily Technical Report
June 12, 2012
Research Team Tel: 022 - 39357800
DISCLAIMER
This document is solely for the personal information of the recipient, and must not be singularly used as the basis of any investment
decision. Nothing in this document should be construed as investment or financial advice. Each recipient of this document should make
such investigations as they deem necessary to arrive at an independent evaluation of an investment in the securities of the companies
referred to in this document (including the merits and risks involved), and should consult their own advisors to determine the merits and
risks of such an investment.
Angel Broking Limited, its affiliates, directors, its proprietary trading and investment businesses may, from time to time, make
investment decisions that are inconsistent with or contradictory to the recommendations expressed herein. The views contained in this
document are those of the analyst, and the company may or may not subscribe to all the views expressed within.
Reports based on technical and derivative analysis center on studying charts of a stock's price movement, outstanding positions and
trading volume, as opposed to focusing on a company's fundamentals and, as such, may not match with a report on a company's
fundamentals.
The information in this document has been printed on the basis of publicly available information, internal data and other reliable
sources believed to be true, but we do not represent that it is accurate or complete and it should not be relied on as such, as this
document is for general guidance only. Angel Broking Limited or any of its affiliates/ group companies shall not be in any way
responsible for any loss or damage that may arise to any person from any inadvertent error in the information contained in this report.
Angel Broking Limited has not independently verified all the information contained within this document. Accordingly, we cannot testify,
nor make any representation or warranty, express or implied, to the accuracy, contents or data contained within this document. While
Angel Broking Limited endeavours to update on a reasonable basis the information discussed in this material, there may be regulatory,
compliance, or other reasons that prevent us from doing so.
This document is being supplied to you solely for your information, and its contents, information or data may not be reproduced,
redistributed or passed on, directly or indirectly.
Angel Broking Limited and its affiliates may seek to provide or have engaged in providing corporate finance, investment banking or
other advisory services in a merger or specific transaction to the companies referred to in this report, as on the date of this report or in
the past.
Neither Angel Broking Limited, nor its directors, employees or affiliates shall be liable for any loss or damage that may arise from or in
connection with the use of this information.
Note: Please refer to the important `Stock Holding Disclosure' report on the Angel website (Research Section). Also, please refer to the
latest update on respective stocks for the disclosure status in respect of those stocks. Angel Broking Limited and its affiliates may have
investment positions in the stocks recommended in this report.
Research Team
Shardul Kulkarni
-
Head - Technicals
Sameet Chavan
-
Technical Analyst
Sacchitanand Uttekar
-
Technical Analyst
Mehul Kothari
-
Technical Analyst
Ankur Lakhotia
-
Technical Analyst
Angel Broking Pvt. Ltd.
Registered Office: G-1, Ackruti Trade Centre, Rd. No. 7, MIDC, Andheri (E), Mumbai - 400 093.
Corporate Office: 6th Floor, Ackruti Star, MIDC, Andheri (E), Mumbai - 400 093. Tel: (022) 3952 6600
Sebi Registration No: INB 010996539
4