Technical Research | April 12, 2012
Daily Technical Report
Sensex (17199) / NIFTY (5227)
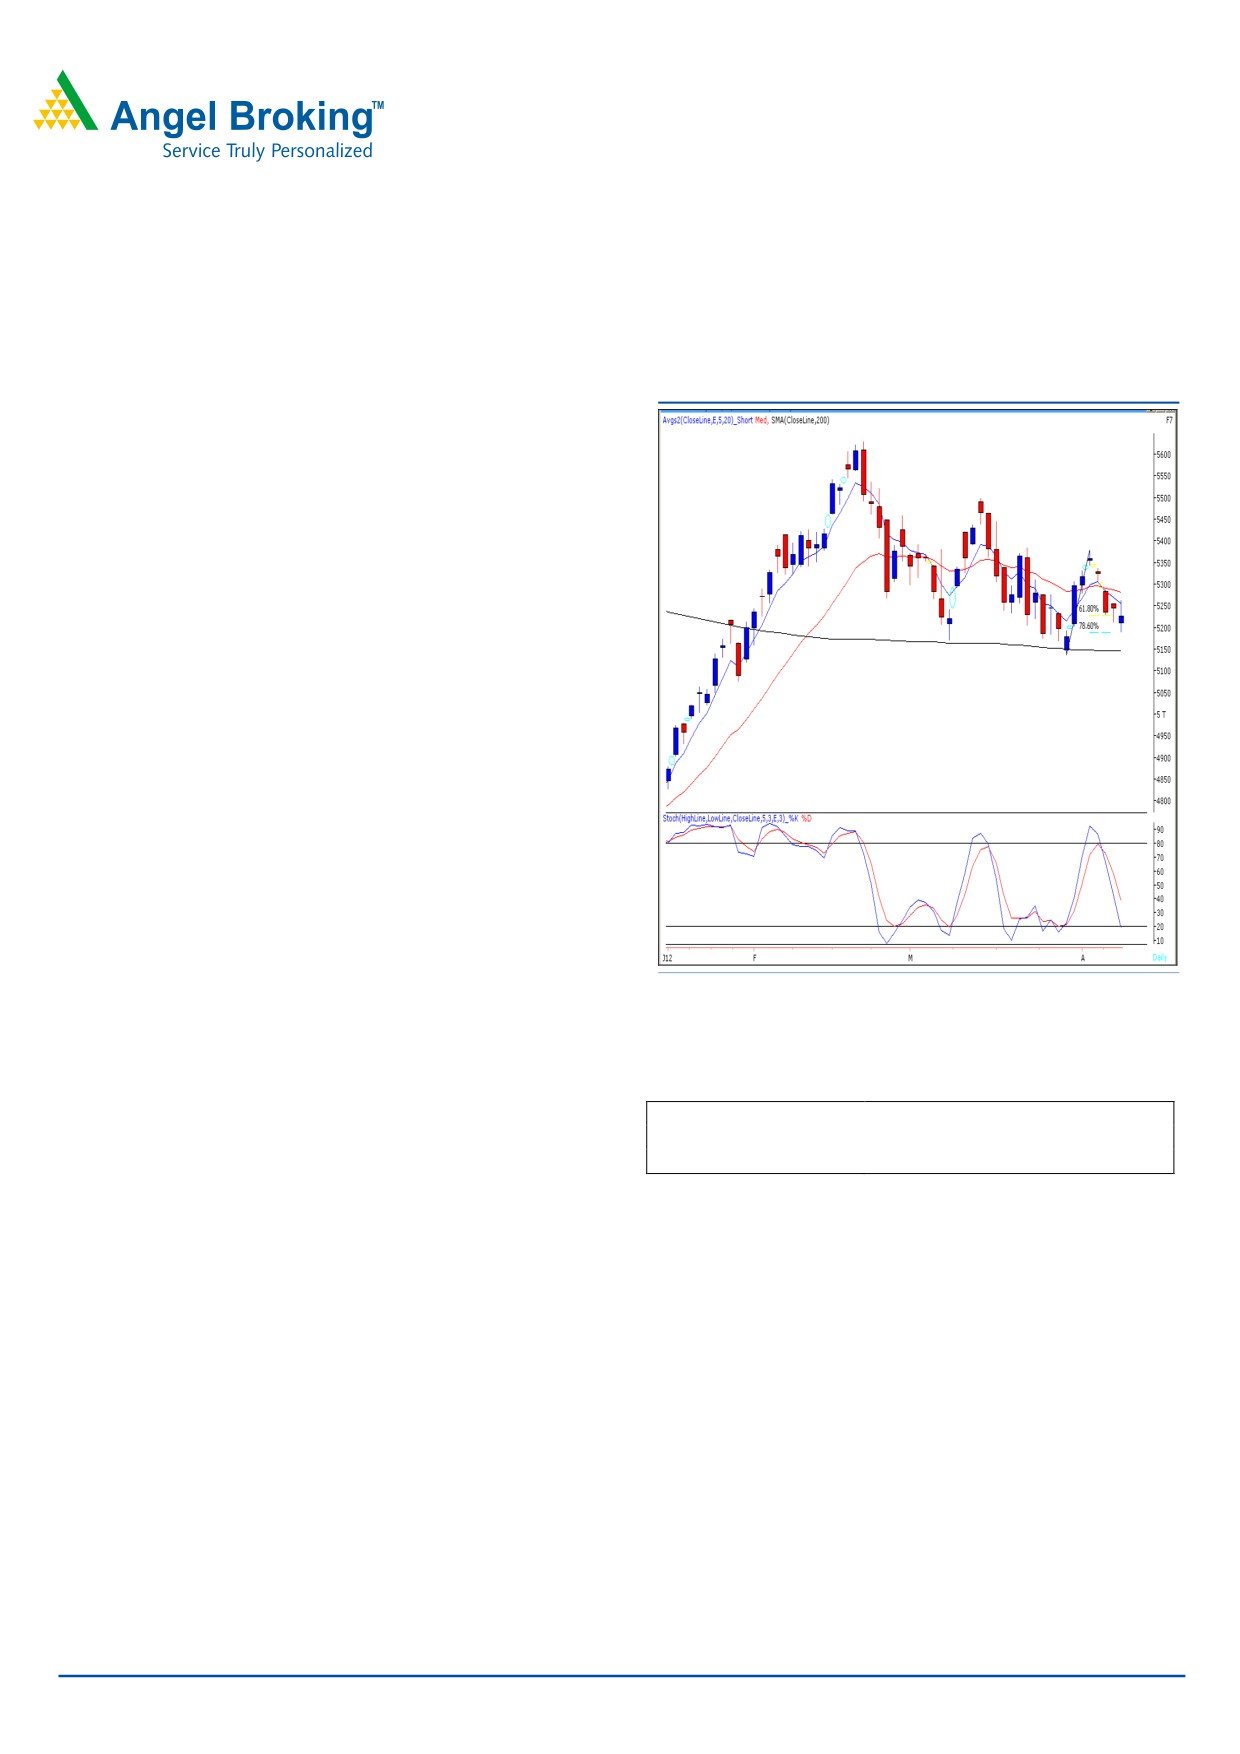
Exhibit 1: Nifty Daily Chart
Yesterday, markets opened lower in-line with negative
globel cues and drifted marginally below 5200. However,
strong buying interest in the second half led indices to close
near 5225 mark. On sectoral front, Metal, Consumer
Durables and Oil & Gas counters were among the major
losers, whereas Health Care, IT, and Baking stocks ended
with a minor gain. The advance to decline ratio was in favor
of declining counters (A=1240 D=1524) (Source
-
Formation:
• The 200-day SMA (Simple Moving Average) and 20-
day EMA (Exponential Moving Average) have now shifted to
17100 / 5150 and 17333 / 5275, respectively.
• The ‘20-Week EMA’ is placed at 17200 / 5200 level.
• Indices have taken support near 78.60% Fibonacci
Retracement level (17080 / 5187) of the rise from 16920 to
17664 / 5135 to 5379 levels.
Source: Falcon
Trading strategy:
Actionable points:
View
Positive Above 5264
Indices opened lower around 5200 mark and traded in a
Expected Targets
5288 - 5339
narrow range during the first of the session. We witnessed a
Support Levels
5190 - 5171 - 5135
strong positive momentum during the second half, which
pushed indices marginally above its hourly ’20 EMA’. We
are now observing that indices have taken support near
78.60% Fibonacci Retracement level (17080 / 5187) of the
rise from 16920 to 17664 / 5135 to 5379 levels. Hence,
we may witness a positive momentum if indices sustain
above yesterday’s high of 17319 / 5264. In this scenario,
markets may rally towards 17407 - 17554 / 5288 - 5339
levels. Conversely, a fall below yesterday’s low of 17075 /
5190 would lead to further selling and then indices are
likely to slide towards the next support levels of 17008 -
16920 / 5171 - 5135 levels.
For Private Circulation Only |
1
Technical Research | April 12, 2012
Bank Nifty Outlook - (10214)
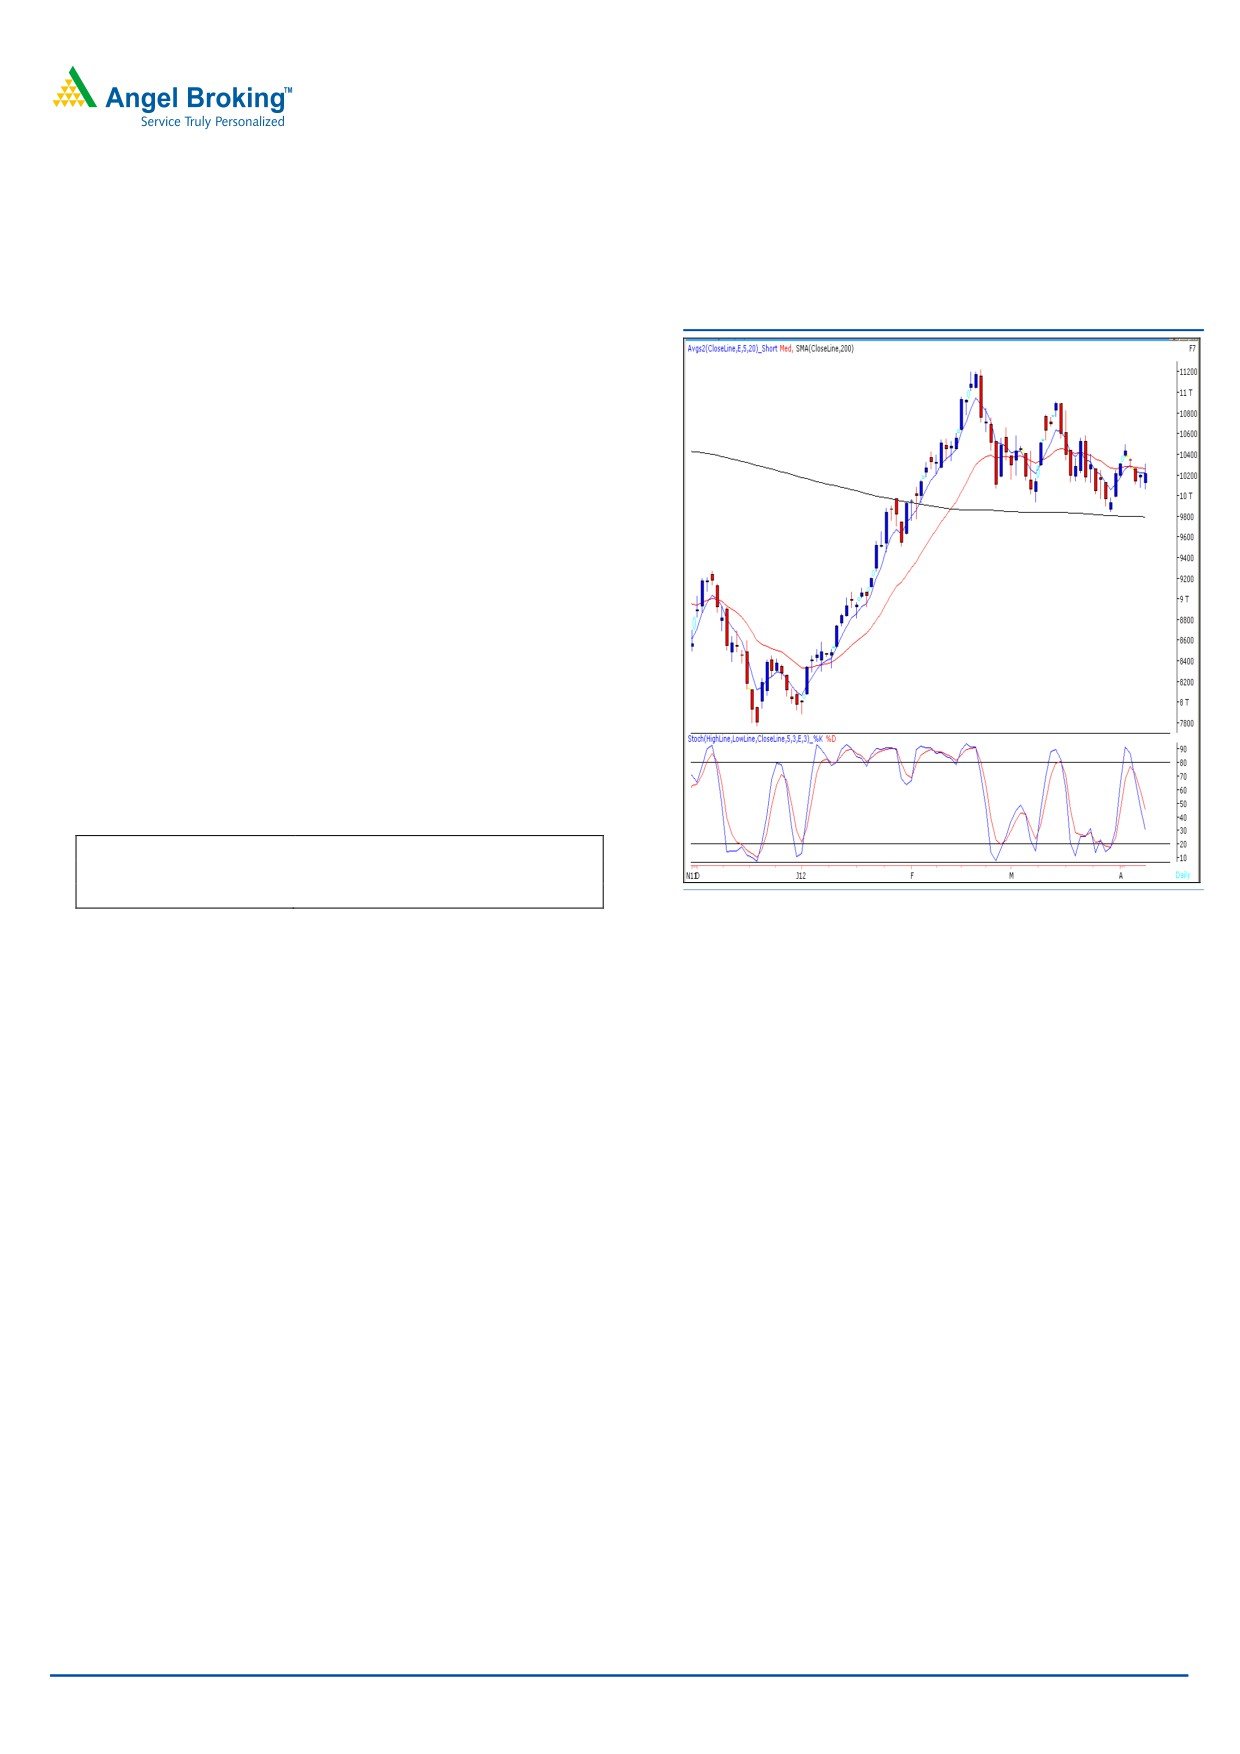
Exhibit 2: Bank Nifty Daily Chart
Yesterday, Bank Nifty opened on a flat note, and traded
with extreme volatility throughout the session. The “Bullish
Harami” candlestick pattern has been confirmed as the
index has managed to close marginally above the 10210
level. We had mentioned in our previous report that we
are witnessing a positive crossover in “RSI - Smoothened”
oscillator on the hourly chart and possibility of a pullback
cannot be ruled out. We expect volatility to increase as
the momentum oscillators on the hourly and daily chart
paint a mixed picture. Thus on the upside if Bank Nifty
sustains above yesterday’s high of 10310 then it is likely
to test resistance zone of 10382 - 10410 levels. On the
downside 10114 - 9986 levels are likely to act as support
in coming trading session.
Actionable points:
View
Neutral
Resistance Levels
10310 - 10382 - 10410
Support Levels
10114 - 9986
Source: Falcon
For Private Circulation Only |
2
Technical Research | April 12, 2012
Positive Bias:
Positive
Expected
Stock Name
CMP
5 Day EMA
20 Day EMA
Remarks
Above
Target
View will change below
Power Grid
111.7
110.3
109.1
112
115
108
For Private Circulation Only |
3
Technical Research | April 12, 2012
Daily Pivot Levels for Nifty 50 Stocks
SCRIPS
S2
S1
PIVOT
R1
R2
SENSEX
16,955
17,077
17,198
17,320
17,441
NIFTY
5,154
5,191
5,227
5,263
5,300
BANKNIFTY
9,946
10,080
10,195
10,329
10,444
ACC
1,182
1,209
1,248
1,275
1,314
AMBUJACEM
154
157
161
164
168
AXISBANK
1,118
1,138
1,154
1,173
1,189
BAJAJ-AUTO
1,604
1,619
1,637
1,652
1,670
BHARTIARTL
316
319
324
328
333
BHEL
247
249
252
253
256
BPCL
646
658
672
685
699
CAIRN
338
342
345
349
352
CIPLA
306
308
311
313
316
COALINDIA
324
328
332
336
340
DLF
197
199
202
205
208
DRREDDY
1,689
1,710
1,725
1,746
1,760
GAIL
344
349
355
360
366
HCLTECH
479
485
490
495
500
HDFC
659
666
673
681
687
HDFCBANK
511
519
525
533
539
HEROMOTOCO
1,939
1,956
1,970
1,986
2,000
HINDALCO
121
122
124
126
128
HINDUNILVR
405
411
416
422
427
ICICIBANK
840
852
864
876
888
IDFC
130
132
133
134
135
INFY
2,709
2,757
2,791
2,839
2,873
ITC
225
227
229
231
232
JINDALSTEL
477
482
488
494
500
JPASSOCIAT
77
78
79
80
82
KOTAKBANK
527
543
553
569
580
LT
1,253
1,268
1,282
1,297
1,311
M&M
680
687
694
701
708
MARUTI
1,250
1,261
1,273
1,284
1,296
NTPC
159
162
164
167
169
ONGC
258
261
264
267
270
PNB
878
889
901
911
923
POWERGRID
108
110
111
113
114
RANBAXY
474
481
489
497
505
RCOM
81
82
84
85
87
RELIANCE
719
725
732
737
745
RELINFRA
530
541
554
564
577
RPOWER
114
116
117
118
120
SAIL
90
91
93
93
95
SBIN
2,089
2,124
2,152
2,186
2,214
SESAGOA
175
177
179
182
184
SIEMENS
757
764
772
779
787
STER
99
101
102
103
105
SUNPHARMA
549
563
571
585
594
SUZLON
23
24
24
25
26
TATAMOTORS
278
280
283
286
289
TATAPOWER
97
99
103
106
109
TATASTEEL
437
442
448
453
459
TCS
1,123
1,131
1,143
1,150
1,163
WIPRO
437
441
445
449
453
Technical Research Team
For Private Circulation Only |
4
Technical Report
RESEARCH TEAM
Shardul Kulkarni
Head - Technicals
Sameet Chavan
Technical Analyst
Sacchitanand Uttekar
Technical Analyst
Mehul Kothari
Technical Analyst
Ankur Lakhotia
Technical Analyst
Research Team: 022-3952 6600
DISCLAIMER: This document is not for public distribution and has been furnished to you solely for your information and must not
be reproduced or redistributed to any other person. Persons into whose possession this document may come are required to observe
these restrictions.
Opinion expressed is our current opinion as of the date appearing on this material only. While we endeavor to update on a
reasonable basis the information discussed in this material, there may be regulatory, compliance, or other reasons that prevent us
from doing so. Prospective investors and others are cautioned that any forward-looking statements are not predictions and may be
subject to change without notice. Our proprietary trading and investment businesses may make investment decisions that are
inconsistent with the recommendations expressed herein.
The information in this document has been printed on the basis of publicly available information, internal data and other reliable
sources believed to be true and are for general guidance only. While every effort is made to ensure the accuracy and completeness of
information contained, the company takes no guarantee and assumes no liability for any errors or omissions of the information. No
one can use the information as the basis for any claim, demand or cause of action.
Recipients of this material should rely on their own investigations and take their own professional advice. Each recipient of this
document should make such investigations as it deems necessary to arrive at an independent evaluation of an investment in the
securities of companies referred to in this document (including the merits and risks involved), and should consult their own advisors to
determine the merits and risks of such an investment. Price and value of the investments referred to in this material may go up or
down. Past performance is not a guide for future performance. Certain transactions - futures, options and other derivatives as well as
non-investment grade securities - involve substantial risks and are not suitable for all investors. Reports based on technical analysis
centers on studying charts of a stock's price movement and trading volume, as opposed to focusing on a company's fundamentals
and as such, may not match with a report on a company's fundamentals.
We do not undertake to advise you as to any change of our views expressed in this document. While we would endeavor to update
the information herein on a reasonable basis, Angel Broking, its subsidiaries and associated companies, their directors and
employees are under no obligation to update or keep the information current. Also there may be regulatory, compliance, or other
reasons that may prevent Angel Broking and affiliates from doing so. Prospective investors and others are cautioned that any
forward-looking statements are not predictions and may be subject to change without notice.
Angel Broking Limited and affiliates, including the analyst who has issued this report, may, on the date of this report, and from time
to time, have long or short positions in, and buy or sell the securities of the companies mentioned herein or engage in any other
transaction involving such securities and earn brokerage or compensation or act as advisor or have other potential conflict of interest
with respect to company/ies mentioned herein or inconsistent with any recommendation and related information and opinions.
Angel Broking Limited and affiliates may seek to provide or have engaged in providing corporate finance, investment banking or
other advisory services in a merger or specific transaction to the companies referred to in this report, as on the date of this report or
in the past.
Sebi Registration No: INB 010996539
For Private Circulation Only |