Technical Research | March 12, 2012
Daily Technical Report
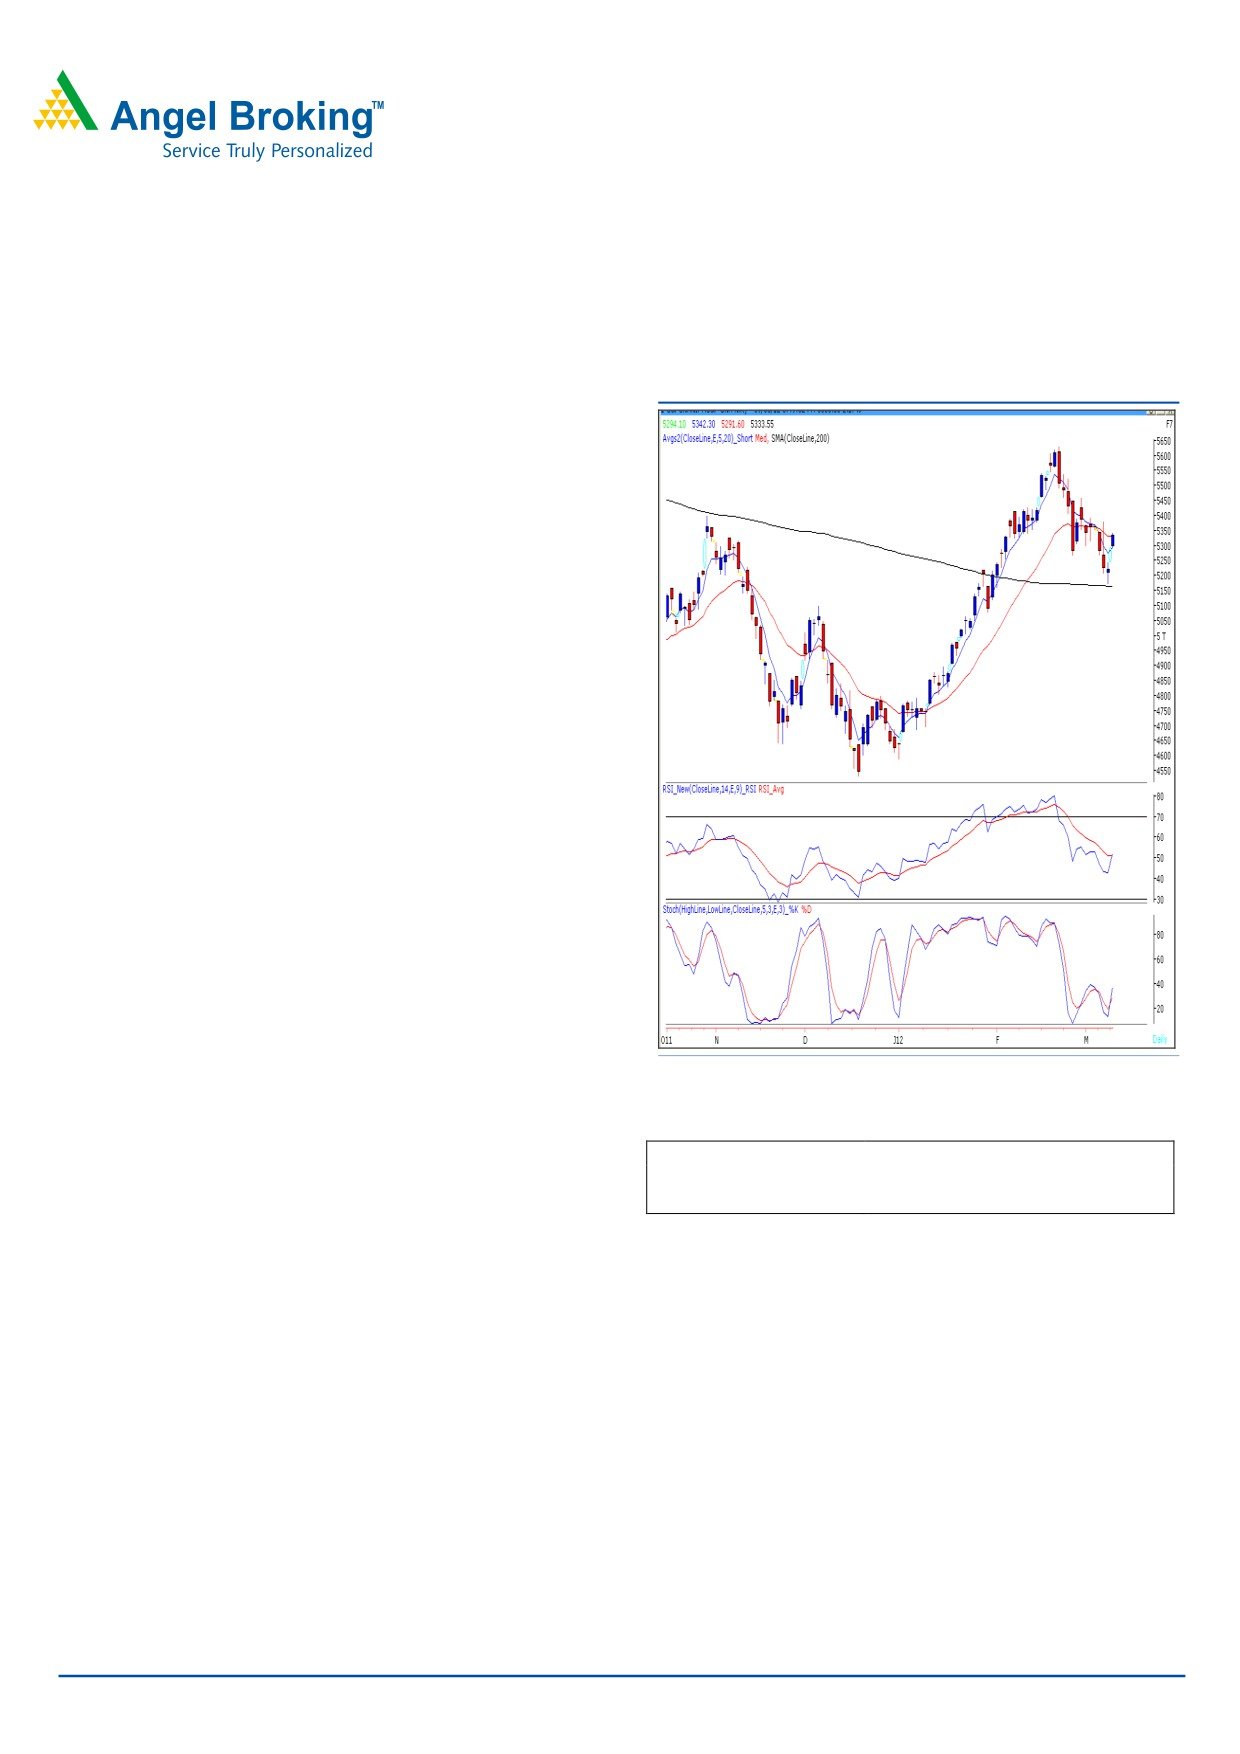
Sensex (17503) / NIFTY (5334)
Exhibit 1: Nifty Daily Chart
On Friday, markets opened with a significant upside gap on
the back of positive global cues and maintained their
positive momentum throughout the day to close well above
the 5300 mark. On the sectoral front, The Metal, Capital
Goods and Banking sectors contributed heavily in Friday’s
upside rally whereas FMCG sector ended with a nominal
loss. The advance to decline ratio was strongly in favor of
advancing counters. (A=1845 D=989) (Source
-
Formation:
• The 200-day SMA and 20-day EMA have now shifted to
17164 / 5163 and 17556 / 5330, respectively.
• The “20-Week EMA” is placed at 17120 / 5170 level.
• The Daily momentum oscillators viz., the RSI and the
Stochastic are positively poised.
• The weekly chart depicts a “Bullish Hammer” and
“Bullish Dragon Fly Doji” Japanese candlesticks pattern
in Sensex and Nifty, respectively.
Source: Falcon
Actionable points:
Trading strategy:
View
Bullish Above 5382
After a negative start for the week, indices bounced back
Expected Targets
5459 - 5475
sharply on Friday after the testing the 200-day SMA support
Support level
5290
level of 17164 / 5163 during the week. This level coincides
with the “20-week EMA”. Further, the weekly chart depicts
In case the optimism last further on the back of positive
Bullish Japanese candlesticks patterns in both the Sensex
global data or a market friendly Union Budget, the
and the Nifty. The mentioned patterns will be confirmed
possibility of testing recent swing high of 18524 / 5630
once the indices cross and sustain above the high of these
cannot be ruled out. Conversely, 17164 - 17120 / 5170 -
patterns.(17692 / 5382). In addition, we are now observing
5163 levels remain to be a strong support zone in coming
that the momentum oscillators on the daily chart are
trading sessions.
positively poised. Hence, a move beyond 17692 / 5382
level may push indices higher to test 18001 - 18250 /
5459 - 5538 levels.
For Private Circulation Only |
1
Technical Research | March 12, 2012
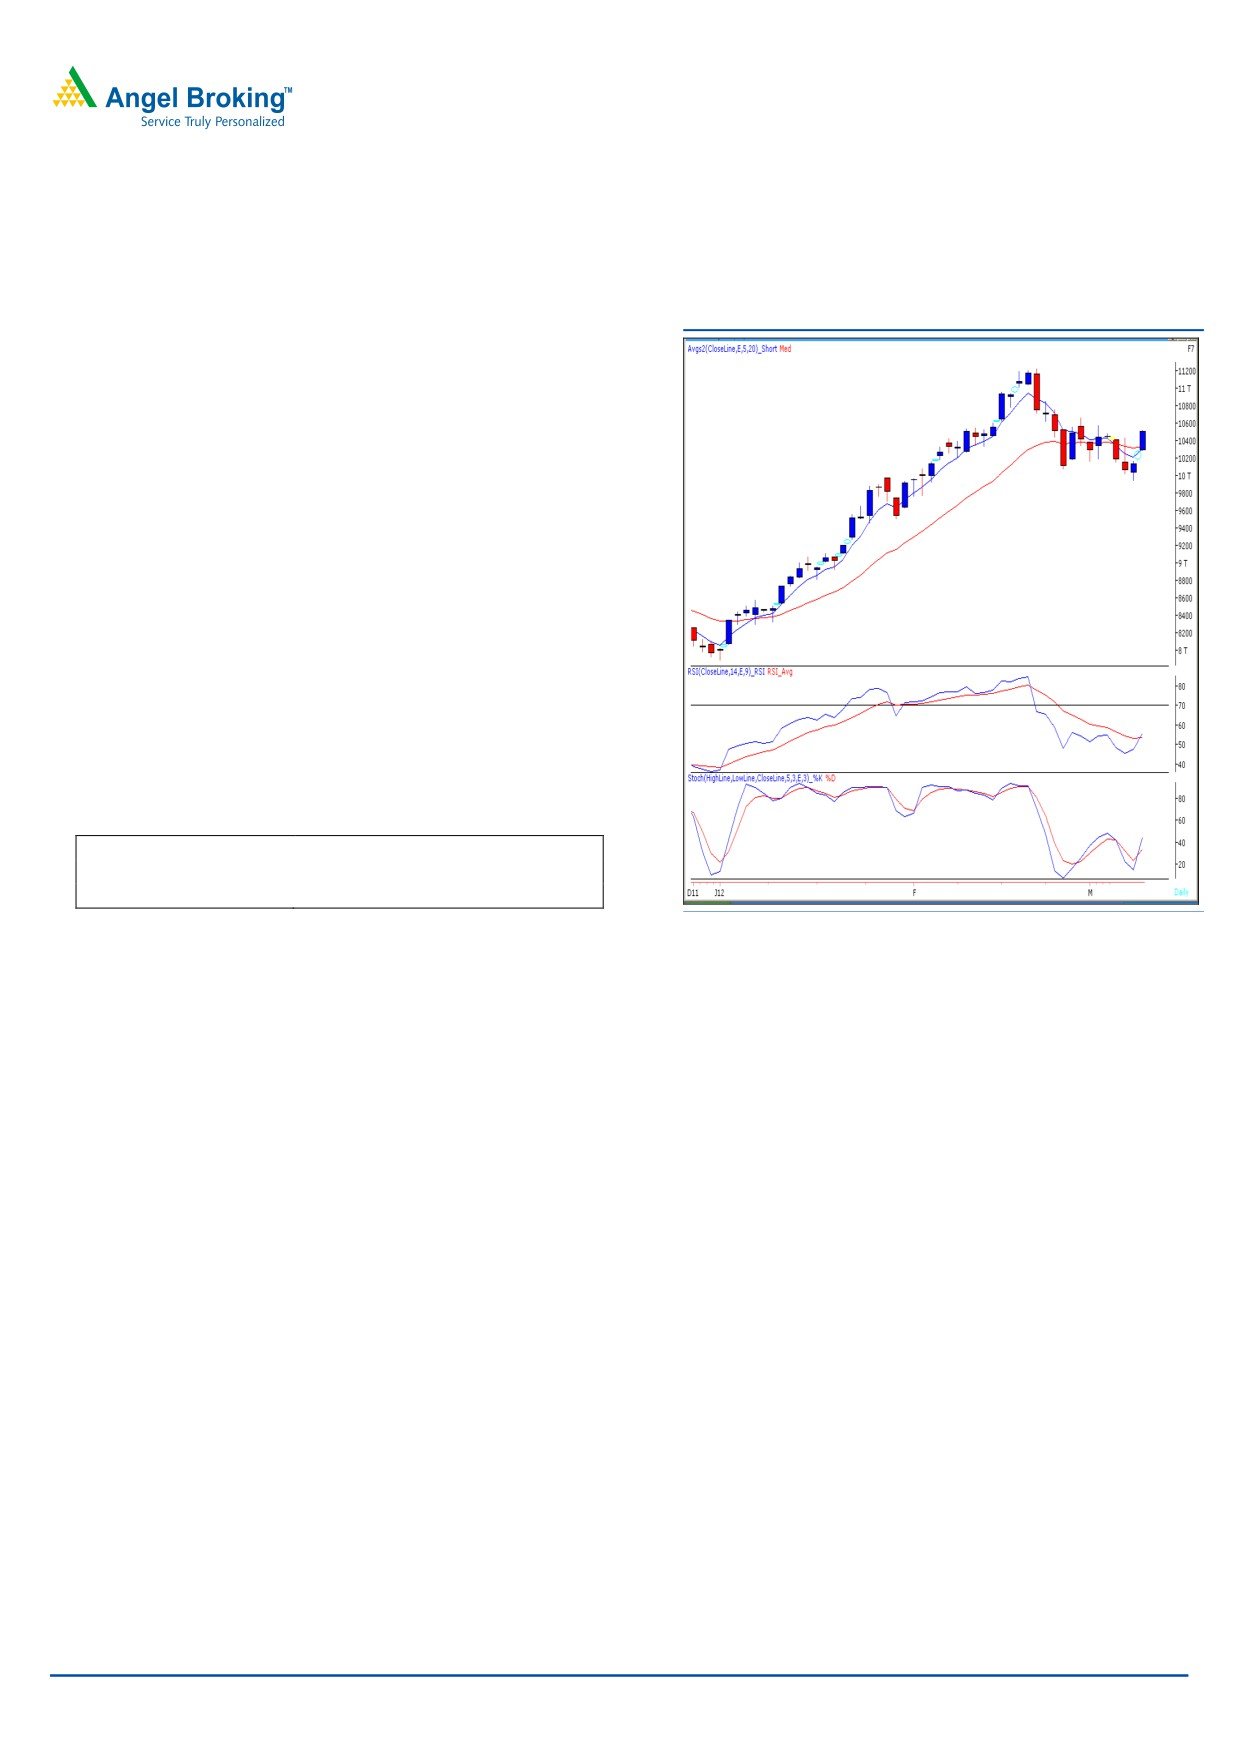
Bank Nifty Outlook - (10506)
Exhibit 2: Bank Nifty Daily Chart
On Friday, Bank Nifty opened with an upside gap and
gained momentum as the day progressed to close near
the highest point of the day. The index has managed to
give a close well above its “20-day EMA”, which is a sign
of strength. In addition, we are now witnessing a positive
crossover in “RSI” and “Stochastic” momentum oscillator
on the daily chart. It is likely that the Bank Nifty will open
significantly higher on account of the unexpected cut in
CRR by the RBI on Friday evening. The positive impact of
the mentioned technical tools will come into force once
the index sustains above Friday’s high of 10527. In this
case the index is likely to rally towards 10585 - 10735
levels. On the downside 10390 - 10286 levels are likely
to act as support in coming trading session.
Actionable points:
View
Bullish above 10527
Expected Target
10585 - 10735
Support Levels
10390 - 10286
Source: Falcon
For Private Circulation Only |
2
Technical Research | March 12, 2012
Positive Bias:
20 Day
Positive
Expected
Stock Name
CMP
5 Day EMA
Remarks
EMA
Above
Target
View will change below
Coal India
336
331.4
330
338.5
354
330.4
View will change below
DLF
204
202.5
215.5
206.5
218
201
For Private Circulation Only |
3
Technical Research | March 12, 2012
Daily Pivot Levels for Nifty 50 Stocks
SCRIPS
S2
S1
PIVOT
R1
R2
SENSEX
17,248
17,375
17,454
17,581
17,659
NIFTY
5,272
5,303
5,322
5,353
5,373
BANKNIFTY
10,200
10,353
10,440
10,593
10,679
ACC
1,287
1,303
1,317
1,333
1,347
AMBUJACEM
160
161
163
165
166
AXISBANK
1,172
1,193
1,206
1,227
1,240
BAJAJ-AUTO
1,720
1,737
1,756
1,772
1,791
BHARTIARTL
328
333
337
342
345
BHEL
270
274
277
282
285
BPCL
642
653
660
671
677
CAIRN
357
366
371
380
386
CIPLA
304
306
309
310
313
COALINDIA
326
331
334
340
343
DLF
199
202
204
207
209
DRREDDY
1,691
1,697
1,703
1,709
1,716
GAIL
344
347
350
352
356
HCLTECH
490
498
506
514
522
HDFC
653
667
675
688
696
HDFCBANK
516
520
523
527
531
HEROMOTOCO
1,868
1,889
1,912
1,933
1,956
HINDALCO
130
133
134
136
138
HINDUNILVR
377
379
384
387
391
ICICIBANK
861
888
902
929
944
IDFC
139
142
145
148
151
INFY
2,814
2,835
2,869
2,890
2,924
ITC
204
206
210
211
215
JINDALSTEL
531
553
567
589
603
JPASSOCIAT
73
76
77
80
81
KOTAKBANK
545
552
558
565
571
LT
1,241
1,272
1,291
1,321
1,341
M&M
650
664
674
688
698
MARUTI
1,301
1,321
1,340
1,360
1,379
NTPC
168
171
173
176
177
ONGC
278
280
282
285
287
PNB
935
947
953
964
971
POWERGRID
108
109
110
111
112
RANBAXY
407
411
419
423
431
RCOM
92
93
94
96
97
RELIANCE
764
769
774
779
785
RELINFRA
612
626
637
650
661
RPOWER
126
129
132
134
138
SAIL
91
93
94
96
97
SBIN
2,164
2,195
2,219
2,250
2,274
SESAGOA
193
197
201
204
208
SIEMENS
769
779
793
804
818
STER
111
113
114
116
117
SUNPHARMA
556
563
569
577
583
SUZLON
27
27
28
28
29
TATAMOTORS
269
275
278
284
288
TATAPOWER
106
107
109
111
112
TATASTEEL
423
439
448
464
474
TCS
1,189
1,199
1,213
1,223
1,237
WIPRO
418
425
437
444
455
Technical Research Team
For Private Circulation Only |
4
Technical Report
RESEARCH TEAM
Shardul Kulkarni
Head - Technicals
Sameet Chavan
Technical Analyst
Sacchitanand Uttekar
Technical Analyst
Mehul Kothari
Technical Analyst
Ankur Lakhotia
Technical Analyst
Research Team: 022-3952 6600
DISCLAIMER: This document is not for public distribution and has been furnished to you solely for your information and must not
be reproduced or redistributed to any other person. Persons into whose possession this document may come are required to observe
these restrictions.
Opinion expressed is our current opinion as of the date appearing on this material only. While we endeavor to update on a
reasonable basis the information discussed in this material, there may be regulatory, compliance, or other reasons that prevent us
from doing so. Prospective investors and others are cautioned that any forward-looking statements are not predictions and may be
subject to change without notice. Our proprietary trading and investment businesses may make investment decisions that are
inconsistent with the recommendations expressed herein.
The information in this document has been printed on the basis of publicly available information, internal data and other reliable
sources believed to be true and are for general guidance only. While every effort is made to ensure the accuracy and completeness of
information contained, the company takes no guarantee and assumes no liability for any errors or omissions of the information. No
one can use the information as the basis for any claim, demand or cause of action.
Recipients of this material should rely on their own investigations and take their own professional advice. Each recipient of this
document should make such investigations as it deems necessary to arrive at an independent evaluation of an investment in the
securities of companies referred to in this document (including the merits and risks involved), and should consult their own advisors to
determine the merits and risks of such an investment. Price and value of the investments referred to in this material may go up or
down. Past performance is not a guide for future performance. Certain transactions - futures, options and other derivatives as well as
non-investment grade securities - involve substantial risks and are not suitable for all investors. Reports based on technical analysis
centers on studying charts of a stock's price movement and trading volume, as opposed to focusing on a company's fundamentals
and as such, may not match with a report on a company's fundamentals.
We do not undertake to advise you as to any change of our views expressed in this document. While we would endeavor to update
the information herein on a reasonable basis, Angel Broking, its subsidiaries and associated companies, their directors and
employees are under no obligation to update or keep the information current. Also there may be regulatory, compliance, or other
reasons that may prevent Angel Broking and affiliates from doing so. Prospective investors and others are cautioned that any
forward-looking statements are not predictions and may be subject to change without notice.
Angel Broking Limited and affiliates, including the analyst who has issued this report, may, on the date of this report, and from time
to time, have long or short positions in, and buy or sell the securities of the companies mentioned herein or engage in any other
transaction involving such securities and earn brokerage or compensation or act as advisor or have other potential conflict of interest
with respect to company/ies mentioned herein or inconsistent with any recommendation and related information and opinions.
Angel Broking Limited and affiliates may seek to provide or have engaged in providing corporate finance, investment banking or
other advisory services in a merger or specific transaction to the companies referred to in this report, as on the date of this report or
in the past.
Sebi Registration No : INB 010996539
For Private Circulation Only |