Daily Technical Report
June 11, 2012
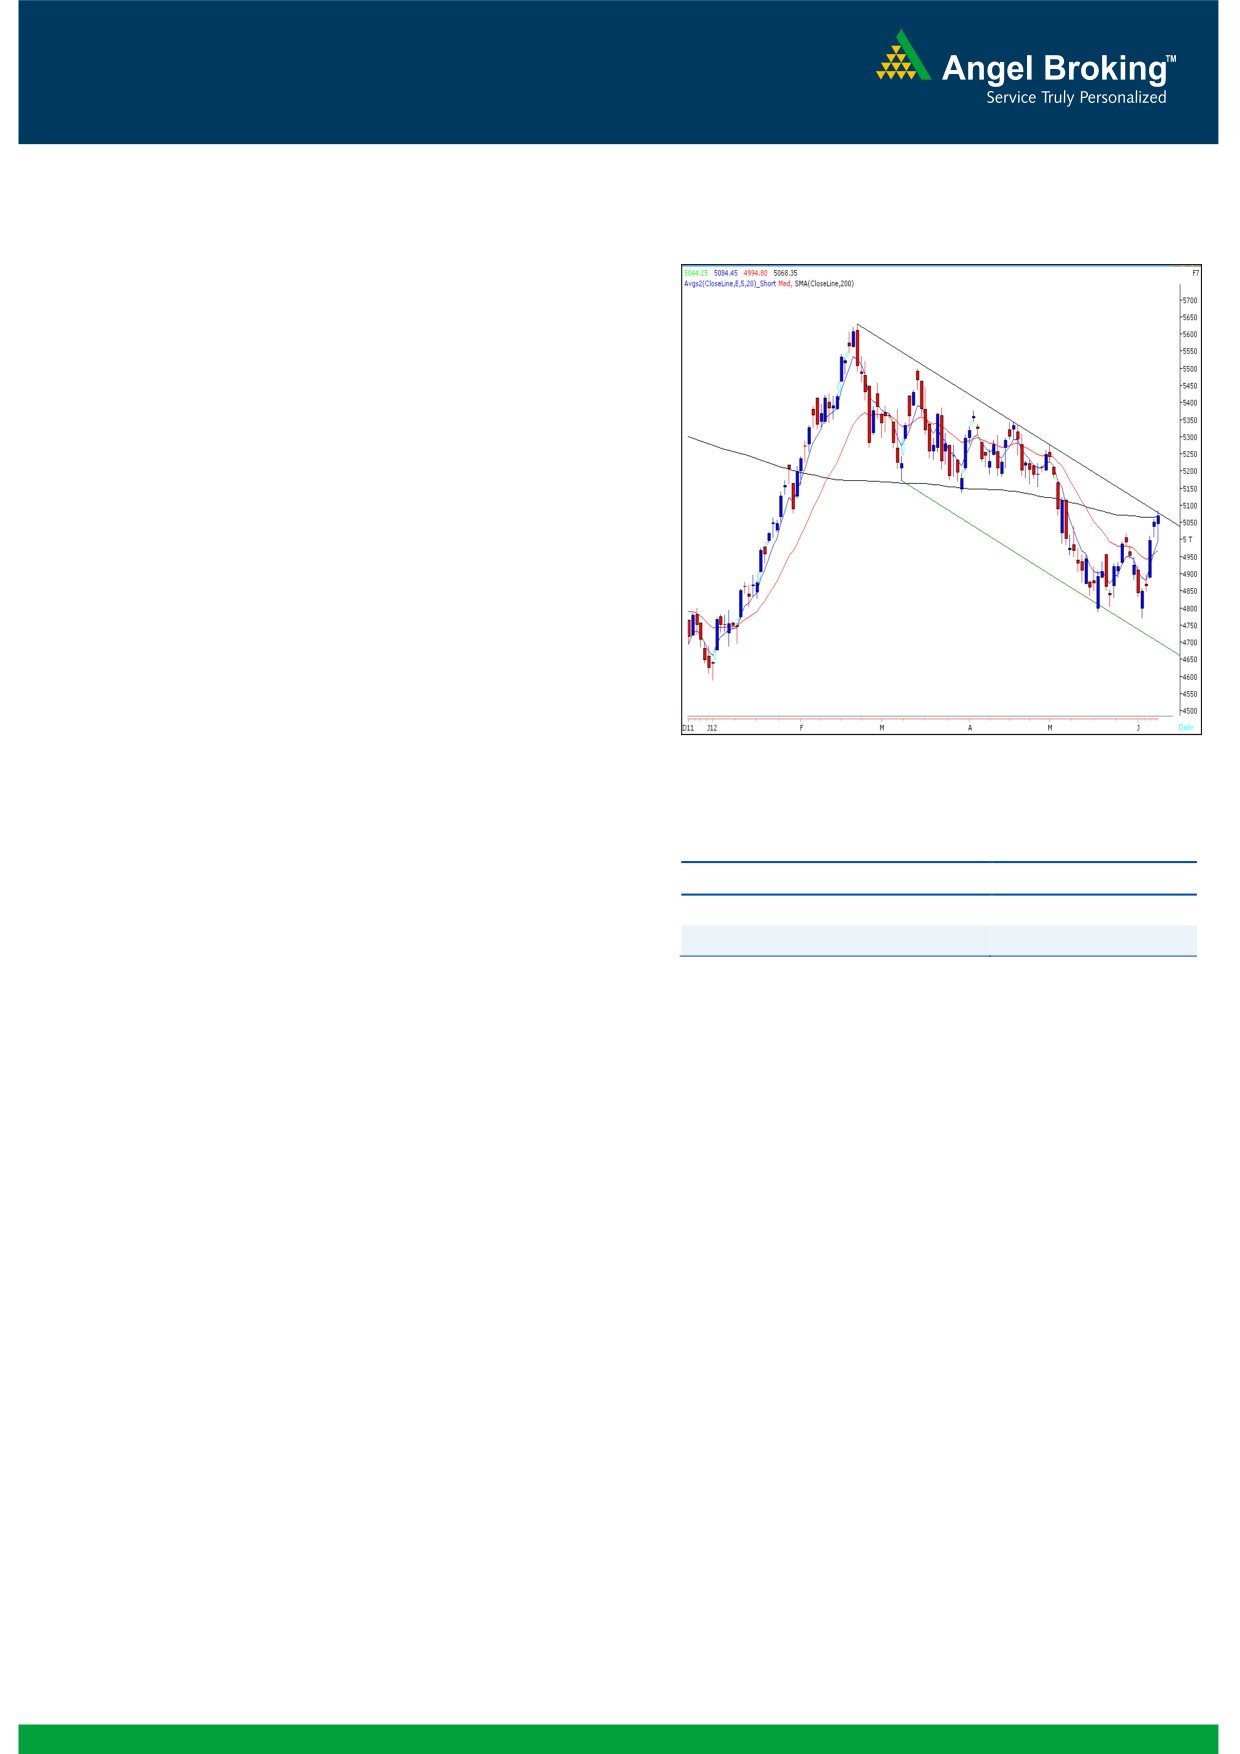
Exhibit 1: Nifty Daily Chart
Sensex (16719) / NIFTY (5068)
On Friday, our benchmark indices rebounded quite
smartly from the day’s low in the final hour of the
session to close at the highest point of the week. On
sectoral front, Consumer Goods, Realty and FMCG
counters rallied significantly during Friday’s session;
whereas IT, Teck and Consumer Durables sector
ended with a nominal loss. The advance to decline
ratio was marginally in favor of advancing counters
Formation
The 200-day SMA (Simple Moving Average) and
20-day EMA (Exponential Moving Average) have
now shifted to 16800 / 5070 and 16380 /
4967, respectively.
The ‘20-Week EMA’ is placed at 16830 / 5100
Source: Falcon
level.
Indices have taken a support near 15860 /
Actionable points:
4766 level, which is the
78.6% Fibonacci
View
Bullish above 5085
Retracement level of the rise from 15135 / 4531
(Low on December 23, 2011) to 18524 / 5630
Expected targets
5125 - 5177
(High on February 22, 2012).
Support Levels
5040 - 4995
On the daily chart, indices are trading near the
upper range of ‘Downward Sloping Channel’
In addition, the weekly ‘RSI’ momentum oscillator is
drawn by joining two highs of February 22,
now signaling a positive crossover. The positive
2012 - April 19, 2012 and low of March 7,
impact of this technical tool would be seen if Indices
2012.
cross and sustain above ‘Downward Sloping
The weekly ‘RSI’ momentum oscillator is
Channel’ as well as ’20-Week EMA’ level of 16830 /
signaling a positive crossover.
5100. However, looking at the pace of the rally in the
last 5 sessions and the momentum gained by the
bulls, we are of the opinion that the resistance zone
Trading strategy:
will most likely be crossed and indices are likely to
rally towards 17400 / 5270 level in next 3 - 5
The bulls have shown tremendous resilience in the
Weeks. While one may argue that the next week has
past 5 trading sessions. The 140 odd point rally on
a slew of game changing events, we would suggest
Wednesday’s session clearly signaled that the bears
traders to trust the chart and act accordingly.
should ideally cover their shorts and move out of the
Although, we have events such as Inflation data on
market. As mentioned, indices found decent support
14th June, Greece election and results on 17th June
around 78.6% Fibonacci retracement level. Markets
and a RBI monetary policy on 18th June, we advise
are now hovering around the resistance zone of the
traders to use declines up to 4950 to buy into the
‘200-day SMA’ and ’20-week EMA’. Also, We are
market. The expected target on the upside would be
now observing that indices are trading near the upper
near to 17400 / 5270. Traders are advised to
range of ‘Downward Sloping Channel’ drawn by
maintain a STRICT stop loss below 4880 on closing
joining two highs of February 22, 2012 - April 19,
basis.
2012 and low of March 7, 2012.
1
Daily Technical Report
June 11, 2012
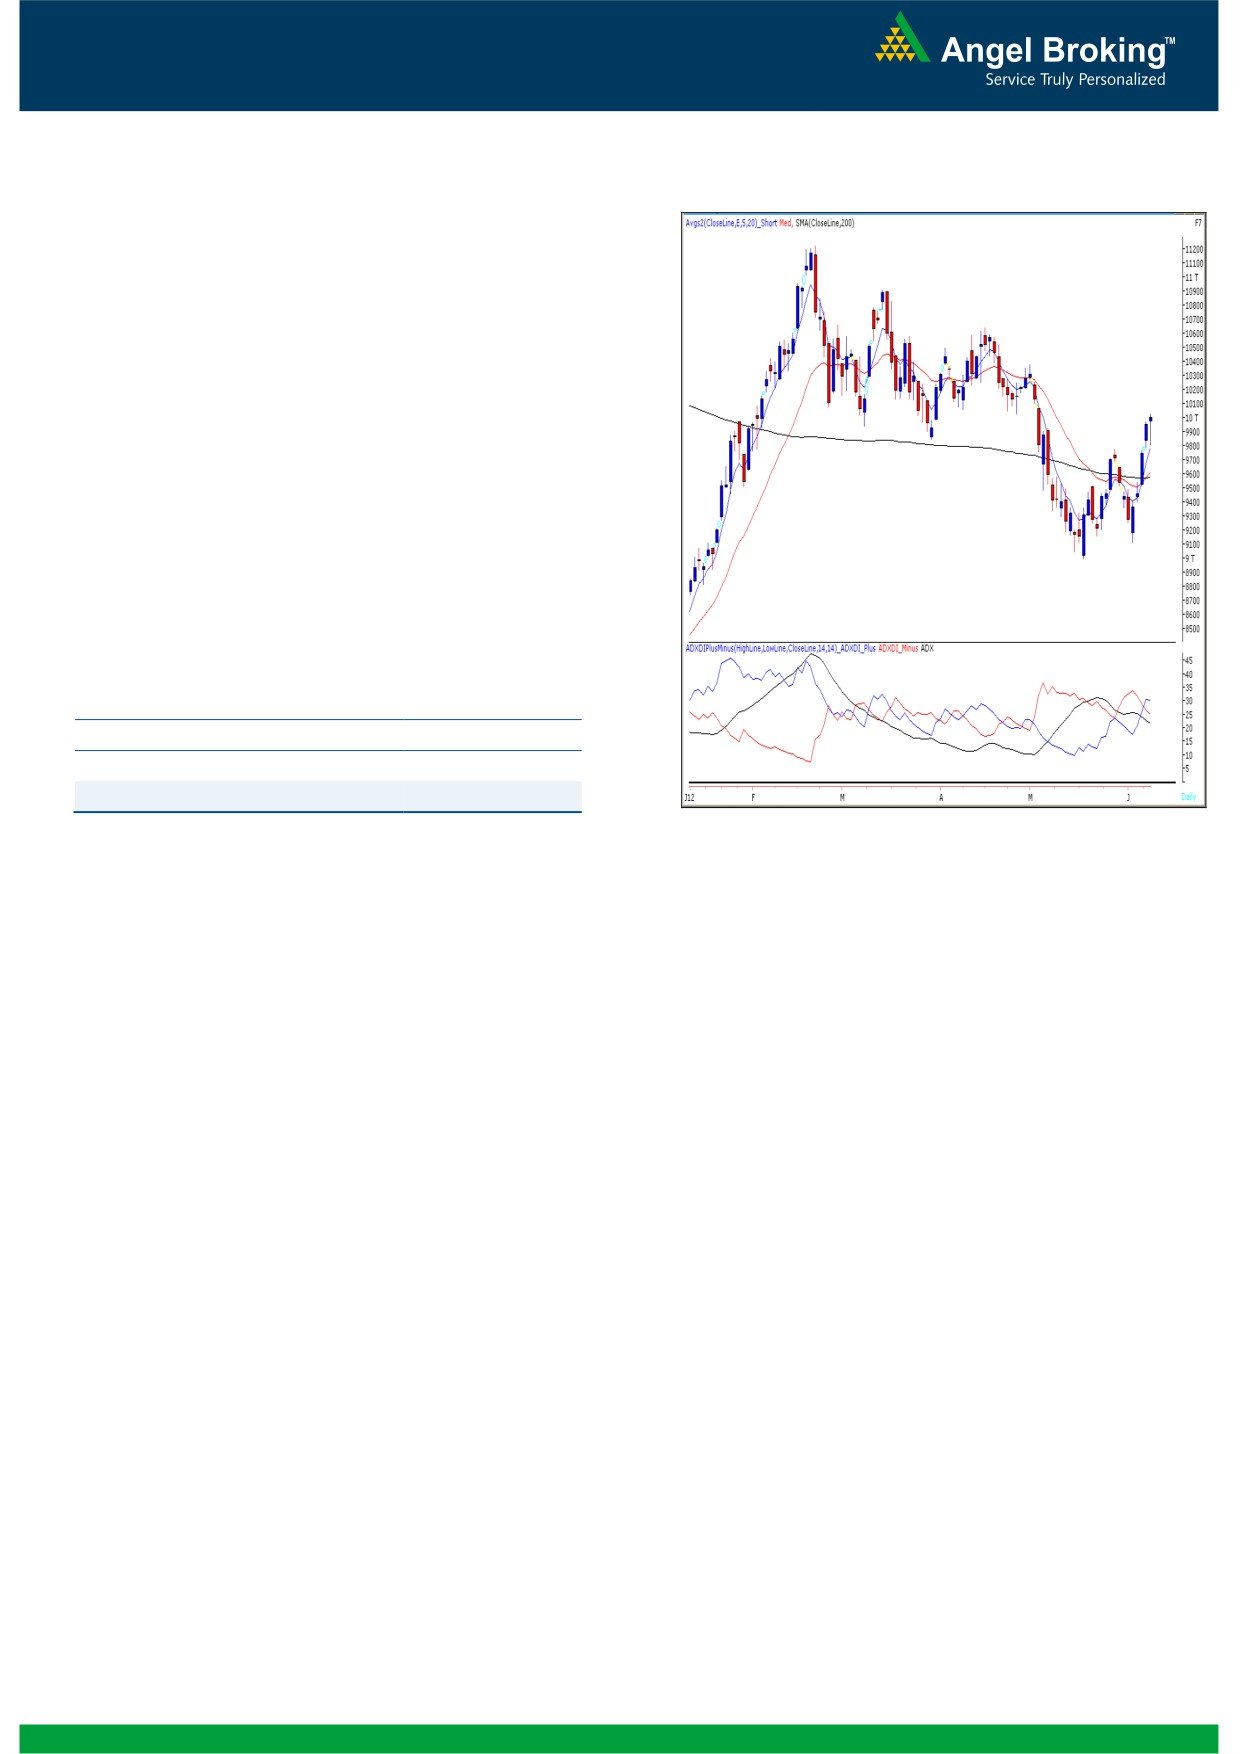
Exhibit 2: Bank Nifty Daily Chart
Bank Nifty Outlook - (9999)
On Friday, Bank Nifty opened on a positive note and
drifted lower to test the hourly “20 EMA”. However
during the second half of the session buying emerged
near this support level which led the index to test the
resistance level of 10029. The positive crossover in
directional indicators in “ADX (14)” mentioned in our
previous report is still intact. At this juncture, we are
witnessing a narrow range body formation on the
daily chart which indicates indecisiveness prevailing at
current levels. Thus, if the index sustains above
Friday’s high of 10031 then it is likely to rally towards
10111 - 10200. On the downside 9787 - 9692
levels are likely to act as support in coming trading
session.
Actionable points:
View
Bullish above 10031
Expected Targets
10111 - 10200
Support Levels
9787 - 9692
Source: Falcon
2
Daily Technical Report
June 11, 2012
Daily Pivot Levels for Nifty 50 Stocks
SCRIPS
S2
S1
PIVOT
R1
R2
SENSEX
16,374
16,547
16,657
16,829
16,940
NIFTY
5,023
5,052
5,068
5,097
5,114
BANKNIFTY
9,725
9,862
9,947
10,083
10,168
ACC
1,123
1,135
1,144
1,157
1,166
AMBUJACEM
147
149
151
153
156
ASIANPAINT
3,729
3,777
3,813
3,861
3,897
AXISBANK
1,006
1,028
1,043
1,064
1,079
BAJAJ-AUTO
1,502
1,515
1,527
1,540
1,552
BANKBARODA
701
712
720
732
740
BHARTIARTL
292
298
303
309
314
BHEL
213
217
220
224
226
BPCL
685
694
701
710
717
CAIRN
317
320
324
327
331
CIPLA
298
304
307
312
316
COALINDIA
319
323
326
331
334
DLF
189
193
195
199
201
DRREDDY
1,584
1,603
1,616
1,634
1,648
GAIL
316
324
329
337
342
GRASIM
2,234
2,271
2,298
2,335
2,362
HCLTECH
486
491
496
500
505
HDFC
646
651
655
660
663
HDFCBANK
526
532
538
544
549
HEROMOTOCO
1,946
1,976
1,997
2,027
2,048
HINDALCO
117
119
120
122
123
HINDUNILVR
419
424
428
433
437
ICICIBANK
803
816
826
839
849
IDFC
125
129
131
135
137
INFY
2,338
2,378
2,434
2,475
2,530
ITC
232
236
238
242
245
JINDALSTEL
414
427
443
456
472
JPASSOCIAT
66
67
68
69
70
KOTAKBANK
550
562
570
582
590
LT
1,240
1,275
1,297
1,332
1,355
M&M
669
679
687
696
704
MARUTI
1,098
1,111
1,124
1,137
1,150
NTPC
150
153
155
158
160
ONGC
252
255
258
262
265
PNB
741
761
775
795
808
POWERGRID
104
106
107
108
110
RANBAXY
476
483
489
496
502
RELIANCE
705
717
725
737
744
RELINFRA
462
483
495
516
529
SAIL
92
94
95
96
97
SBIN
2,107
2,143
2,168
2,204
2,228
SESAGOA
179
184
187
191
194
SIEMENS
651
662
672
683
693
STER
94
97
99
103
105
SUNPHARMA
564
574
581
590
597
TATAMOTORS
230
235
237
242
244
TATAPOWER
90
92
94
96
97
TATASTEEL
400
405
411
416
421
TCS
1,214
1,223
1,233
1,241
1,251
WIPRO
394
399
402
407
410
3
Daily Technical Report
June 11, 2012
Research Team Tel: 022 - 39357800
DISCLAIMER
This document is solely for the personal information of the recipient, and must not be singularly used as the basis of any investment
decision. Nothing in this document should be construed as investment or financial advice. Each recipient of this document should make
such investigations as they deem necessary to arrive at an independent evaluation of an investment in the securities of the companies
referred to in this document (including the merits and risks involved), and should consult their own advisors to determine the merits and
risks of such an investment.
Angel Broking Limited, its affiliates, directors, its proprietary trading and investment businesses may, from time to time, make
investment decisions that are inconsistent with or contradictory to the recommendations expressed herein. The views contained in this
document are those of the analyst, and the company may or may not subscribe to all the views expressed within.
Reports based on technical and derivative analysis center on studying charts of a stock's price movement, outstanding positions and
trading volume, as opposed to focusing on a company's fundamentals and, as such, may not match with a report on a company's
fundamentals.
The information in this document has been printed on the basis of publicly available information, internal data and other reliable
sources believed to be true, but we do not represent that it is accurate or complete and it should not be relied on as such, as this
document is for general guidance only. Angel Broking Limited or any of its affiliates/ group companies shall not be in any way
responsible for any loss or damage that may arise to any person from any inadvertent error in the information contained in this report.
Angel Broking Limited has not independently verified all the information contained within this document. Accordingly, we cannot testify,
nor make any representation or warranty, express or implied, to the accuracy, contents or data contained within this document. While
Angel Broking Limited endeavours to update on a reasonable basis the information discussed in this material, there may be regulatory,
compliance, or other reasons that prevent us from doing so.
This document is being supplied to you solely for your information, and its contents, information or data may not be reproduced,
redistributed or passed on, directly or indirectly.
Angel Broking Limited and its affiliates may seek to provide or have engaged in providing corporate finance, investment banking or
other advisory services in a merger or specific transaction to the companies referred to in this report, as on the date of this report or in
the past.
Neither Angel Broking Limited, nor its directors, employees or affiliates shall be liable for any loss or damage that may arise from or in
connection with the use of this information.
Note: Please refer to the important `Stock Holding Disclosure' report on the Angel website (Research Section). Also, please refer to the
latest update on respective stocks for the disclosure status in respect of those stocks. Angel Broking Limited and its affiliates may have
investment positions in the stocks recommended in this report.
Research Team
Shardul Kulkarni
-
Head - Technicals
Sameet Chavan
-
Technical Analyst
Sacchitanand Uttekar
-
Technical Analyst
Mehul Kothari
-
Technical Analyst
Ankur Lakhotia
-
Technical Analyst
Angel Broking Pvt. Ltd.
Registered Office: G-1, Ackruti Trade Centre, Rd. No. 7, MIDC, Andheri (E), Mumbai - 400 093.
Corporate Office: 6th Floor, Ackruti Star, MIDC, Andheri (E), Mumbai - 400 093. Tel: (022) 3952 6600
Sebi Registration No: INB 010996539
4