Technical Research | April 11, 2012
Daily Technical Report
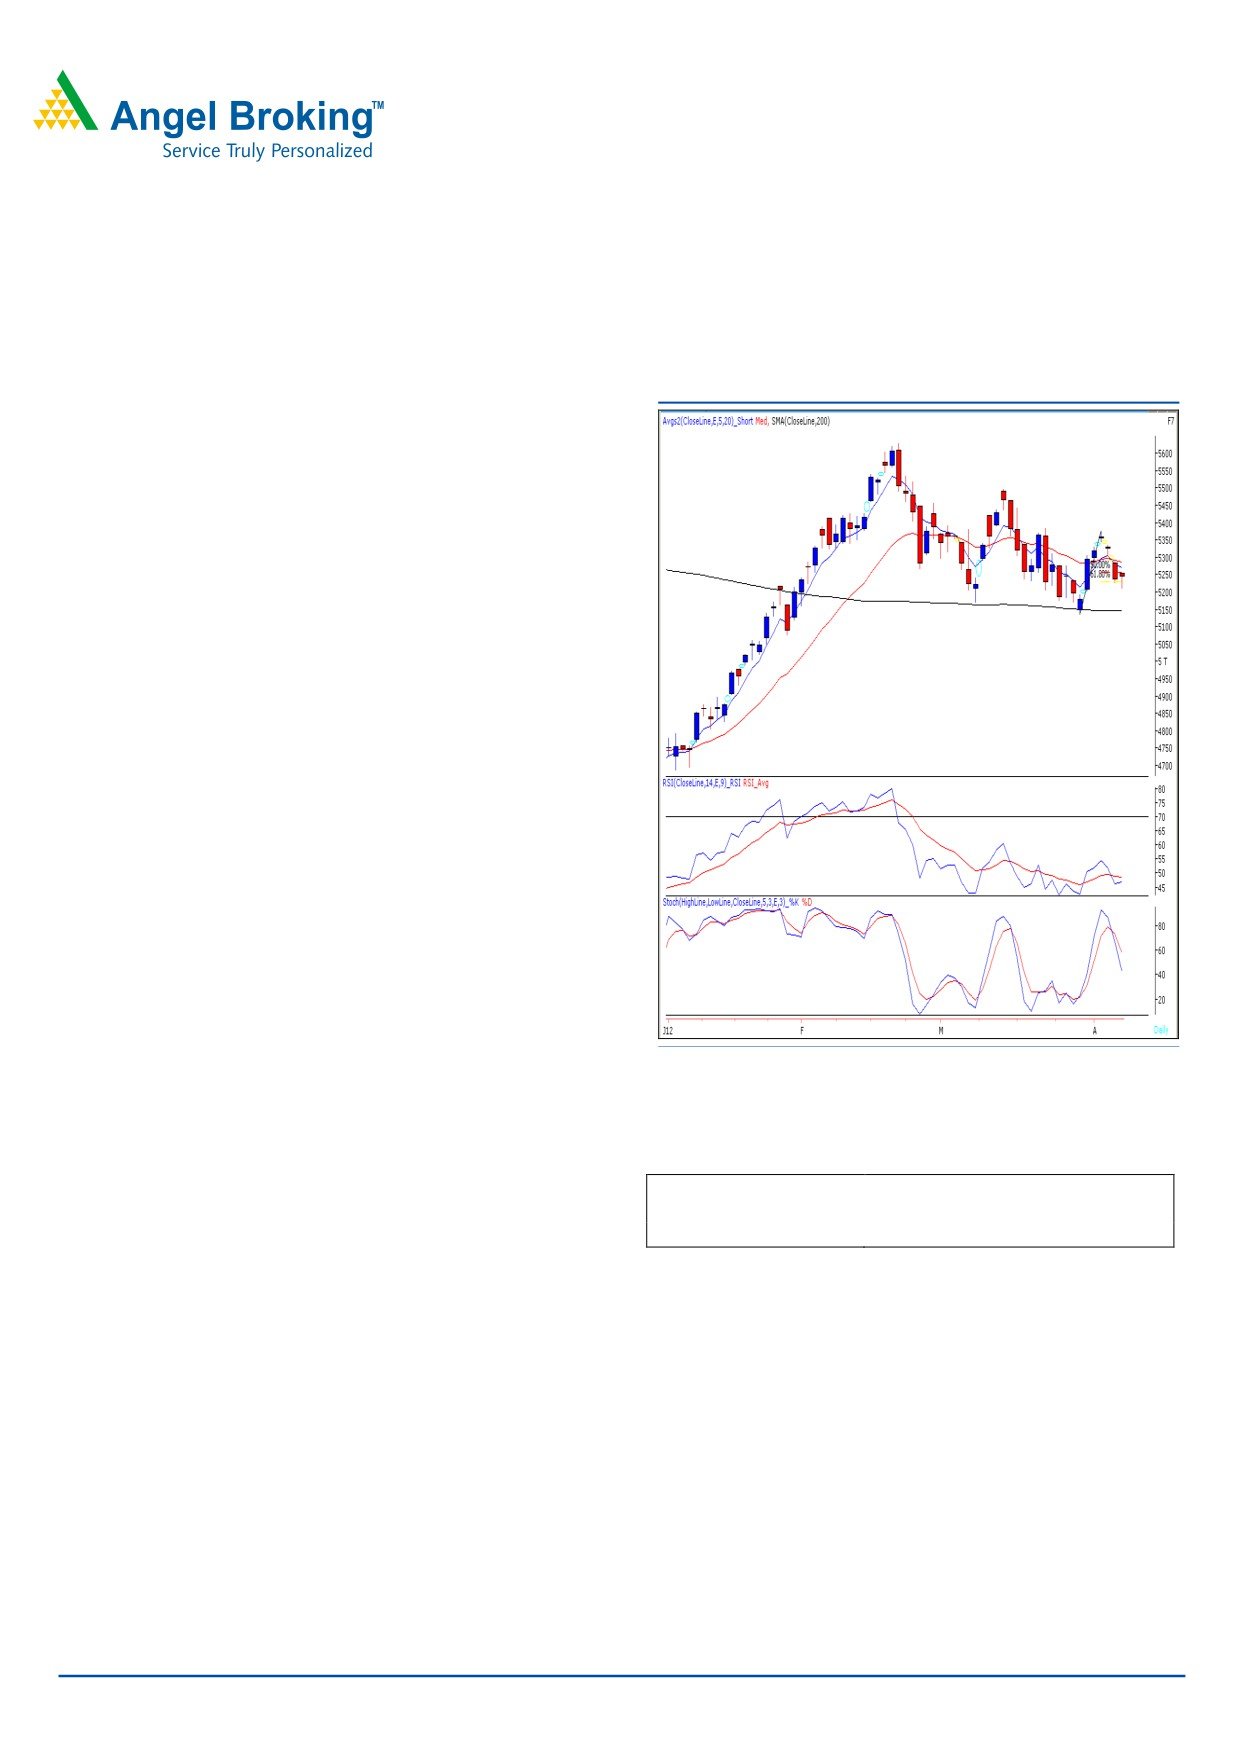
Sensex (17244) / NIFTY (5244)
Exhibit 1: Nifty Daily Chart
Yesterday, the 5200 mark yet again acted as strong support
from where buying emerged in the latter half of the session.
In the end, our Benchmark indices closed near the initial
opening level. On sectoral front, FMCG, AUTO and
Banking counters where among the major gainers, whereas
METAL, IT, and Consumer Goods stocks ended on the
losing side. The advance to decline ratio was marginally in
favor of declining counters (A=1337 D=1432) (Source -
Formation:
• The 200-day SMA (Simple Moving Average) and 20-
day EMA (Exponential Moving Average) have now shifted to
17100 / 5150 and 17333 / 5275, respectively.
• The ‘20-Week EMA’ is placed at 17200 / 5200 level.
• The candlestick pattern on the daily chart resembles a
“Homing Pigeon”.
• Indices have taken support near
61.8% Fibonacci
Retracement level (17204 / 5228) of the rise from 16920 to
Source: Falcon
17664 / 5135 to 5379 levels.
Trading strategy:
Actionable points:
View
Neutral
Yesterday, indices opened on a flat note and traded in a
Resistance Levels
5256 - 5288 - 5339
narrow range throughout the day to close below 5250
Support Levels
5200 - 5135
mark. Now on the Daily chart, we are observing a
candlestick pattern which resembles a “Homing Pigeon”
Conversely, the high of “Homing Pigeon” 17275 / 5256
which needs confirmation in the form of closing above the
would act as a resistance in today’s trading session. A
high. However, there are no significant changes in rest of
sustainable move beyond this level may result further upside
the technical evidences mentioned in our previous report.
and indices are likely to test 17407 - 14554 / 5288 - 5339
Also, the global cues suggest that our markets may open in
levels.
red. Therefore, we are of the opinion that if indices sustain
below yesterday’s low of 17135 / 5211 then they are likely
to slide towards the next support levels of 17100 - 16920 /
5200 - 5135 levels.
For Private Circulation Only |
1
Technical Research | April 11, 2012
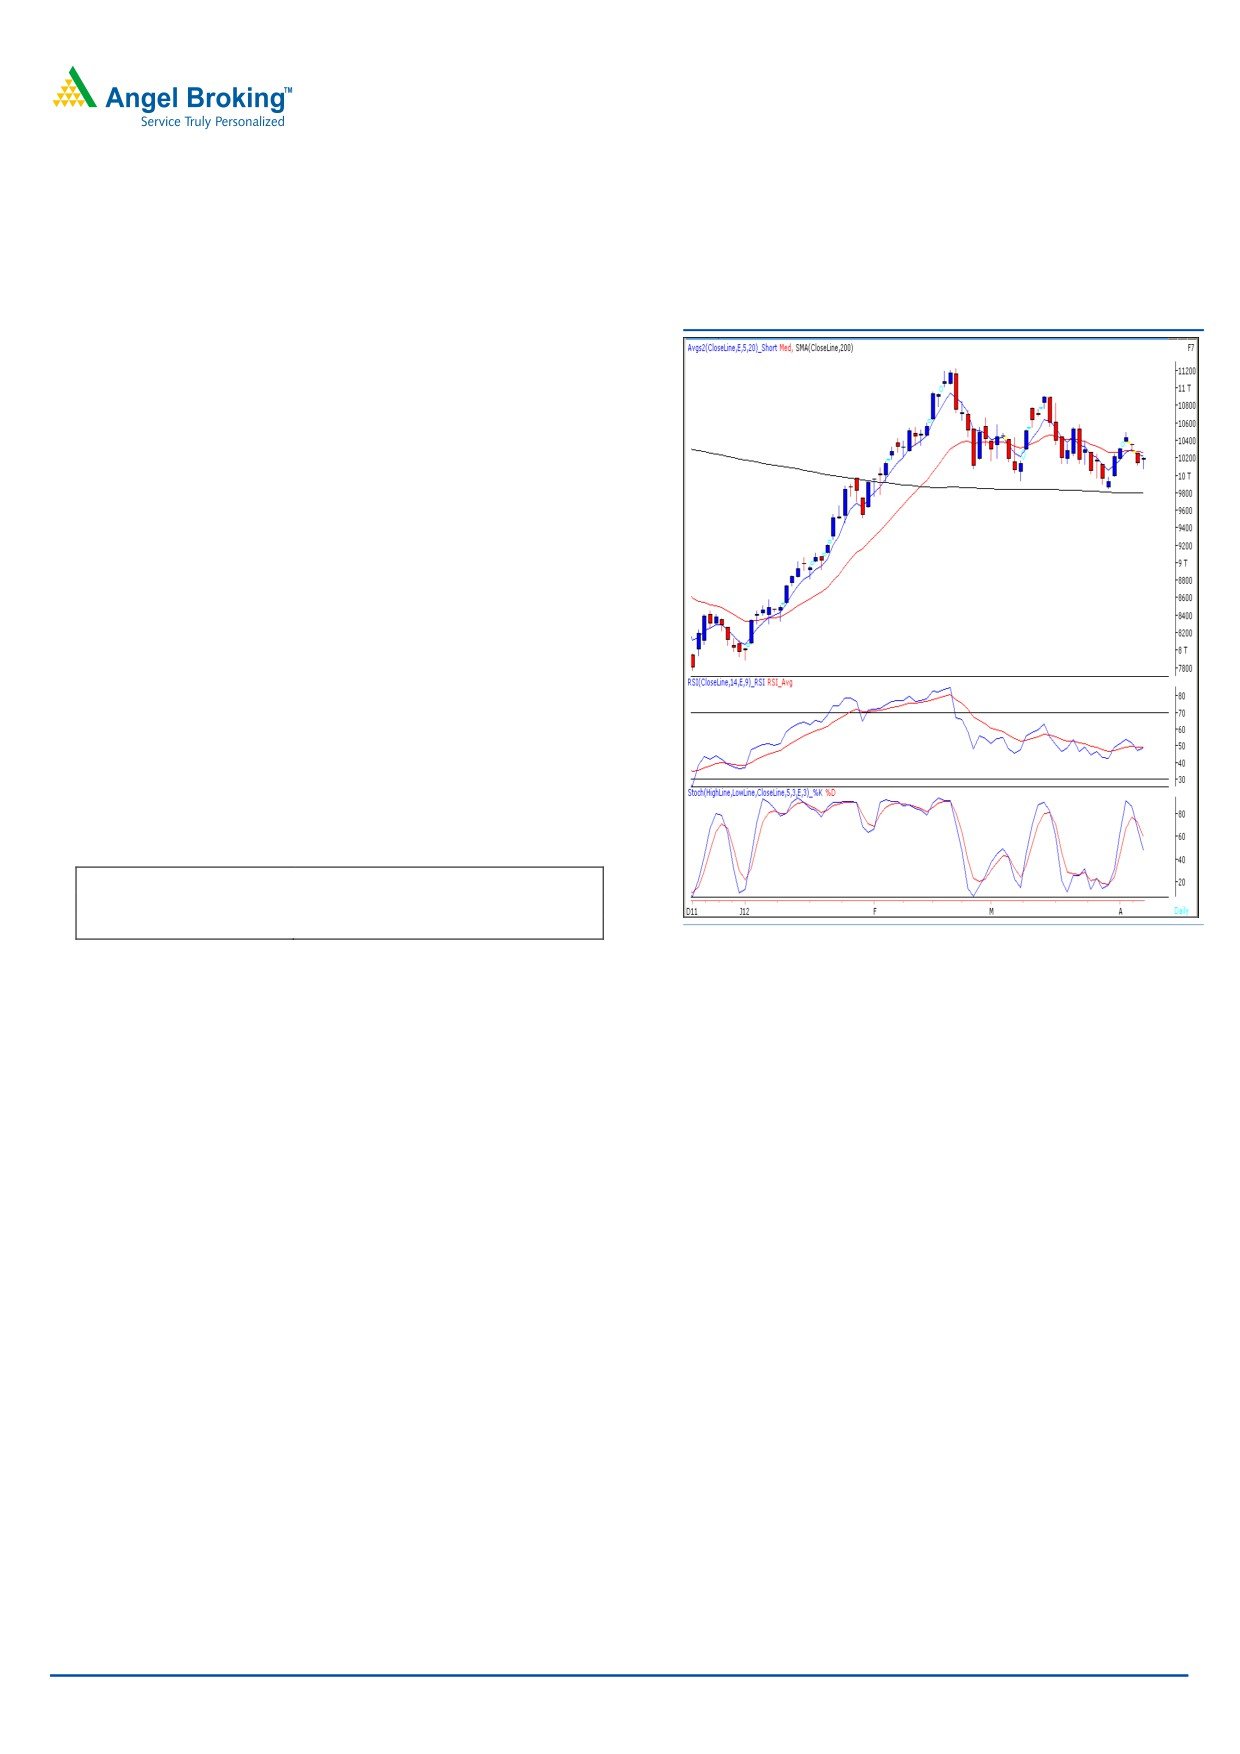
Bank Nifty Outlook - (10196)
Exhibit 2: Bank Nifty Daily Chart
Yesterday, Bank Nifty opened on a flat note, tested our
mentioned support level of
10100 to bounce back
sharply during the last hour of trade. We are witnessing a
“Bullish Harami” candlestick pattern near
61.8%
Fibonacci retracement of the rise from March 29, 2012 -
April 03, 2012. The said pattern requires confirmation in
the form of closing above 10210. We are also witnessing
positive crossover in “RSI - Smoothened” oscillator on the
hourly chart and the possibility of an up - move cannot be
ruled out. Thus if the index sustains above yesterday’s
high of 10210 then it is likely to rally towards the
resistance zone of 10320 - 10355. In this rally, we expect
SBI, ICICI, IndusInd bank and Uco Bank to give
substantial returns. On the downside, 10075 - 9986 are
likely to act as support in coming trading session.
Actionable points:
View
Neutral
Resistance Levels
10320 - 10355
Support Levels
10075 - 9986
Source: Falcon
For Private Circulation Only |
2
Technical Research | April 11, 2012
Positive Bias:
Positive
Expected
Stock Name
CMP
5 Day EMA
20 Day EMA
Remarks
Above
Target
Escorts
76.35
75
73.2
76.7
82
View will change below 72
View will change below
Vip Inds
104.2
104.4
103.5
105.2
110
101
For Private Circulation Only |
3
Technical Research | April 11, 2012
Daily Pivot Levels for Nifty 50 Stocks
SCRIPS
S2
S1
PIVOT
R1
R2
SENSEX
17,079
17,162
17,218
17,300
17,357
NIFTY
5,193
5,218
5,237
5,262
5,281
BANKNIFTY
10,028
10,112
10,161
10,245
10,294
ACC
1,278
1,289
1,306
1,317
1,333
AMBUJACEM
161
164
168
171
175
AXISBANK
1,131
1,142
1,151
1,162
1,171
BAJAJ-AUTO
1,619
1,633
1,649
1,664
1,680
BHARTIARTL
326
328
330
332
335
BHEL
249
252
258
262
268
BPCL
628
648
665
685
703
CAIRN
334
341
347
354
359
CIPLA
305
308
311
314
317
COALINDIA
327
330
334
337
341
DLF
199
201
205
207
210
DRREDDY
1,668
1,691
1,723
1,747
1,779
GAIL
311
333
347
369
382
HCLTECH
479
485
493
500
508
HDFC
662
667
671
676
679
HDFCBANK
512
518
522
529
532
HEROMOTOCO
1,926
1,952
1,970
1,996
2,014
HINDALCO
121
123
125
128
130
HINDUNILVR
400
407
412
420
425
ICICIBANK
845
854
864
874
884
IDFC
129
131
133
135
137
INFY
2,675
2,723
2,785
2,834
2,896
ITC
221
225
228
232
234
JINDALSTEL
488
494
503
510
519
JPASSOCIAT
77
79
82
84
86
KOTAKBANK
527
537
543
553
559
LT
1,255
1,270
1,291
1,306
1,327
M&M
677
686
691
699
704
MARUTI
1,243
1,259
1,277
1,294
1,312
NTPC
160
161
162
164
165
ONGC
258
261
266
269
274
PNB
891
899
908
916
926
POWERGRID
108
109
110
111
112
RANBAXY
473
479
488
493
503
RCOM
81
83
85
87
89
RELIANCE
734
738
743
747
751
RELINFRA
550
562
575
586
599
RPOWER
113
116
119
122
124
SAIL
91
92
93
95
96
SBIN
2,072
2,112
2,134
2,174
2,196
SESAGOA
179
181
184
186
189
SIEMENS
756
769
777
790
799
STER
102
103
105
106
108
SUNPHARMA
553
560
565
572
577
SUZLON
24
24
24
25
25
TATAMOTORS
272
278
281
287
291
TATAPOWER
98
101
103
106
108
TATASTEEL
444
448
454
459
465
TCS
1,138
1,147
1,161
1,170
1,185
WIPRO
435
440
445
450
455
Technical Research Team
For Private Circulation Only |
4
Technical Report
RESEARCH TEAM
Shardul Kulkarni
Head - Technicals
Sameet Chavan
Technical Analyst
Sacchitanand Uttekar
Technical Analyst
Mehul Kothari
Technical Analyst
Ankur Lakhotia
Technical Analyst
Research Team: 022-3952 6600
DISCLAIMER: This document is not for public distribution and has been furnished to you solely for your information and must not
be reproduced or redistributed to any other person. Persons into whose possession this document may come are required to observe
these restrictions.
Opinion expressed is our current opinion as of the date appearing on this material only. While we endeavor to update on a
reasonable basis the information discussed in this material, there may be regulatory, compliance, or other reasons that prevent us
from doing so. Prospective investors and others are cautioned that any forward-looking statements are not predictions and may be
subject to change without notice. Our proprietary trading and investment businesses may make investment decisions that are
inconsistent with the recommendations expressed herein.
The information in this document has been printed on the basis of publicly available information, internal data and other reliable
sources believed to be true and are for general guidance only. While every effort is made to ensure the accuracy and completeness of
information contained, the company takes no guarantee and assumes no liability for any errors or omissions of the information. No
one can use the information as the basis for any claim, demand or cause of action.
Recipients of this material should rely on their own investigations and take their own professional advice. Each recipient of this
document should make such investigations as it deems necessary to arrive at an independent evaluation of an investment in the
securities of companies referred to in this document (including the merits and risks involved), and should consult their own advisors to
determine the merits and risks of such an investment. Price and value of the investments referred to in this material may go up or
down. Past performance is not a guide for future performance. Certain transactions - futures, options and other derivatives as well as
non-investment grade securities - involve substantial risks and are not suitable for all investors. Reports based on technical analysis
centers on studying charts of a stock's price movement and trading volume, as opposed to focusing on a company's fundamentals
and as such, may not match with a report on a company's fundamentals.
We do not undertake to advise you as to any change of our views expressed in this document. While we would endeavor to update
the information herein on a reasonable basis, Angel Broking, its subsidiaries and associated companies, their directors and
employees are under no obligation to update or keep the information current. Also there may be regulatory, compliance, or other
reasons that may prevent Angel Broking and affiliates from doing so. Prospective investors and others are cautioned that any
forward-looking statements are not predictions and may be subject to change without notice.
Angel Broking Limited and affiliates, including the analyst who has issued this report, may, on the date of this report, and from time
to time, have long or short positions in, and buy or sell the securities of the companies mentioned herein or engage in any other
transaction involving such securities and earn brokerage or compensation or act as advisor or have other potential conflict of interest
with respect to company/ies mentioned herein or inconsistent with any recommendation and related information and opinions.
Angel Broking Limited and affiliates may seek to provide or have engaged in providing corporate finance, investment banking or
other advisory services in a merger or specific transaction to the companies referred to in this report, as on the date of this report or
in the past.
Sebi Registration No: INB 010996539
For Private Circulation Only |