Technical Research | January 11, 2012
Daily Technical Report
Sensex (16165) / NIFTY (4850)
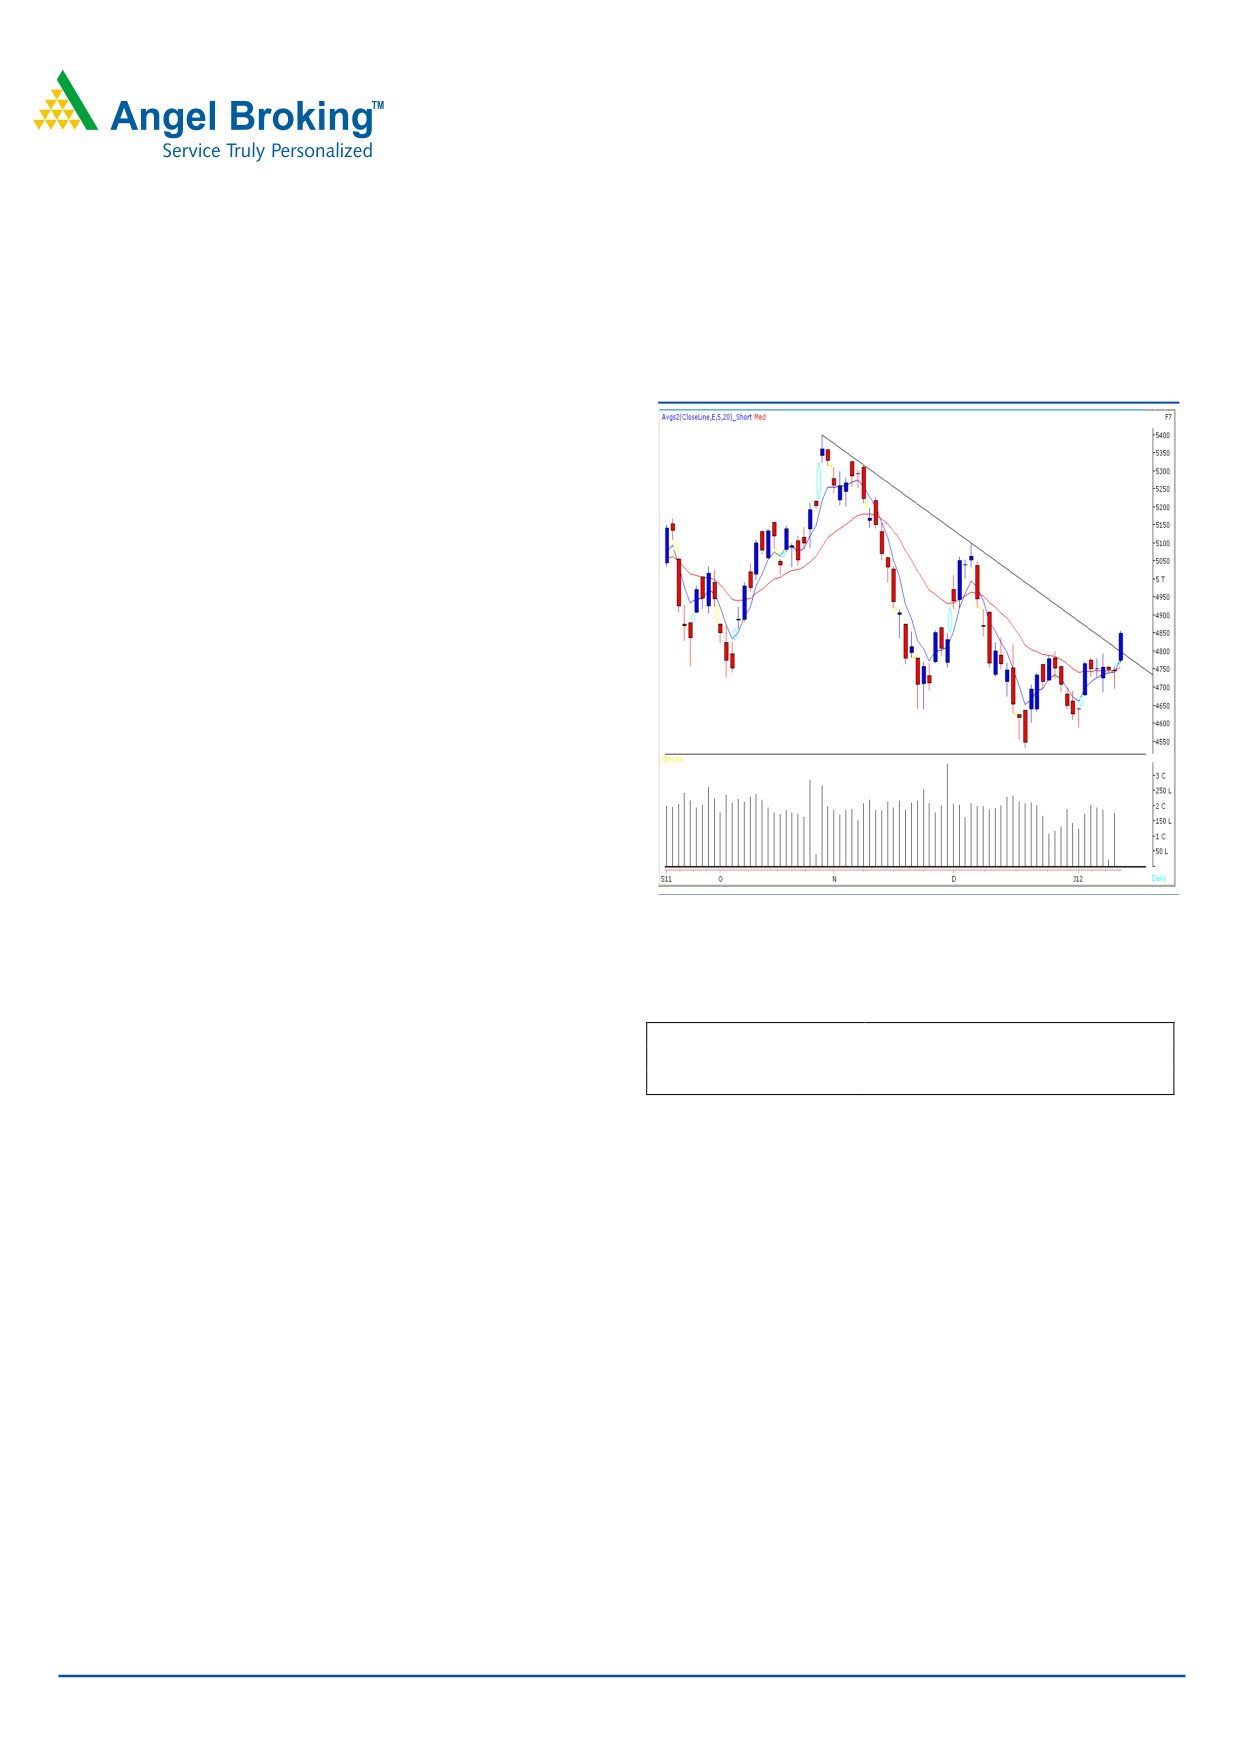
Exhibit 1: Nifty Daily Chart
Yesterday, markets opened on an optimistic note and
traded with positive bias throughout the day. Strong positive
momentum towards the end of the session pushed indices
to close almost at the highest point of the day. On the
sectoral front, Realty, Capital Goods and Banking sectors
contributed heavily in yesterday’s rally. There was no sector
in the negative territory. The advance to decline ratio was
strongly in favor of gaining counters. (A=2136 D=673).
Formation:
• We are witnessing a positive crossover in weekly
momentum oscillators’ viz., the RSI and the Stochastic.
• On the Daily chart, we are now witnessing a breakout
from the “Downward Sloping Trend Line” resistance around
Source: Falcon
16070 / 4820 level.
Actionable points:
Trading strategy:
View
Positive Above 4855
Indices opened higher in-line with global cues and finally
Expected Targets
4881 - 4920
after several attempts, managed to cross mentioned
Support level
4820 - 4780
resistance level of 16070 / 4820. The impact of positive
crossover in weekly momentum oscillator was seen as
indices closed well above the “Downward Sloping Trend
Line” resistance (which was also 16070 / 4820). Thus
going forward, indices are likely to head towards the next
resistance levels of 16286 - 16421/ 4881 - 4920. A move
beyond 16421 / 4920 level may push indices even higher
to test 16600 - 17004 / 4976 - 5100. On the downside,
16070 - 15950 / 4820 - 4780 levels may provide decent
support in coming trading sessions.
For Private Circulation Only |
1
Technical Research | January 11, 2012
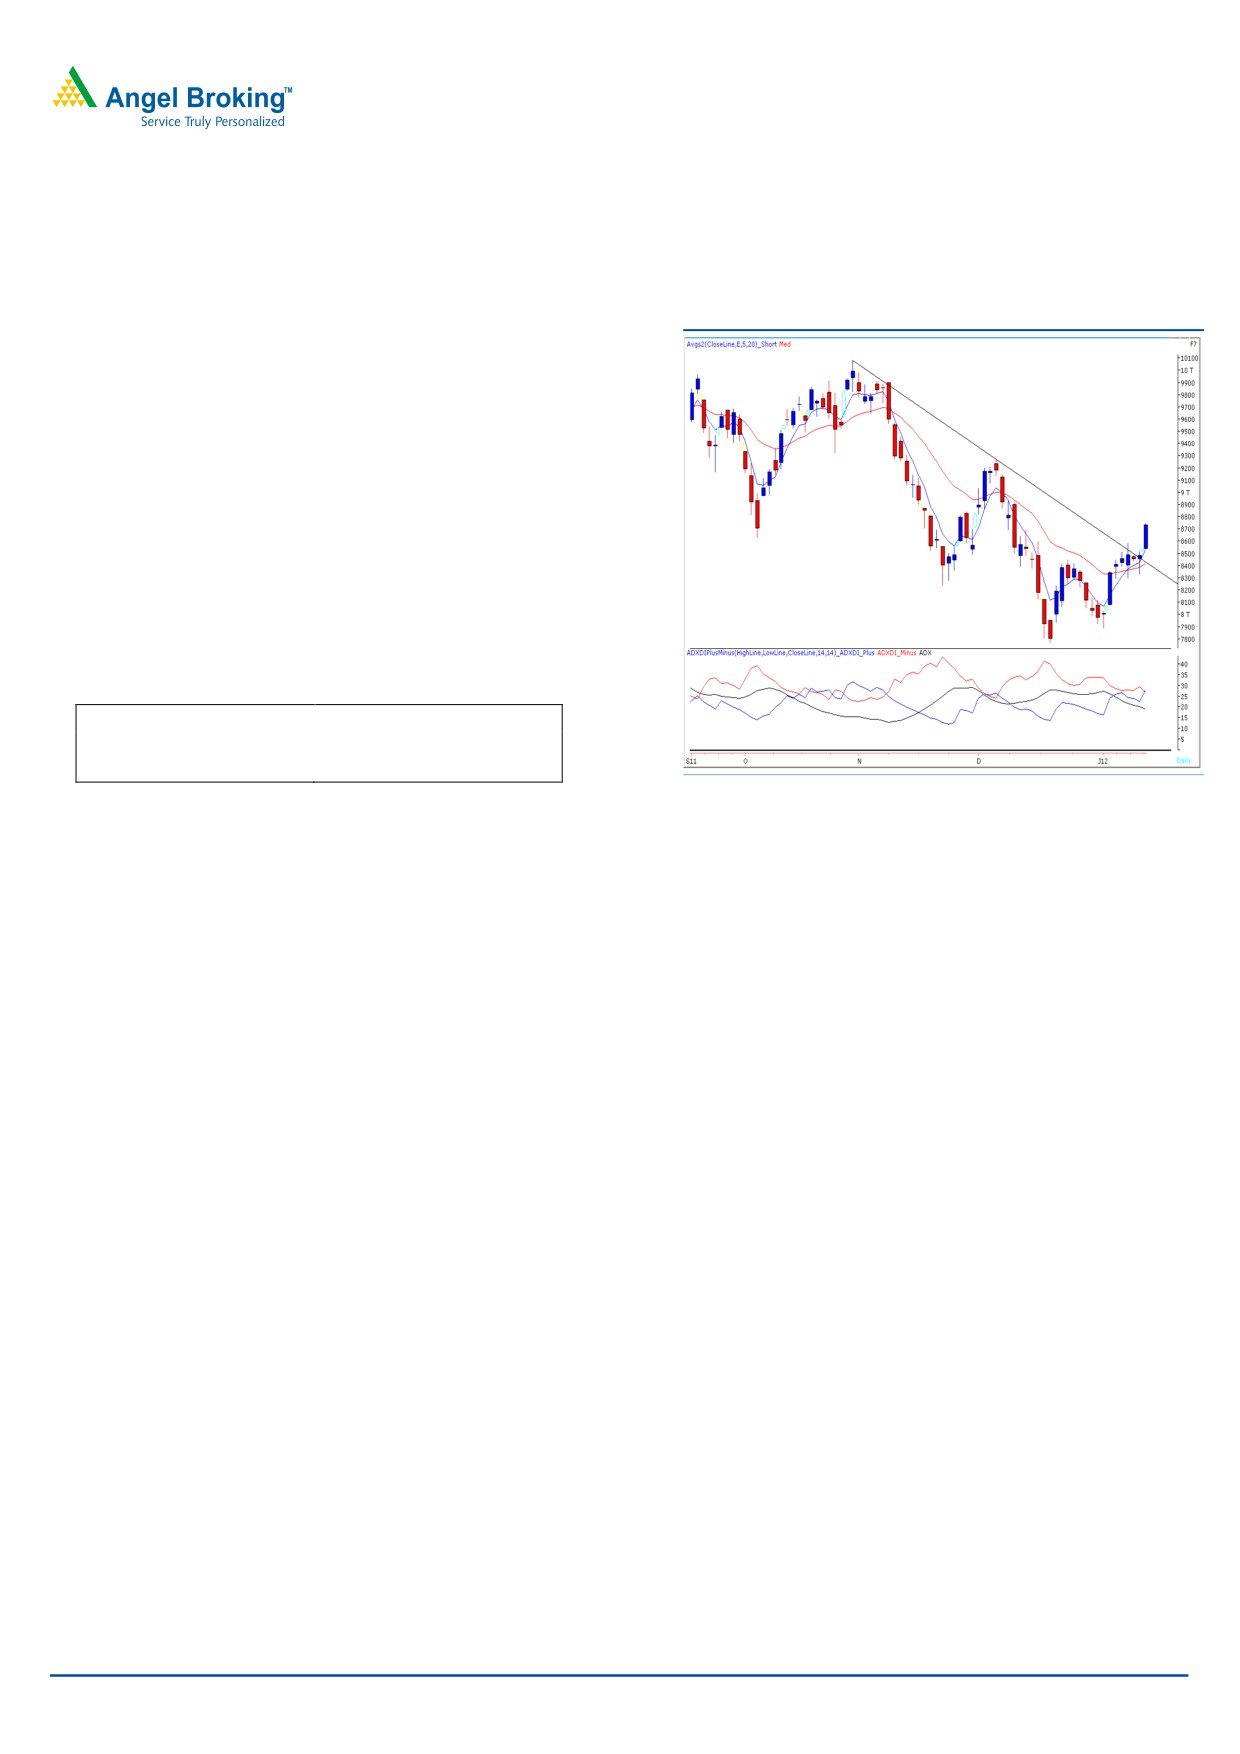
Bank Nifty Outlook - (8735)
Exhibit 2: Bank Nifty Daily Chart
Yesterday, Bank Nifty opened with a minor gap and gained
strength as the day progressed to close near day’s high. We
are now witnessing a trend line breakout joining the highs
10080 - 9273 formed on 31st October 2011 and 7th
December 2011. We are also witnessing a positive crossover
in “ADX (14)” indicator. Thus, if Bank Nifty manages to
sustain above yesterday’s high of 8749 then it is likely to test
8923 - 8950 levels. On the downside, 8650 - 8535 levels
may act a as support in coming trading session.
Actionable points:
View
Positive Above 8749
Expected Target
8923 - 8950
Support Levels
8650 - 8535
Source: Falcon
For Private Circulation Only |
2
Technical Research | January 11, 2012
Positive Bias:
Expected
Stock Name
CMP
5 Day EMA
20 Day EMA
Remarks
Target
HDIL
62.6
59
58.4
67
View will change below 59
Hdfc Ltd.
684
671.6
661
700
View will change below 672
Hindalco
123.2
119.5
120
131
View will change below 118
For Private Circulation Only |
3
Technical Research | January 11, 2012
Daily Pivot Levels for Nifty 50 Stocks
SCRIPS
S2
S1
PIVOT
R1
R2
SENSEX
15,799
15,982
16,081
16,265
16,364
NIFTY
4,737
4,793
4,825
4,881
4,912
BANKNIFTY
8,460
8,598
8,673
8,811
8,886
ACC
1,089
1,102
1,114
1,127
1,139
AMBUJACEM
149
151
152
154
155
AXISBANK
855
875
886
906
917
BAJAJ-AUTO
1,401
1,415
1,440
1,454
1,478
BHARTIARTL
316
323
328
335
341
BHEL
254
259
263
269
273
BPCL
464
473
480
489
496
CAIRN
331
334
338
341
345
CIPLA
340
343
346
349
352
DLF
174
179
183
188
192
DRREDDY
1,592
1,605
1,616
1,629
1,639
GAIL
377
379
382
383
386
HCLTECH
415
418
419
421
423
HDFC
658
671
679
692
700
HDFCBANK
453
456
459
463
466
HEROMOTOCO
1,713
1,744
1,762
1,793
1,811
HINDALCO
117
120
122
125
127
HINDUNILVR
388
392
395
399
403
ICICIBANK
739
757
768
786
797
IDFC
99
101
102
103
104
INFY
2,838
2,851
2,863
2,876
2,888
ITC
201
203
204
207
208
JINDALSTEL
470
485
495
510
520
JPASSOCIAT
53
54
55
56
56
KOTAKBANK
449
458
464
472
478
LT
1,078
1,106
1,123
1,151
1,168
M&M
642
666
680
704
718
MARUTI
970
978
986
994
1,001
NTPC
155
156
158
160
162
ONGC
256
259
261
263
266
PNB
813
836
852
876
892
POWERGRID
100
101
102
104
105
RANBAXY
433
437
442
446
451
RCOM
77
79
80
82
84
RELCAPITAL
254
268
276
290
298
RELIANCE
702
719
729
746
756
RELINFRA
371
385
395
409
418
RPOWER
73
76
79
82
84
SAIL
85
87
88
89
90
SBIN
1,627
1,665
1,687
1,725
1,747
SESAGOA
161
164
167
170
173
SIEMENS
670
688
700
718
730
STER
93
95
95
97
98
SUNPHARMA
501
509
514
522
527
SUZLON
19
19
19
20
20
TATAMOTORS
199
202
204
207
210
TATAPOWER
90
92
93
95
97
TATASTEEL
357
364
369
376
381
TCS
1,143
1,154
1,170
1,181
1,197
WIPRO
399
401
404
407
410
Technical Research Team
For Private Circulation Only |
4
Technical Report
RESEARCH TEAM
Shardul Kulkarni
Head - Technicals
Sameet Chavan
Technical Analyst
Sacchitanand Uttekar
Technical Analyst
Mehul Kothari
Technical Analyst
Ankur Lakhotia
Technical Analyst
Research Team: 022-3952 6600
DISCLAIMER: This document is not for public distribution and has been furnished to you solely for your information and must not
be reproduced or redistributed to any other person. Persons into whose possession this document may come are required to observe
these restrictions.
Opinion expressed is our current opinion as of the date appearing on this material only. While we endeavor to update on a
reasonable basis the information discussed in this material, there may be regulatory, compliance, or other reasons that prevent us
from doing so. Prospective investors and others are cautioned that any forward-looking statements are not predictions and may be
subject to change without notice. Our proprietary trading and investment businesses may make investment decisions that are
inconsistent with the recommendations expressed herein.
The information in this document has been printed on the basis of publicly available information, internal data and other reliable
sources believed to be true and are for general guidance only. While every effort is made to ensure the accuracy and completeness of
information contained, the company takes no guarantee and assumes no liability for any errors or omissions of the information. No
one can use the information as the basis for any claim, demand or cause of action.
Recipients of this material should rely on their own investigations and take their own professional advice. Each recipient of this
document should make such investigations as it deems necessary to arrive at an independent evaluation of an investment in the
securities of companies referred to in this document (including the merits and risks involved), and should consult their own advisors to
determine the merits and risks of such an investment. Price and value of the investments referred to in this material may go up or
down. Past performance is not a guide for future performance. Certain transactions - futures, options and other derivatives as well as
non-investment grade securities - involve substantial risks and are not suitable for all investors. Reports based on technical analysis
centers on studying charts of a stock's price movement and trading volume, as opposed to focusing on a company's fundamentals
and as such, may not match with a report on a company's fundamentals.
We do not undertake to advise you as to any change of our views expressed in this document. While we would endeavor to update
the information herein on a reasonable basis, Angel Broking, its subsidiaries and associated companies, their directors and
employees are under no obligation to update or keep the information current. Also there may be regulatory, compliance, or other
reasons that may prevent Angel Broking and affiliates from doing so. Prospective investors and others are cautioned that any
forward-looking statements are not predictions and may be subject to change without notice.
Angel Broking Limited and affiliates, including the analyst who has issued this report, may, on the date of this report, and from time
to time, have long or short positions in, and buy or sell the securities of the companies mentioned herein or engage in any other
transaction involving such securities and earn brokerage or compensation or act as advisor or have other potential conflict of interest
with respect to company/ies mentioned herein or inconsistent with any recommendation and related information and opinions.
Angel Broking Limited and affiliates may seek to provide or have engaged in providing corporate finance, investment banking or
other advisory services in a merger or specific transaction to the companies referred to in this report, as on the date of this report or
in the past.
Sebi Registration No : INB 010996539
For Private Circulation Only |