Technical Research | October 11, 2011
Daily Technical Report
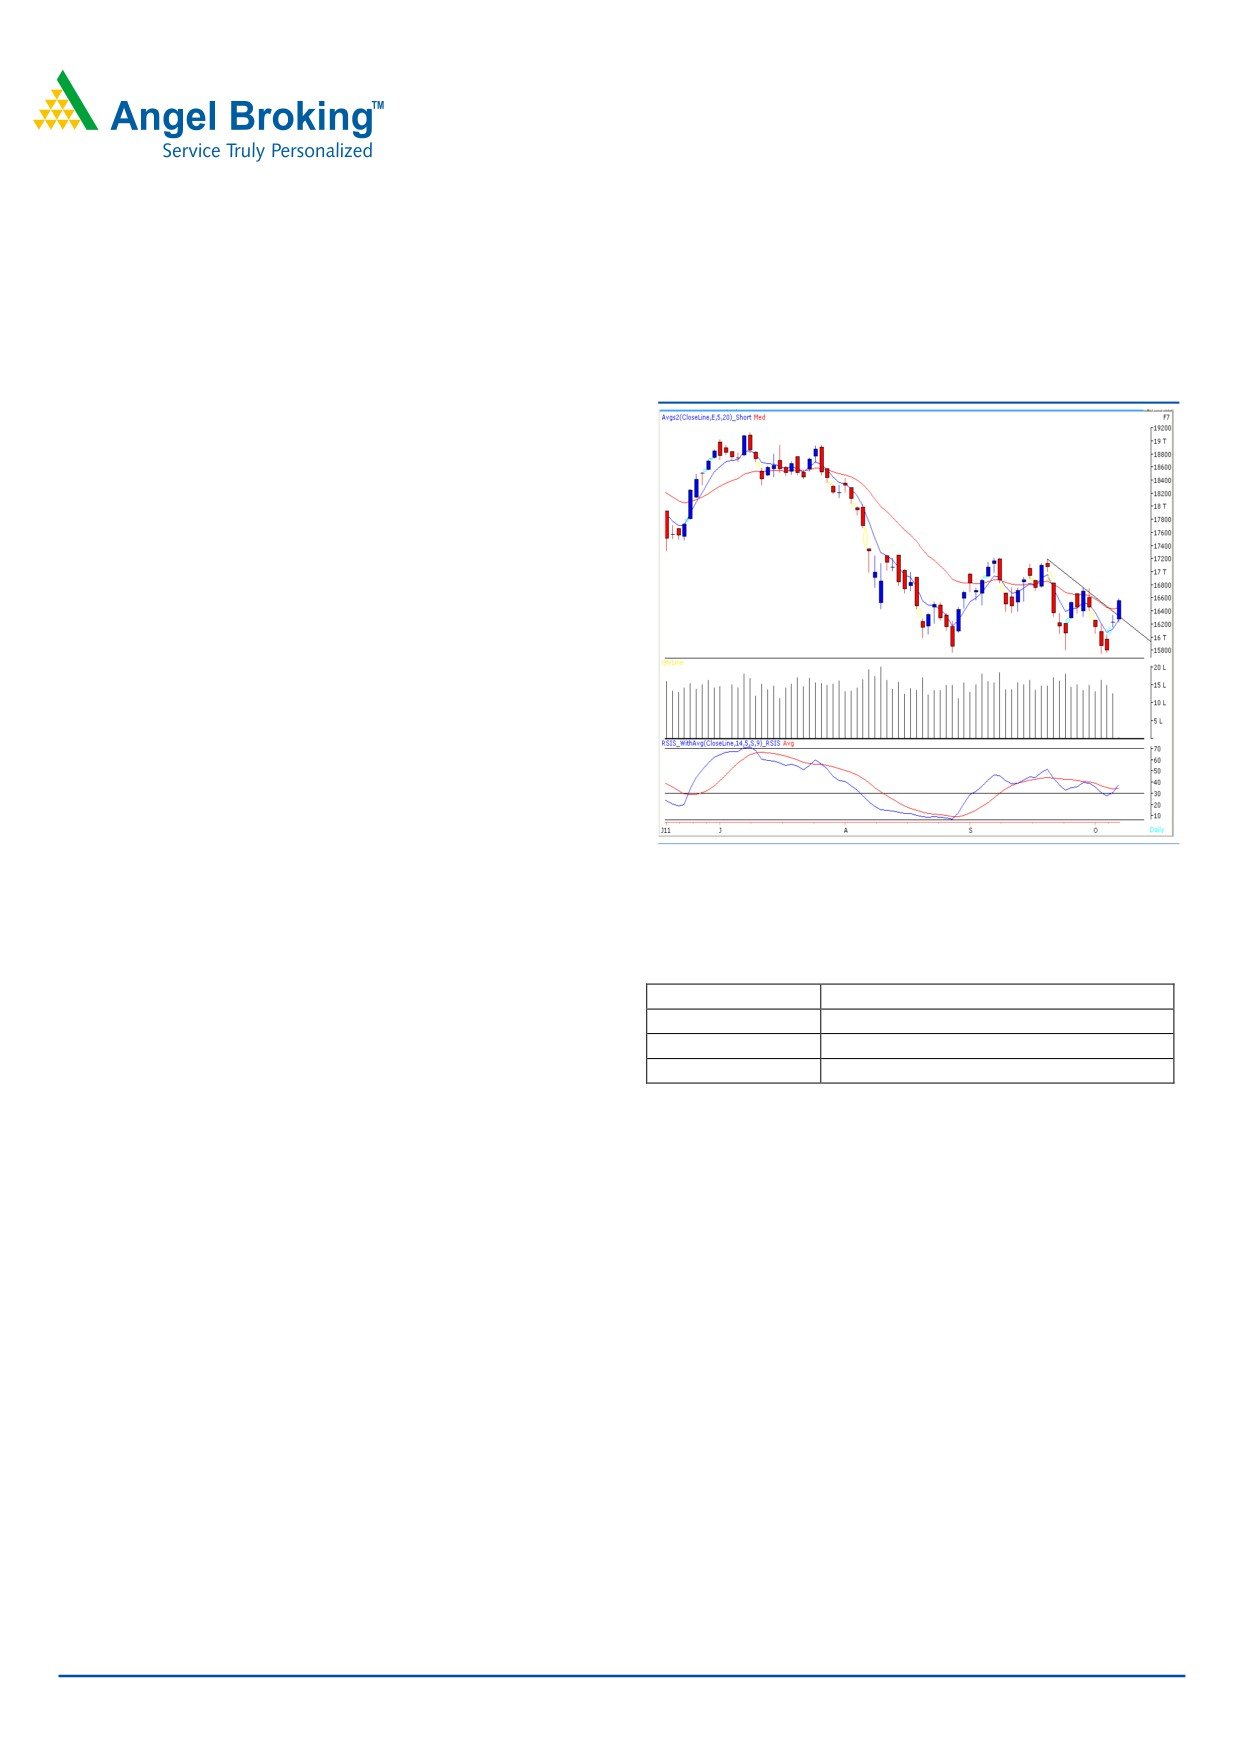
Sensex (16557) / NIFTY (4980)
We witnessed a quite opening and then indices moved in a
Exhibit 1: Sensex Daily Chart
range during the first half of the session. However, during
the second half, we witnessed a strong upside momentum
which lasted till the end of the day. On the sector front,
gains were seen in all the sectors. Realty, Consumer Goods
and IT were the major gainers which contributed
substantially in the rally. The advance decline ratio was
strongly in favor of advancing counters (A=1686 D=1084).
Formation
• The Daily “RSI - Smoothened” momentum oscillator has
given a positive crossover.
• On the Daily chart, we are now observing a breakout
from “Downward sloping trend line” around 16430 / 4940
level.
Source: Falcon
Actionable points:
Trading strategy:
After a quite opening, markets crossed 16430 / 4940 level
View
Bullish
during the second half and strong positive momentum was
Positive Above
16596 / 4991
Expected Target
16800-17000/ 5050 - 5110
seen throughout the rest of the session. This upside serves
Support Levels
16348 -16148 / 4923 - 4860
as a confirmation of “Dragonfly Doji” pattern in weekly
chart. Considering positive sentiment across the globe and
a positive crossover in “RSI - Smoothened” oscillator on the
daily charts of our benchmark Indices, we expect the
markets to test gap area of 16800 - 17000 / 5050 - 5110
created on 22nd September 2011. On the downside,
16348 - 16148 / 4923 - 4860 levels are likely to act as
support in coming trading session.
For Private Circulation Only |
1
Technical Research | October 11, 2011
Bank Nifty Outlook - (9169)
Bank nifty opened on a quite note, tested the initial support
Exhibit 2: Bank Nifty Daily Chart
level of 8975 and bounced back sharply to close near the
day’s high. In our previous report we had mentioned about
positive divergence in RSI momentum oscillator. The effect
of this positive divergence was witnessed in yesterday’s
trading session. We are now observing a horizontal trend
line resistance at 9285 level. This level nearly coincides with
61.8% Fibonacci retracement of the previous fall from 9676
to 8626. Going forward , if the bank nifty manages to
sustain above yesterday’s high of 9191 level then it is likely
to face resistance near 9285-9332 levels.
On the down side, 8975 -8870 levels may act as
support levels for the day.
Source: Falcon
Stock Recommendations:
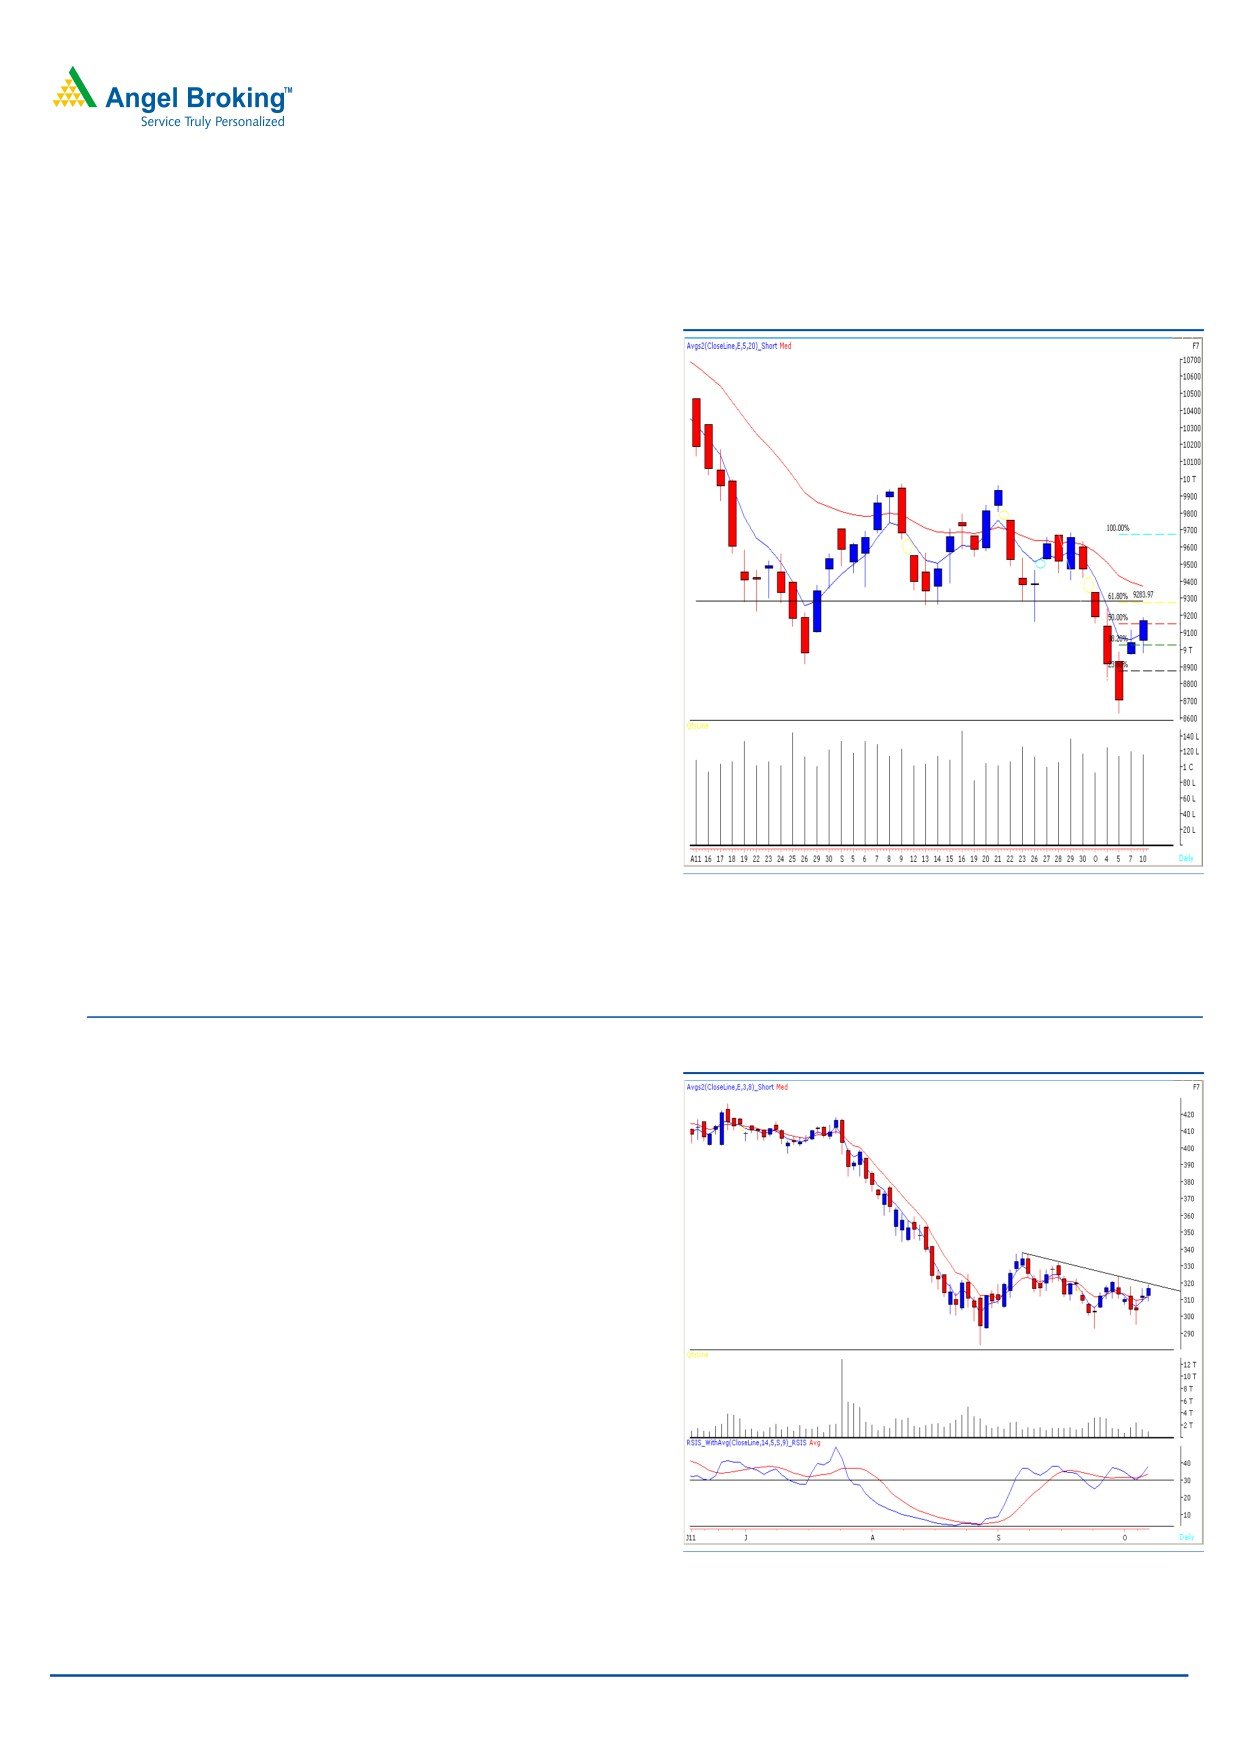
Exhibit 3: Bank of India (Oct.Fut.) Daily chart
Stock - BANK OF INDIA (Oct.Fut.)
Action - Buy
Last close : ` 316.40
Range
: ` 316 - 314.50
Stop Loss : ` 308.30
Target
: ` 336
Justification - The Daily chart depicts a bullish “Inverse
Head and Shoulder” pattern in the making. The momentum
oscillators are positively poised which suggest possibility of
a breakout from the said pattern. In addition, we are
witnessing a positive crossover in “3 & 8 EMA” on the Daily
chart. Therefore, we advise buying the stock in a range of
Rs.316 to Rs.314.50 for a target of Rs.336 in coming 3 - 4
Source: Falcon
days.
For Private Circulation Only |
2
Technical Research | October 11, 2011
Daily Pivot Levels for Nifty 50 Stocks
SCRIPS
S2
S1
PIVOT
R1
R2
SENSEX
16,096
16,327
16,461
16,692
16,826
NIFTY
4,842
4,911
4,951
5,020
5,060
ACC
1,075
1,103
1,121
1,149
1,166
AMBUJACEM
142
143
144
146
146
AXISBANK
1,002
1,025
1,040
1,064
1,078
BAJAJ-AUTO
1,460
1,507
1,540
1,587
1,620
BHARTIARTL
334
349
358
373
383
BHEL
322
327
330
336
339
BPCL
648
660
669
681
689
CAIRN
267
271
275
279
283
CIPLA
276
279
284
287
292
DLF
209
219
224
234
239
DRREDDY
1,478
1,494
1,505
1,522
1,533
GAIL
406
414
418
426
431
HCLTECH
400
407
411
418
422
HDFC
634
648
657
672
681
HDFCBANK
446
451
454
458
462
HEROMOTOCO
1,896
1,929
1,951
1,983
2,005
HINDALCO
123
125
127
130
132
HINDUNILVR
321
326
330
335
339
ICICIBANK
804
823
836
855
867
IDFC
114
118
120
125
127
INFY
2,501
2,545
2,573
2,618
2,646
ITC
196
198
200
202
204
JINDALSTEL
455
465
479
489
503
JPASSOCIAT
71
72
73
74
75
KOTAKBANK
438
446
451
460
465
LT
1,352
1,369
1,385
1,401
1,417
M&M
784
796
803
815
822
MARUTI
1,049
1,060
1,076
1,087
1,103
NTPC
163
167
169
173
175
ONGC
259
267
271
278
282
PNB
899
915
926
943
954
POWERGRID
96
97
98
99
99
RANBAXY
505
510
515
520
526
RCOM
70
72
73
75
76
RELCAPITAL
317
327
332
342
347
RELIANCE
795
812
821
839
848
RELINFRA
378
389
395
405
412
RPOWER
79
81
82
83
84
SAIL
100
102
104
106
107
SBIN
1,705
1,731
1,748
1,773
1,790
SESAGOA
187
202
209
224
232
SIEMENS
810
819
834
844
859
STER
112
115
116
119
121
SUNPHARMA
455
459
466
470
476
SUZLON
35
36
37
38
39
TATAMOTORS
154
162
167
176
181
TATAPOWER
93
98
102
108
111
TATASTEEL
410
422
429
442
449
TCS
1,036
1,050
1,062
1,076
1,088
WIPRO
329
339
344
355
360
Technical Research Team
For Private Circulation Only |
3
Technical Report
RESEARCH TEAM
Shardul Kulkarni
Head - Technicals
Mileen Vasudeo
Technical Analyst
Sameet Chavan
Technical Analyst
Sacchitanand Uttekar
Technical Analyst
Mehul Kothari
Technical Analyst
Research Team: 022-3952 6600
DISCLAIMER: This document is not for public distribution and has been furnished to you solely for your information
and must not be reproduced or redistributed to any other person. Persons into whose possession this document may
come are required to observe these restrictions.
Opinion expressed is our current opinion as of the date appearing on this material only. While we endeavor to update
on a reasonable basis the information discussed in this material, there may be regulatory, compliance, or other reasons
that prevent us from doing so. Prospective investors and others are cautioned that any forward-looking statements are
not predictions and may be subject to change without notice. Our proprietary trading and investment businesses may
make investment decisions that are inconsistent with the recommendations expressed herein.
The information in this document has been printed on the basis of publicly available information, internal data and
other reliable sources believed to be true and are for general guidance only. While every effort is made to ensure the
accuracy and completeness of information contained, the company takes no guarantee and assumes no liability for any
errors or omissions of the information. No one can use the information as the basis for any claim, demand or cause of
action.
Recipients of this material should rely on their own investigations and take their own professional advice. Each recipient
of this document should make such investigations as it deems necessary to arrive at an independent evaluation of an
investment in the securities of companies referred to in this document (including the merits and risks involved), and
should consult their own advisors to determine the merits and risks of such an investment. Price and value of the
investments referred to in this material may go up or down. Past performance is not a guide for future performance.
Certain transactions - futures, options and other derivatives as well as non-investment grade securities - involve
substantial risks and are not suitable for all investors. Reports based on technical analysis centers on studying charts of a
stock's price movement and trading volume, as opposed to focusing on a company's fundamentals and as such, may
not match with a report on a company's fundamentals.
We do not undertake to advise you as to any change of our views expressed in this document. While we would
endeavor to update the information herein on a reasonable basis, Angel Broking, its subsidiaries and associated
companies, their directors and employees are under no obligation to update or keep the information current. Also there
may be regulatory, compliance, or other reasons that may prevent Angel Broking and affiliates from doing so.
Prospective investors and others are cautioned that any forward-looking statements are not predictions and may be
subject to change without notice.
Angel Broking Limited and affiliates, including the analyst who has issued this report, may, on the date of this report,
and from time to time, have long or short positions in, and buy or sell the securities of the companies mentioned herein
or engage in any other transaction involving such securities and earn brokerage or compensation or act as advisor or
have other potential conflict of interest with respect to company/ies mentioned herein or inconsistent with any
recommendation and related information and opinions.
Angel Broking Limited and affiliates may seek to provide or have engaged in providing corporate finance, investment
banking or other advisory services in a merger or specific transaction to the companies referred to in this report, as on
the date of this report or in the past.
Sebi Registration No : INB 010996539
For Private Circulation Only |