Technical Research | February 10, 2012
Daily Technical Report
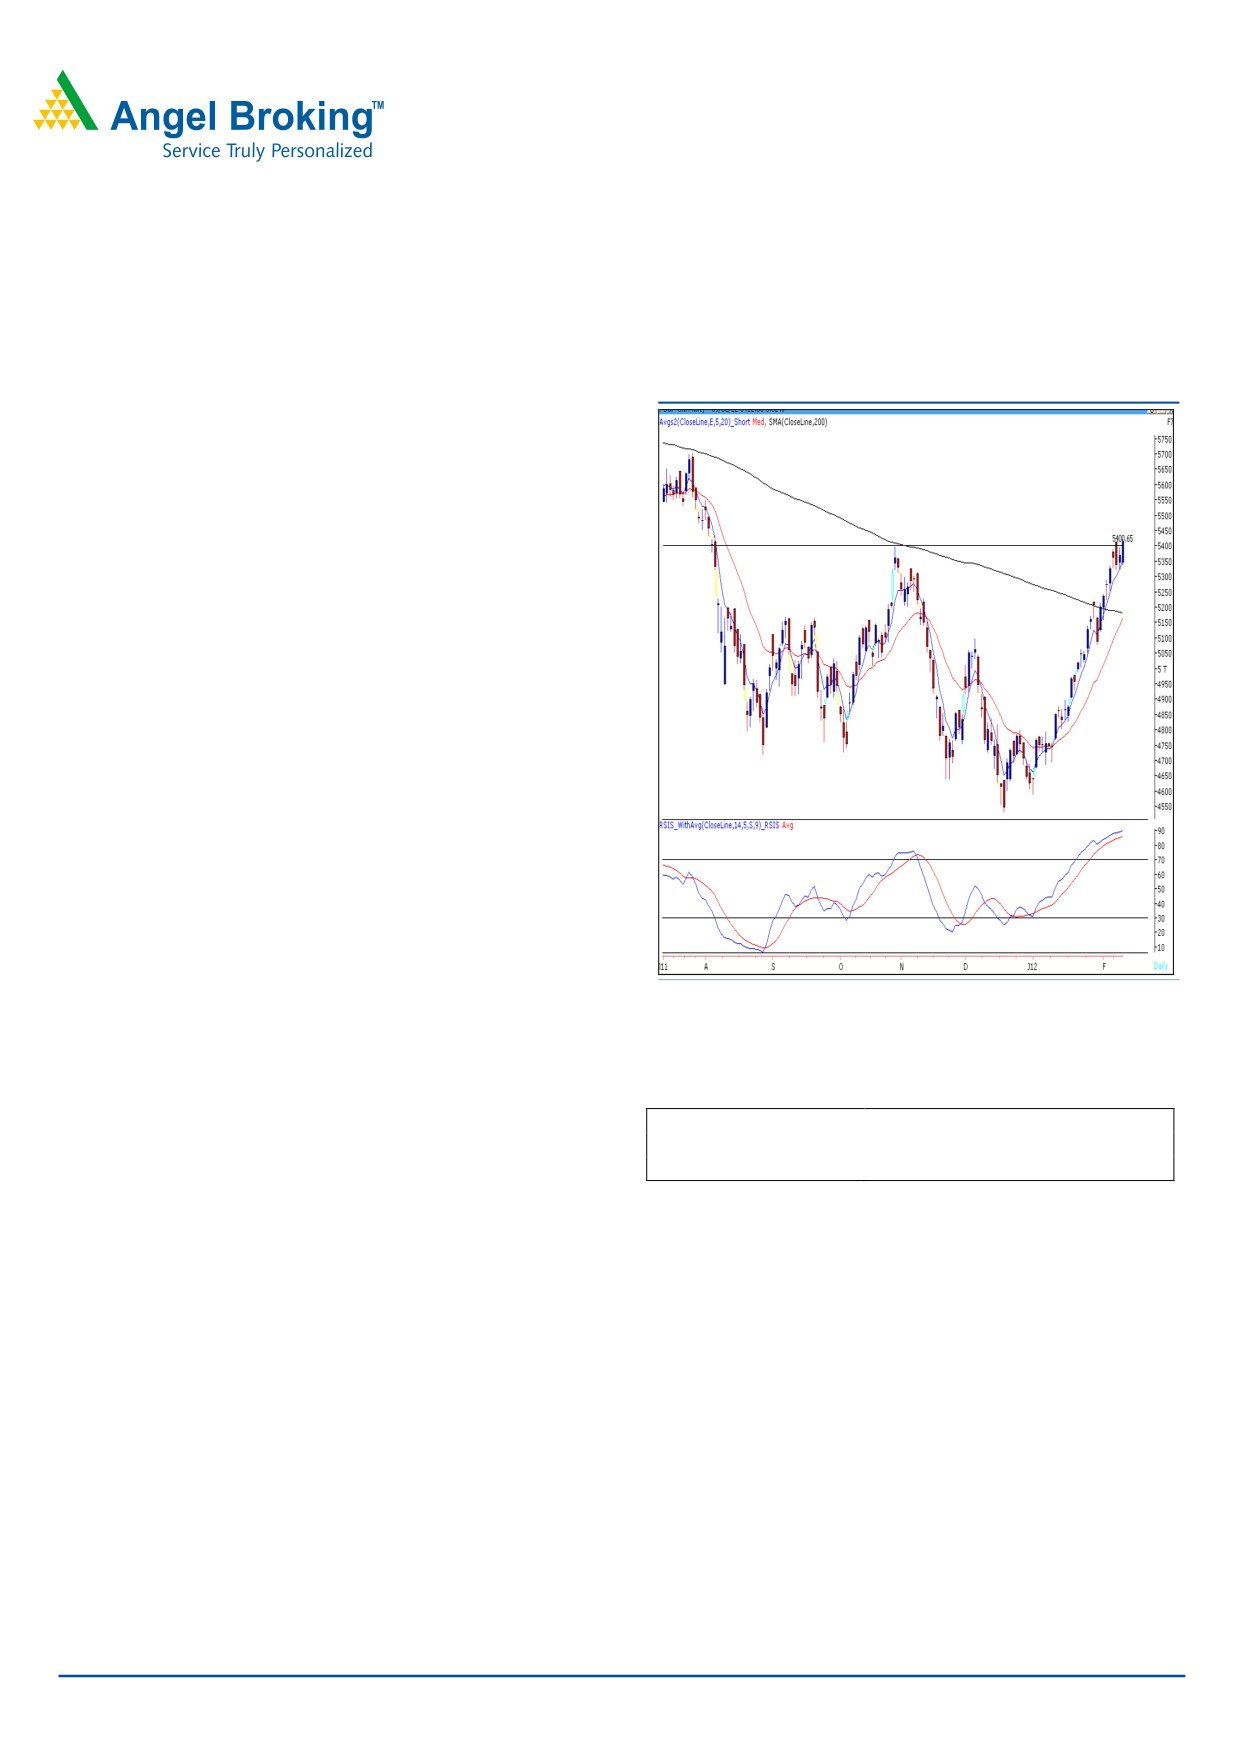
Sensex (17831) / NIFTY (5412)
Exhibit 1: Nifty Daily Chart
Yesterday, our bechmark indices opened flat and traded in
a narrow range throughout the day but strong buying in the
final hour of trade led Nifty to close above 5400 mark after
Aug 2011. Once again, the rally was led by Metal, Realty
and Banking counters. Sectors like, Oil & Gas and
Consumer Durables ended with a nominal loss. The
advance to decline ratio was in favor of advancing
Formation:
• Indices are hovering around “Horizontal Line”
resistance of 17908 / 5400.
• The “RSI-Smoothened” oscillator on daily chart is
placed in extreme overbought territory.
• Tuesday’s price action indicates a “Bearish Engulfing”
pattern.
• The momentum oscillator on the daily chart viz., the
Source: Falcon
“Stochastic” is negatively poised.
Actionable points:
Trading strategy:
View
Neutral
Yesterday, indices again made an attempt to cross 5400
Resistance levels
5435 - 5500
mark and finally succeeded to close above that after Aug
Support levels
5322 - 5290 - 5225
2011. Indices have almost negated the “Bearish Engulfing”
pattern and have just closed marginally below the high of
this pattern. The liquidity is the system remains abundant
and the FII’s are on a buying spree. Going forward, if
indices trades convincingly above 17880 / 5424 level then
they are likely to rally towards 18000 - 18280 / 5435 -
5500 levels. On the downside, violation of 17582 / 5322
level may attract strong selling pressure and indices may
slide towards 17504 - 17308 / 5290 - 5225 levels.
For Private Circulation Only |
1
Technical Research | February 10, 2012
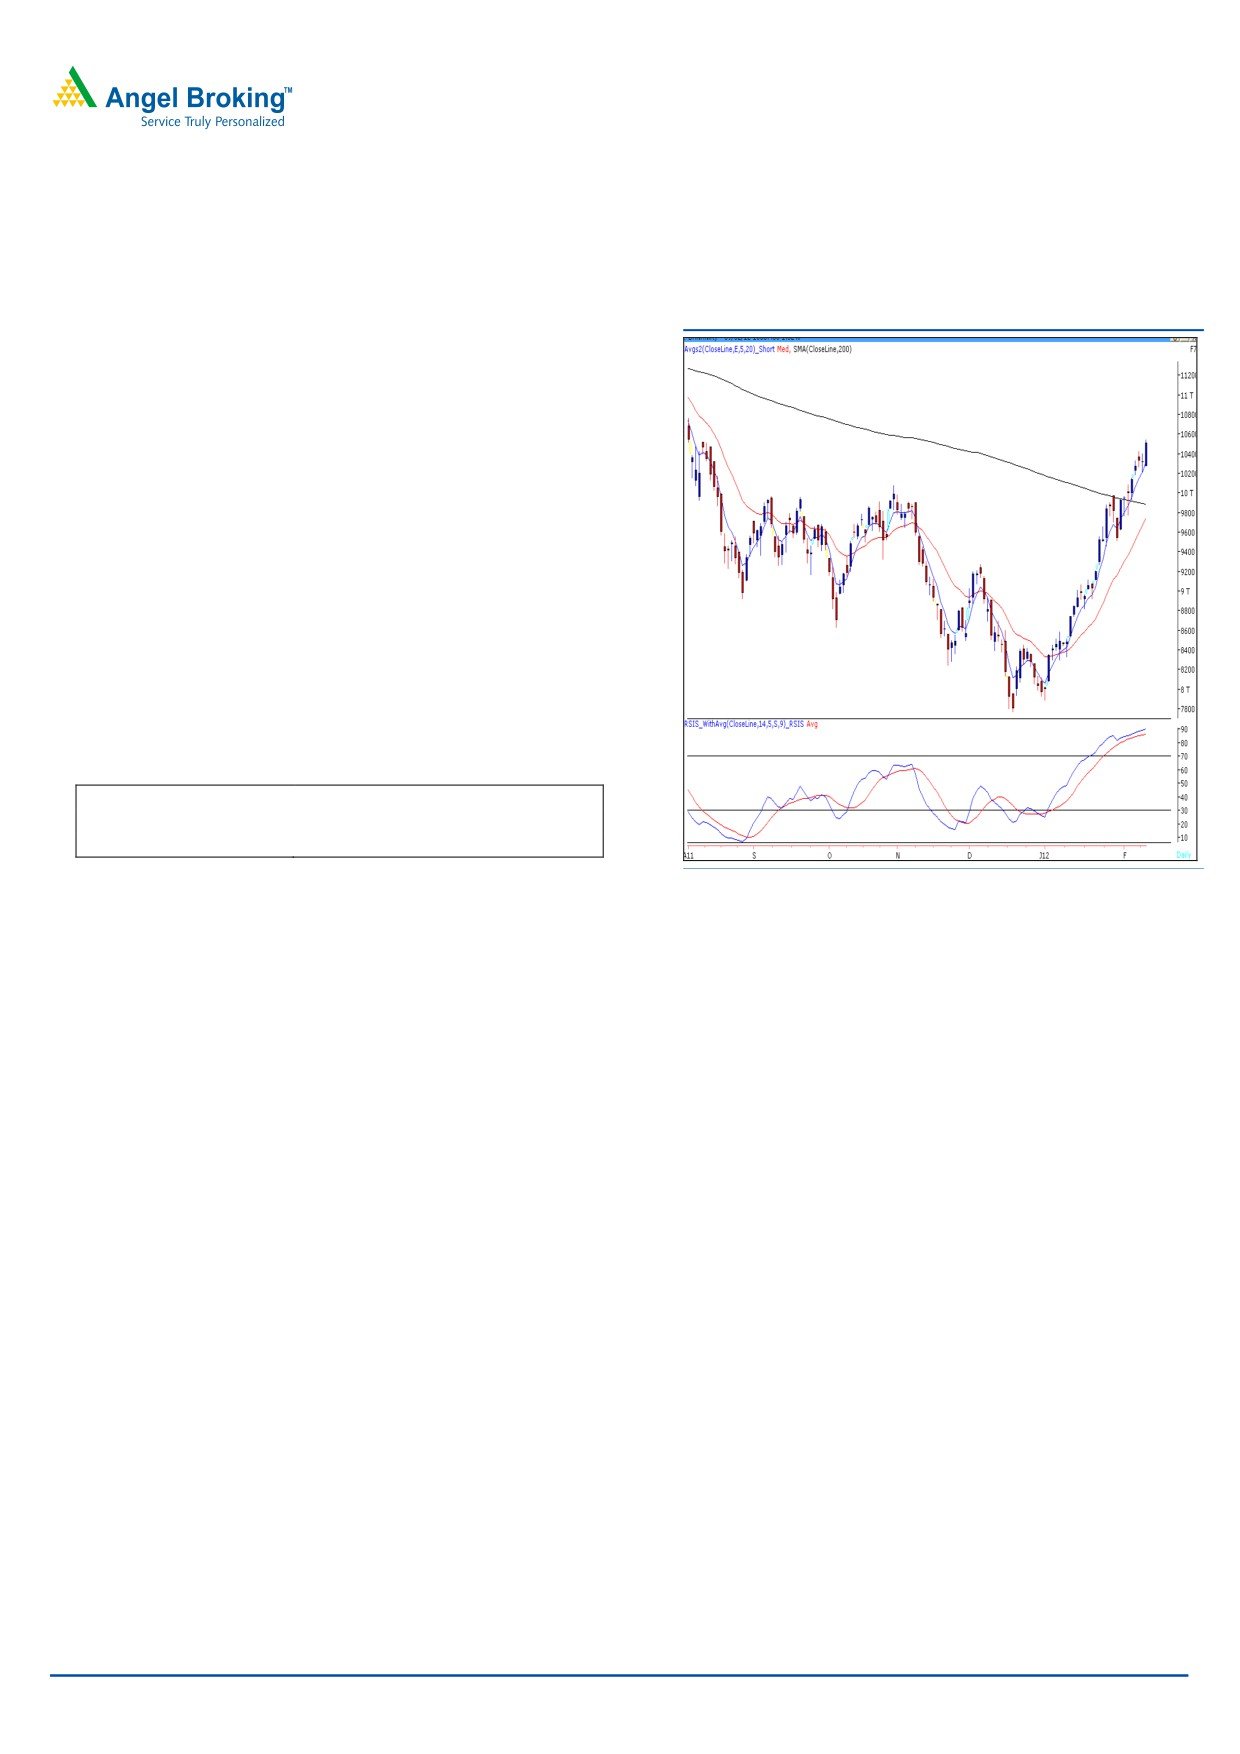
Bank Nifty Outlook - (10508)
Exhibit 2: Bank Nifty Daily Chart
After a consolidation of three days, Bank Nifty finally
managed to give a breakout on the higher side of the
said range of 10180 - 10430. The “ADX (14)” indicator
is at 36.33 level which shows that the ongoing uptrend is
gaining further strength. Thus, going forward, on the
upside, if the index manages to sustain above yesterday’s
high of 10546 then it is likely to test 10670 - 10705. On
the downside 10267 - 10180 levels are likely to act as
support in coming trading session. The placement of the
“RSI Smoothened” oscillator indicates that traders should
not take aggressive long positions at current levels and
should trade with strict stop losses.
Actionable points:
View
Neutral
Resistance levels
10670 - 10705
Support levels
10267 - 10180
Source: Falcon
For Private Circulation Only |
2
Technical Research | February 10, 2012
Positive Bias:
Expected
Stock Name
CMP
5 Day EMA
20 Day EMA
Remarks
Target
Great Offshor
107.6
104.4
96.8
119
View will change below 101
For Private Circulation Only |
3
Technical Research | February 10, 2012
Daily Pivot Levels for Nifty 50 Stocks
SCRIPS
S2
S1
PIVOT
R1
R2
SENSEX
17,503
17,667
17,773
17,937
18,043
NIFTY
5,307
5,360
5,392
5,444
5,476
BANKNIFTY
10,161
10,334
10,440
10,614
10,720
ACC
1,358
1,373
1,386
1,402
1,415
AMBUJACEM
173
176
179
181
184
AXISBANK
1,092
1,113
1,128
1,149
1,163
BAJAJ-AUTO
1,612
1,657
1,683
1,728
1,754
BHARTIARTL
340
345
349
355
359
BHEL
257
260
263
265
268
BPCL
562
580
593
611
623
CAIRN
372
377
381
386
390
CIPLA
347
350
353
355
358
COALINDIA
329
331
334
336
339
DLF
223
228
234
239
244
DRREDDY
1,596
1,618
1,631
1,652
1,666
GAIL
380
385
390
394
399
HCLTECH
455
459
465
469
475
HDFC
684
691
695
702
706
HDFCBANK
498
510
518
530
538
HEROMOTOCO
1,936
1,965
2,000
2,029
2,064
HINDALCO
143
151
157
164
170
HINDUNILVR
382
388
391
397
401
ICICIBANK
901
920
933
952
964
IDFC
133
135
137
140
141
INFY
2,698
2,754
2,788
2,844
2,878
ITC
201
202
204
205
207
JINDALSTEL
566
585
595
614
625
JPASSOCIAT
75
77
78
80
81
KOTAKBANK
518
535
545
561
572
LT
1,324
1,340
1,356
1,371
1,387
M&M
672
687
697
712
722
MARUTI
1,244
1,257
1,268
1,281
1,292
NTPC
175
177
179
182
184
ONGC
272
277
280
285
288
PNB
968
984
994
1,010
1,020
POWERGRID
106
108
109
110
112
RANBAXY
446
449
453
455
459
RCOM
91
93
94
97
98
RELIANCE
835
844
852
862
869
RELINFRA
576
584
592
600
607
RPOWER
99
103
105
109
112
SAIL
102
105
107
111
113
SBIN
2,143
2,164
2,178
2,198
2,212
SESAGOA
220
225
228
233
236
SIEMENS
772
787
795
810
818
STER
118
124
128
134
137
SUNPHARMA
530
536
546
553
563
SUZLON
28
30
31
32
33
TATAMOTORS
245
251
255
261
265
TATAPOWER
104
108
110
114
117
TATASTEEL
434
443
449
458
463
TCS
1,172
1,200
1,216
1,244
1,260
WIPRO
421
433
441
453
461
Technical Research Team
For Private Circulation Only |
4
Technical Report
RESEARCH TEAM
Shardul Kulkarni
Head - Technicals
Sameet Chavan
Technical Analyst
Sacchitanand Uttekar
Technical Analyst
Mehul Kothari
Technical Analyst
Ankur Lakhotia
Technical Analyst
Research Team: 022-3952 6600
DISCLAIMER: This document is not for public distribution and has been furnished to you solely for your information and must not
be reproduced or redistributed to any other person. Persons into whose possession this document may come are required to observe
these restrictions.
Opinion expressed is our current opinion as of the date appearing on this material only. While we endeavor to update on a
reasonable basis the information discussed in this material, there may be regulatory, compliance, or other reasons that prevent us
from doing so. Prospective investors and others are cautioned that any forward-looking statements are not predictions and may be
subject to change without notice. Our proprietary trading and investment businesses may make investment decisions that are
inconsistent with the recommendations expressed herein.
The information in this document has been printed on the basis of publicly available information, internal data and other reliable
sources believed to be true and are for general guidance only. While every effort is made to ensure the accuracy and completeness of
information contained, the company takes no guarantee and assumes no liability for any errors or omissions of the information. No
one can use the information as the basis for any claim, demand or cause of action.
Recipients of this material should rely on their own investigations and take their own professional advice. Each recipient of this
document should make such investigations as it deems necessary to arrive at an independent evaluation of an investment in the
securities of companies referred to in this document (including the merits and risks involved), and should consult their own advisors to
determine the merits and risks of such an investment. Price and value of the investments referred to in this material may go up or
down. Past performance is not a guide for future performance. Certain transactions - futures, options and other derivatives as well as
non-investment grade securities - involve substantial risks and are not suitable for all investors. Reports based on technical analysis
centers on studying charts of a stock's price movement and trading volume, as opposed to focusing on a company's fundamentals
and as such, may not match with a report on a company's fundamentals.
We do not undertake to advise you as to any change of our views expressed in this document. While we would endeavor to update
the information herein on a reasonable basis, Angel Broking, its subsidiaries and associated companies, their directors and
employees are under no obligation to update or keep the information current. Also there may be regulatory, compliance, or other
reasons that may prevent Angel Broking and affiliates from doing so. Prospective investors and others are cautioned that any
forward-looking statements are not predictions and may be subject to change without notice.
Angel Broking Limited and affiliates, including the analyst who has issued this report, may, on the date of this report, and from time
to time, have long or short positions in, and buy or sell the securities of the companies mentioned herein or engage in any other
transaction involving such securities and earn brokerage or compensation or act as advisor or have other potential conflict of interest
with respect to company/ies mentioned herein or inconsistent with any recommendation and related information and opinions.
Angel Broking Limited and affiliates may seek to provide or have engaged in providing corporate finance, investment banking or
other advisory services in a merger or specific transaction to the companies referred to in this report, as on the date of this report or
in the past.
Sebi Registration No : INB 010996539
For Private Circulation Only |