Technical Research | January 10, 2012
Daily Technical Report
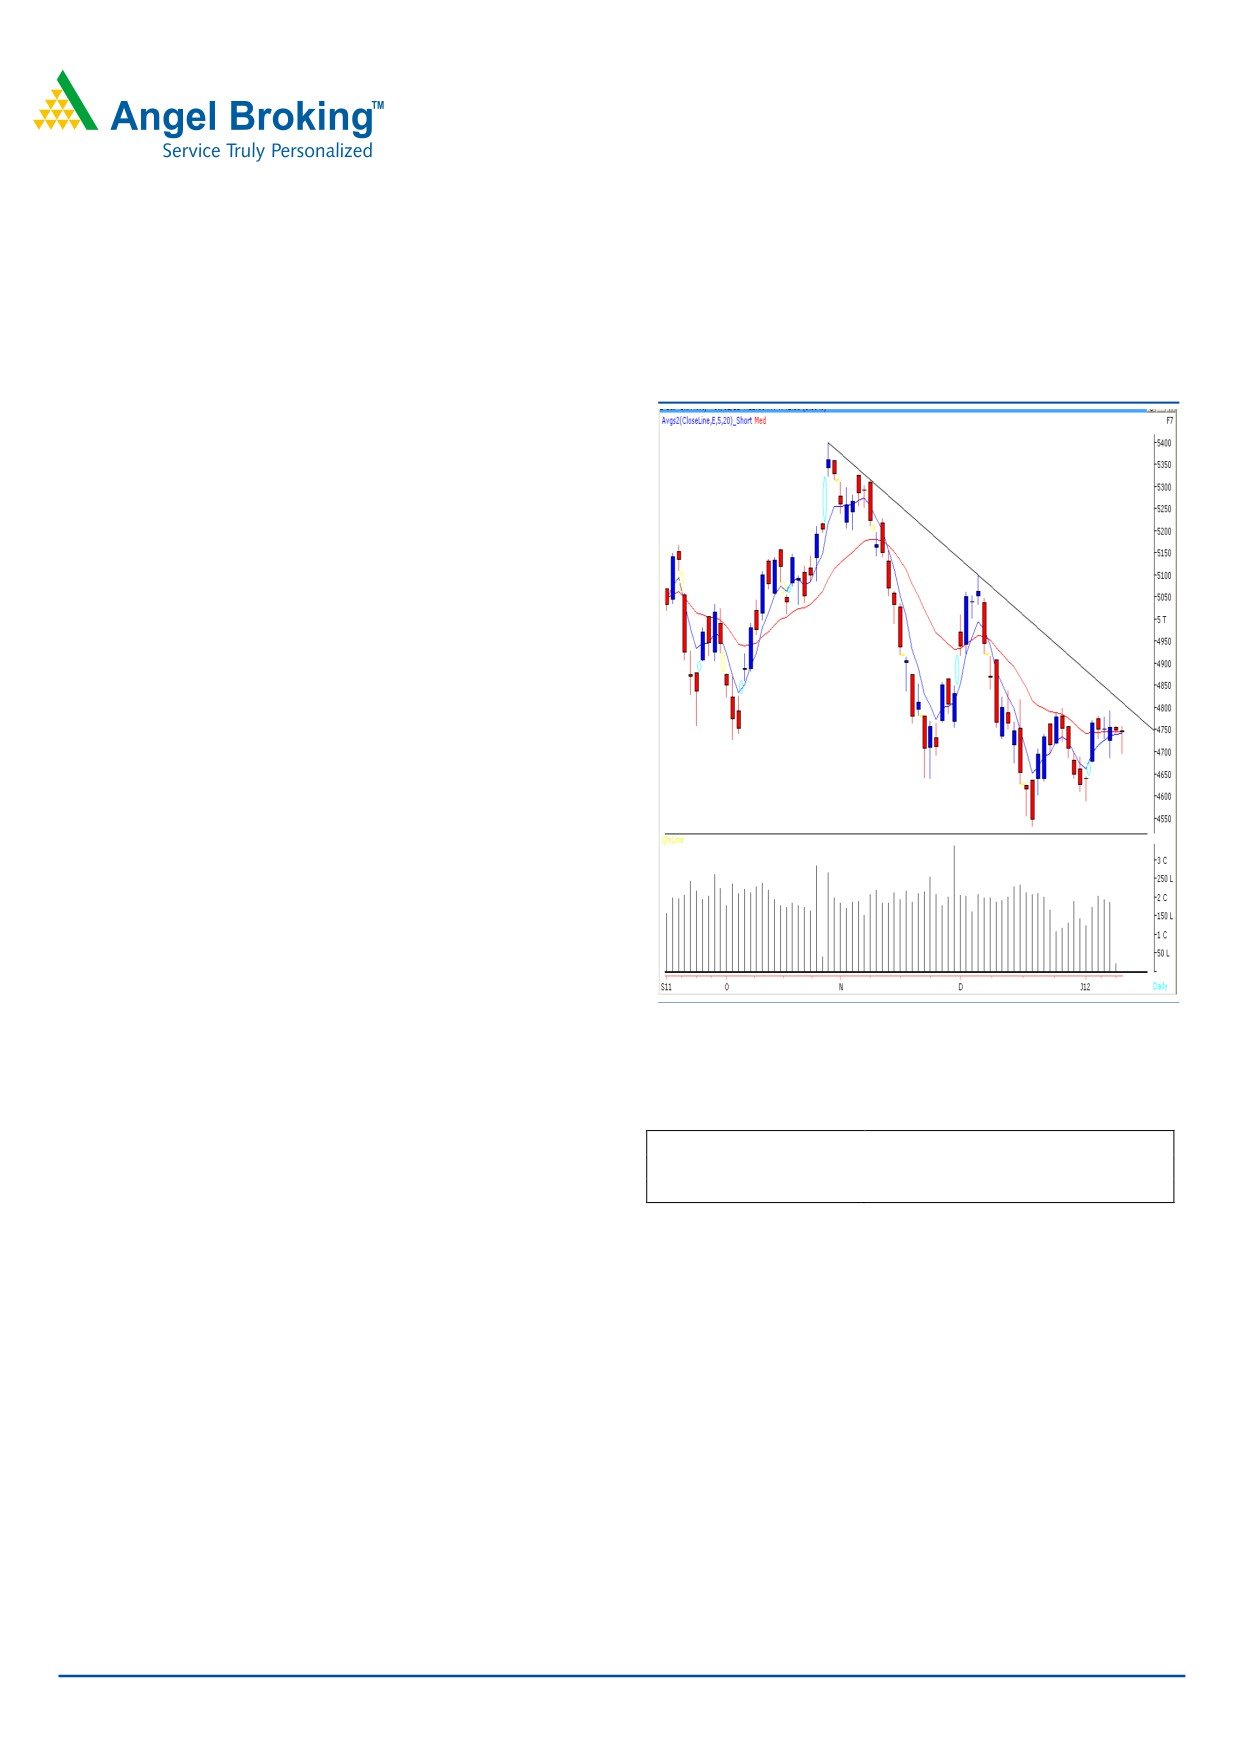
Sensex (15815) / NIFTY (4743)
Exhibit 1: Nifty Daily Chart
Yesterday, markets opened marginally lower in-line with
negative global cues. Selling pressure was witnessed during
the first half which dragged indices near 4700 mark.
However, a smart recovery during the second half pushed
indices from the day’s low to close around 15800 / 4750
mark. On the sectoral front, Power, Realty and Capital
Goods sectors were among the major gainers, whereas Oil
& Gas and FMCG counters ended on a losing side. The
advance to decline ratio was strongly in favor of gaining
counters.
(A=1640 D=1080).
(Source
-
Formation:
• The 20 - day EMA (Exponential Moving Average) has
now shifted to the 15846 / 4745 level.
• We are witnessing a positive crossover in weekly
momentum oscillators viz., the RSI and the Stochastic.
• On the Daily chart, we are observing a “Downward
Source: Falcon
Sloping Trend Line” resistance around 16070 / 4820 level.
Actionable points:
Trading strategy:
View
Positive Above 4820
After a weak opening, indices slipped initially towards the
Expected Targets
4881 - 4920
4700 mark. However, a strong buying emerged near day’s
Support level
4686
low, which pushed indices higher to close near 15800 /
4750 mark. As a result there is no change in the daily chart
structure or the view on the Index. Going forward, we
continue to mention that indices have a stiff resistance
around 16070 / 4820 level. The positive momentum is
likely to resume only if this resistance level is crossed on a
sustainable basis. In this case, indices are likely to head
towards 16286 - 16421/ 4881 - 4920 levels. On the
downside, support is seen around 15664 - 15640 / 4686 -
4673 levels.
For Private Circulation Only |
1
Technical Research | January 10, 2012
Bank Nifty Outlook - (8481)
Exhibit 2: Bank Nifty Daily Chart
Yesterday, Bank Nifty opened on flat note and traded with
extreme volatility throughout the session. For the second
straight session, the index took support near the mentioned
support level of 8339 and bounced back sharply. We are
witnessing a narrow range body formation, which is a sign
of indecision in the minds of bulls and bears. Only a
sustainable move outside the range of 8604 - 8297 will
decide the direction of the index. Resistance levels are at
8580 - 8604 and support levels at 8339 - 8297.
Actionable points:
View
Positive Above 8604
Expected Target
8697 - 8800
Support Levels
8339 - 8297
Source: Falcon
Stock Recommendations:
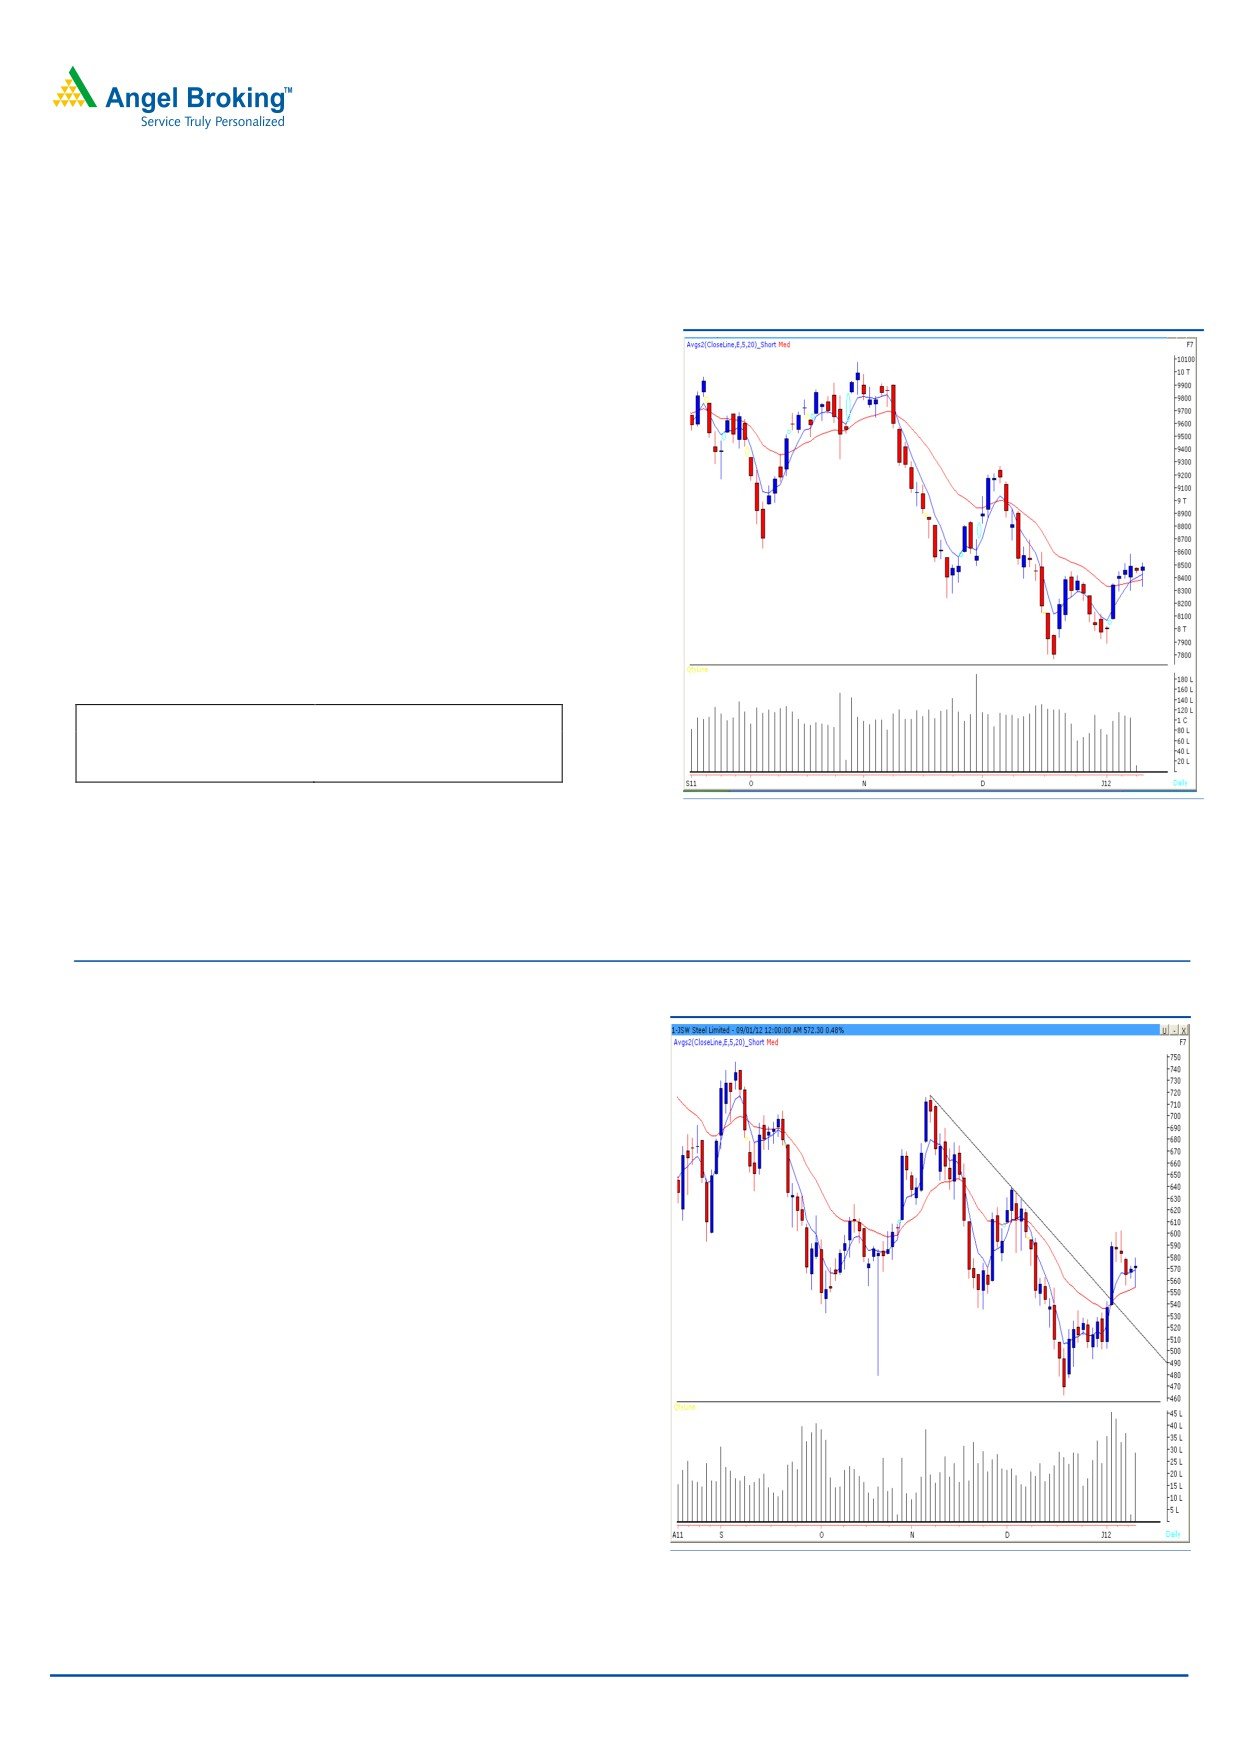
Exhibit 3: JSW STEEL (NSE Cash)
Stock - JSW STEEL (NSE Cash)
Action - Buy
Last close
` 572.30
Buying Above
` 580
Stop Loss
` 567
Target
` 610
Justification - On the Daily chart, we are witnessing that
after giving a trend line breakout near ` 540 level along
with positive crossover in “5 & 20 EMA”, the stock has been
consolidating for few days. During this time frame, we have
observed that for the second time stock has managed to
take support near ` 554 level which coincides with the
value of “20 Day EMA”. Hence, we advise buying the stock
ONLY above ` 580 for a target of ` 610 in coming 5 - 6
trading sessions.
Source: Falcon
For Private Circulation Only |
2
Technical Research | January 10, 2012
Positive Bias:
Expected
Stock Name
CMP
5 Day EMA
20 Day EMA
Remarks
Target
Delta Corp
64.4
62.2
62.4
74
View will change below 59
Auro Pharma
96.5
92.2
90.7
110
View will change below 88.5
Negative Bias:
Expected
Stock Name
CMP
5 Day EMA
20 Day EMA
Remarks
Target
Baja Auto
1422
1453.4
1541.3
1360
View will change above 1475
For Private Circulation Only |
3
Technical Research | January 10, 2012
Daily Pivot Levels for Nifty 50 Stocks
SCRIPS
S2
S1
PIVOT
R1
R2
SENSEX
15,595
15,705
15,788
15,898
15,981
NIFTY
4,669
4,706
4,732
4,769
4,796
BANKNIFTY
8,255
8,368
8,443
8,556
8,631
ACC
1,083
1,092
1,100
1,108
1,116
AMBUJACEM
149
150
152
154
155
AXISBANK
824
841
852
869
881
BAJAJ-AUTO
1,387
1,405
1,426
1,444
1,466
BHARTIARTL
313
317
324
327
334
BHEL
242
250
255
263
268
BPCL
459
464
470
475
481
CAIRN
328
331
337
340
345
CIPLA
328
336
341
350
355
DLF
172
175
177
180
182
DRREDDY
1,577
1,589
1,602
1,614
1,627
GAIL
371
376
383
388
395
HCLTECH
410
412
416
418
421
HDFC
649
656
663
670
677
HDFCBANK
442
449
453
460
464
HEROMOTOCO
1,691
1,710
1,722
1,741
1,753
HINDALCO
113
116
117
120
122
HINDUNILVR
388
391
393
396
399
ICICIBANK
721
734
745
758
769
IDFC
94
97
99
102
104
INFY
2,791
2,814
2,840
2,863
2,889
ITC
199
200
201
203
204
JINDALSTEL
437
458
471
492
505
JPASSOCIAT
49
51
52
55
56
KOTAKBANK
440
447
452
458
463
LT
1,029
1,059
1,076
1,105
1,122
M&M
633
643
649
659
666
MARUTI
938
954
965
981
992
NTPC
155
156
157
158
159
ONGC
251
254
256
260
262
PNB
787
806
820
839
854
POWERGRID
98
100
101
102
103
RANBAXY
429
436
442
449
455
RCOM
73
76
77
80
82
RELCAPITAL
243
252
259
268
276
RELIANCE
696
701
708
713
720
RELINFRA
357
368
377
388
397
RPOWER
73
74
75
76
77
SAIL
82
83
84
86
87
SBIN
1,605
1,621
1,641
1,658
1,678
SESAGOA
157
159
163
166
169
SIEMENS
663
671
677
685
691
STER
91
93
94
96
98
SUNPHARMA
495
500
504
510
514
SUZLON
17
18
19
19
20
TATAMOTORS
196
198
201
203
205
TATAPOWER
91
92
93
94
95
TATASTEEL
349
356
361
367
372
TCS
1,158
1,165
1,172
1,179
1,187
WIPRO
395
398
403
406
412
Technical Research Team
For Private Circulation Only |
4
Technical Report
RESEARCH TEAM
Shardul Kulkarni
Head - Technicals
Sameet Chavan
Technical Analyst
Sacchitanand Uttekar
Technical Analyst
Mehul Kothari
Technical Analyst
Ankur Lakhotia
Technical Analyst
Research Team: 022-3952 6600
DISCLAIMER: This document is not for public distribution and has been furnished to you solely for your information and must not
be reproduced or redistributed to any other person. Persons into whose possession this document may come are required to observe
these restrictions.
Opinion expressed is our current opinion as of the date appearing on this material only. While we endeavor to update on a
reasonable basis the information discussed in this material, there may be regulatory, compliance, or other reasons that prevent us
from doing so. Prospective investors and others are cautioned that any forward-looking statements are not predictions and may be
subject to change without notice. Our proprietary trading and investment businesses may make investment decisions that are
inconsistent with the recommendations expressed herein.
The information in this document has been printed on the basis of publicly available information, internal data and other reliable
sources believed to be true and are for general guidance only. While every effort is made to ensure the accuracy and completeness of
information contained, the company takes no guarantee and assumes no liability for any errors or omissions of the information. No
one can use the information as the basis for any claim, demand or cause of action.
Recipients of this material should rely on their own investigations and take their own professional advice. Each recipient of this
document should make such investigations as it deems necessary to arrive at an independent evaluation of an investment in the
securities of companies referred to in this document (including the merits and risks involved), and should consult their own advisors to
determine the merits and risks of such an investment. Price and value of the investments referred to in this material may go up or
down. Past performance is not a guide for future performance. Certain transactions - futures, options and other derivatives as well as
non-investment grade securities - involve substantial risks and are not suitable for all investors. Reports based on technical analysis
centers on studying charts of a stock's price movement and trading volume, as opposed to focusing on a company's fundamentals
and as such, may not match with a report on a company's fundamentals.
We do not undertake to advise you as to any change of our views expressed in this document. While we would endeavor to update
the information herein on a reasonable basis, Angel Broking, its subsidiaries and associated companies, their directors and
employees are under no obligation to update or keep the information current. Also there may be regulatory, compliance, or other
reasons that may prevent Angel Broking and affiliates from doing so. Prospective investors and others are cautioned that any
forward-looking statements are not predictions and may be subject to change without notice.
Angel Broking Limited and affiliates, including the analyst who has issued this report, may, on the date of this report, and from time
to time, have long or short positions in, and buy or sell the securities of the companies mentioned herein or engage in any other
transaction involving such securities and earn brokerage or compensation or act as advisor or have other potential conflict of interest
with respect to company/ies mentioned herein or inconsistent with any recommendation and related information and opinions.
Angel Broking Limited and affiliates may seek to provide or have engaged in providing corporate finance, investment banking or
other advisory services in a merger or specific transaction to the companies referred to in this report, as on the date of this report or
in the past.
Sebi Registration No : INB 010996539
For Private Circulation Only |