Technical Research | October 10, 2011
Daily Technical Report
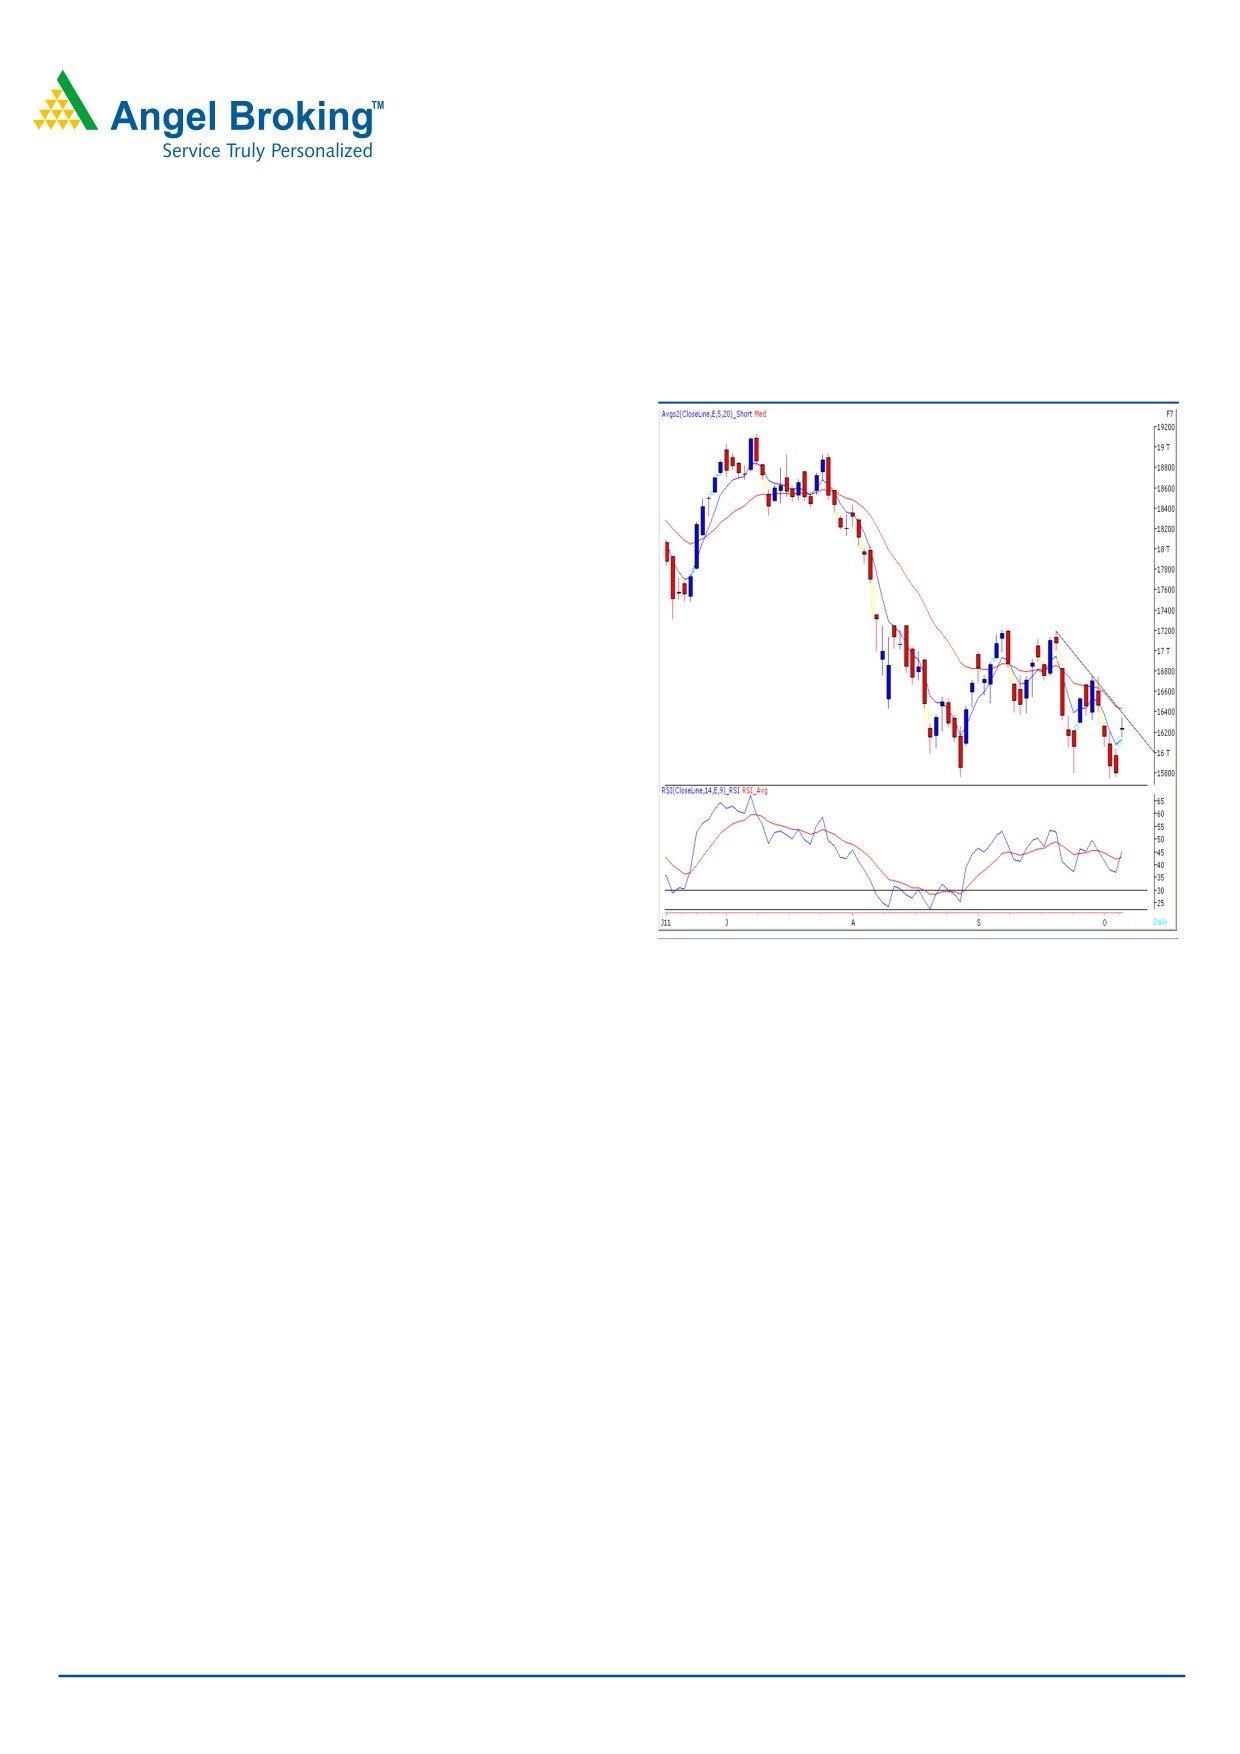
Sensex (16233) / NIFTY (4888)
Markets opened with a huge gap up on Friday mainly on
Exhibit 1: Sensex Daily Chart
account of positive global cues and traded in a narrow
range during the first half of the session, however during
the second half volatility increased and indices managed to
close near the initial opening level. On the sector front,
gains were seen in all the sectors. Metals, Banking, Realty,
Consumer Goods and Oil & Gas were the major gainers
which pulled the indices higher. The advance decline ratio
was strongly in favor of advancing counters (A=1802
Formation
• The Weekly chart depicts a Japanese candlestick
pattern which resembles a “Dragonfly Doji”.
• The Daily “RSI” momentum oscillator has given a
positive crossover.
• The “20 EMA” on Daily chart is now placed at 16430 /
4940 level.
Source: Falcon
• On the Daily chart, we are observing a “Downward
sloping trend line” around 16430 / 4940 level.
Trading strategy:
However, a combination of the “20 EMA” and “Downward
Last week, Indices moved in a trading range and made a
sloping trend line” indicates immediate resistance at 16430
couple of attempts to break crucial support level of 15765 /
/ 4940 level. Therefore, looking at the above technical
4720. However, indices failed to break this level on closing
evidences, if indices manage to sustain above 16430 /
basis and registered a weekly close significantly higher from
4940 level then they are likely to rally towards the downside
gap area of 16800 - 17000 / 5050 - 5010 created on
their lows. Thus, we are now observing a Japanese
22nd September 2011. On the downside, 16045 - 15745
candlestick pattern which resembles a “Dragonfly Doji” at
/ 4828 - 4720 levels would act as support levels in coming
crucial support level. The said pattern will be confirmed
trading session. We reiterate that the selling pressure may
ONLY above last week’s high of 16348 / 4923. In addition,
intensify only if indices manage to break and close below
the “RSI” momentum oscillator has given a positive
15745 / 4720 level. In such scenario, they are likely to drift
crossover in daily chart.
towards 15650 - 15330 / 4675 - 4540 levels.
For Private Circulation Only |
1
Technical Research | October 10, 2011
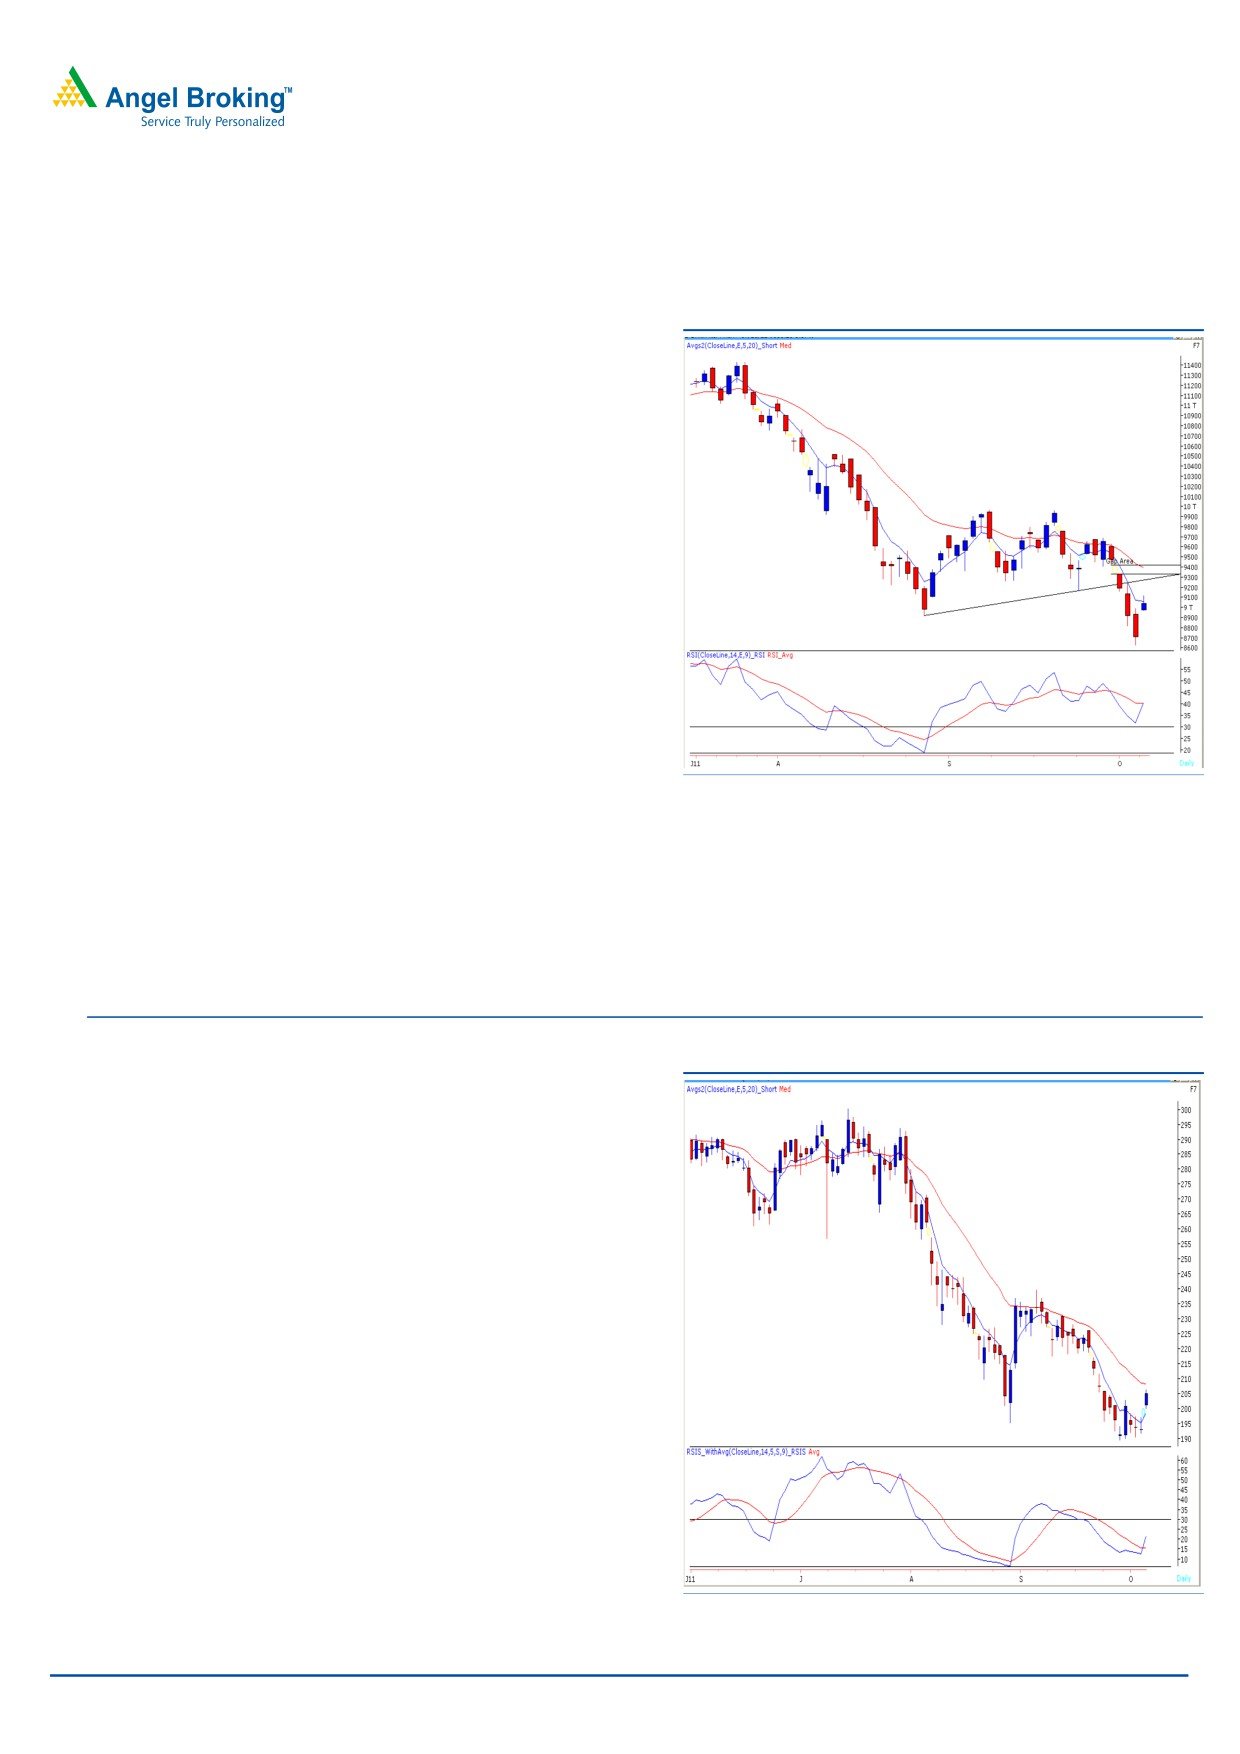
Bank Nifty Outlook - (9038)
During last week, in the daily chart of Bank Nifty we
Exhibit 2: Bank Nifty Daily Chart
witnessed a trend line breakdown near the level of 9180.
However, we are also witnessing positive divergence in the
“RSI” momentum oscillator. On Friday’s trading session
indices have opened and sustained above Wednesday’s
high leading to a bear trap situation. Thus, going forward,
we expect that if Bank Nifty sustains above 9120 level then
it is likely to test the downward gap area of 9333 to 9420.
On the downside, 8870 - 8810 levels may act as support in
the coming trading sessions.
Source: Falcon
Stock Recommendations:
Exhibit 3: Sesa Goa Daily chart
Stock - SesaGoa
Action - Buy
Range
: ` 205-201
Stop Loss : ` 196.25
Target
: ` 218
Justification - On Weekly chart, the stock has formed
“Bullish Hammer” Japanese candle stick pattern in the
previous week. This reversal pattern along with rise in
volumes near the down ward sloping trend line support,
indicates probability of a bounce. The said pattern will be
confirmed only above the high of the hammer which is at
Rs. 206. Positive crossover in RSI- Smoothened oscillator on
the daily chart indicates strength and increases the
likelihood of a temporary reversal in trend.
Therefore, we advise buying the stock in a range of Rs.205
to Rs.201 for a target of Rs.218 in coming 2 - 3 weeks.
Source: Falcon
For Private Circulation Only |
2
Technical Research | October 10, 2011
Daily Pivot Levels for Nifty 50 Stocks
SCRIPS
S2
S1
PIVOT
R1
R2
SENSEX
16,045
16,139
16,243
16,337
16,441
NIFTY
4,829
4,859
4,891
4,920
4,952
ABB
1,089
1,101
1,115
1,127
1,141
ACC
140
142
147
150
155
AMBUJACEM
954
992
1,015
1,053
1,077
AXISBANK
1,461
1,482
1,510
1,531
1,560
BHARTIARTL
332
343
360
371
387
BHEL
314
320
323
329
332
BPCL
661
665
670
674
679
CAIRN
261
266
273
277
284
CIPLA
279
282
286
289
293
DLF
210
214
217
221
225
GAIL
1,478
1,490
1,508
1,520
1,538
HCLTECH
403
407
413
417
423
HDFC
394
400
408
414
422
HDFCBANK
627
636
646
655
665
HEROHONDA
438
444
452
458
466
HINDALCO
1,863
1,902
1,951
1,990
2,039
HINDUNILVR
122
124
126
127
129
ICICIBANK
322
326
329
332
335
IDEA
807
816
824
832
840
IDFC
110
113
116
119
121
INFY
2,437
2,473
2,524
2,560
2,611
ITC
192
195
198
202
204
JINDALSTEL
444
463
477
497
511
JPASSOCIAT
70
72
74
75
77
KOTAKBANK
434
440
448
454
462
LT
1,365
1,379
1,389
1,403
1,412
M&M
784
790
797
804
811
MARUTI
1,083
1,098
1,112
1,127
1,140
NTPC
163
165
167
169
171
ONGC
254
259
265
271
277
PNB
897
911
928
942
958
POWERGRID
95
96
98
99
100
RANBAXY
505
511
521
527
537
RCOM
71
72
73
75
76
RELCAPITAL
315
318
323
327
331
RELIANCE
776
789
799
812
822
RELINFRA
379
385
390
396
402
RPOWER
79
80
81
82
83
SAIL
100
102
103
105
106
SBIN
1,722
1,737
1,758
1,773
1,793
SIEMENS
197
201
204
208
210
STER
821
829
843
851
865
SUNPHARMA
109
111
113
115
116
SUZLON
452
461
469
478
487
TATAMOTORS
35
35
36
37
37
TATAPOWER
150
155
158
162
165
TATASTEEL
94
96
100
102
106
TCS
407
413
417
424
428
UNITECH
1,014
1,031
1,055
1,072
1,095
WIPRO
321
328
336
343
351
Technical Research Team
For Private Circulation Only |
3
Technical Report
RESEARCH TEAM
Shardul Kulkarni
Head - Technicals
Mileen Vasudeo
Technical Analyst
Sameet Chavan
Technical Analyst
Sacchitanand Uttekar
Technical Analyst
Mehul Kothari
Technical Analyst
Research Team: 022-3952 6600
DISCLAIMER: This document is not for public distribution and has been furnished to you solely for your information
and must not be reproduced or redistributed to any other person. Persons into whose possession this document may
come are required to observe these restrictions.
Opinion expressed is our current opinion as of the date appearing on this material only. While we endeavor to update
on a reasonable basis the information discussed in this material, there may be regulatory, compliance, or other reasons
that prevent us from doing so. Prospective investors and others are cautioned that any forward-looking statements are
not predictions and may be subject to change without notice. Our proprietary trading and investment businesses may
make investment decisions that are inconsistent with the recommendations expressed herein.
The information in this document has been printed on the basis of publicly available information, internal data and
other reliable sources believed to be true and are for general guidance only. While every effort is made to ensure the
accuracy and completeness of information contained, the company takes no guarantee and assumes no liability for any
errors or omissions of the information. No one can use the information as the basis for any claim, demand or cause of
action.
Recipients of this material should rely on their own investigations and take their own professional advice. Each recipient
of this document should make such investigations as it deems necessary to arrive at an independent evaluation of an
investment in the securities of companies referred to in this document (including the merits and risks involved), and
should consult their own advisors to determine the merits and risks of such an investment. Price and value of the
investments referred to in this material may go up or down. Past performance is not a guide for future performance.
Certain transactions - futures, options and other derivatives as well as non-investment grade securities - involve
substantial risks and are not suitable for all investors. Reports based on technical analysis centers on studying charts of a
stock's price movement and trading volume, as opposed to focusing on a company's fundamentals and as such, may
not match with a report on a company's fundamentals.
We do not undertake to advise you as to any change of our views expressed in this document. While we would
endeavor to update the information herein on a reasonable basis, Angel Broking, its subsidiaries and associated
companies, their directors and employees are under no obligation to update or keep the information current. Also there
may be regulatory, compliance, or other reasons that may prevent Angel Broking and affiliates from doing so.
Prospective investors and others are cautioned that any forward-looking statements are not predictions and may be
subject to change without notice.
Angel Broking Limited and affiliates, including the analyst who has issued this report, may, on the date of this report,
and from time to time, have long or short positions in, and buy or sell the securities of the companies mentioned herein
or engage in any other transaction involving such securities and earn brokerage or compensation or act as advisor or
have other potential conflict of interest with respect to company/ies mentioned herein or inconsistent with any
recommendation and related information and opinions.
Angel Broking Limited and affiliates may seek to provide or have engaged in providing corporate finance, investment
banking or other advisory services in a merger or specific transaction to the companies referred to in this report, as on
the date of this report or in the past.
Sebi Registration No : INB 010996539
For Private Circulation Only |