Technical Research | December 09, 2011
Daily Technical Report
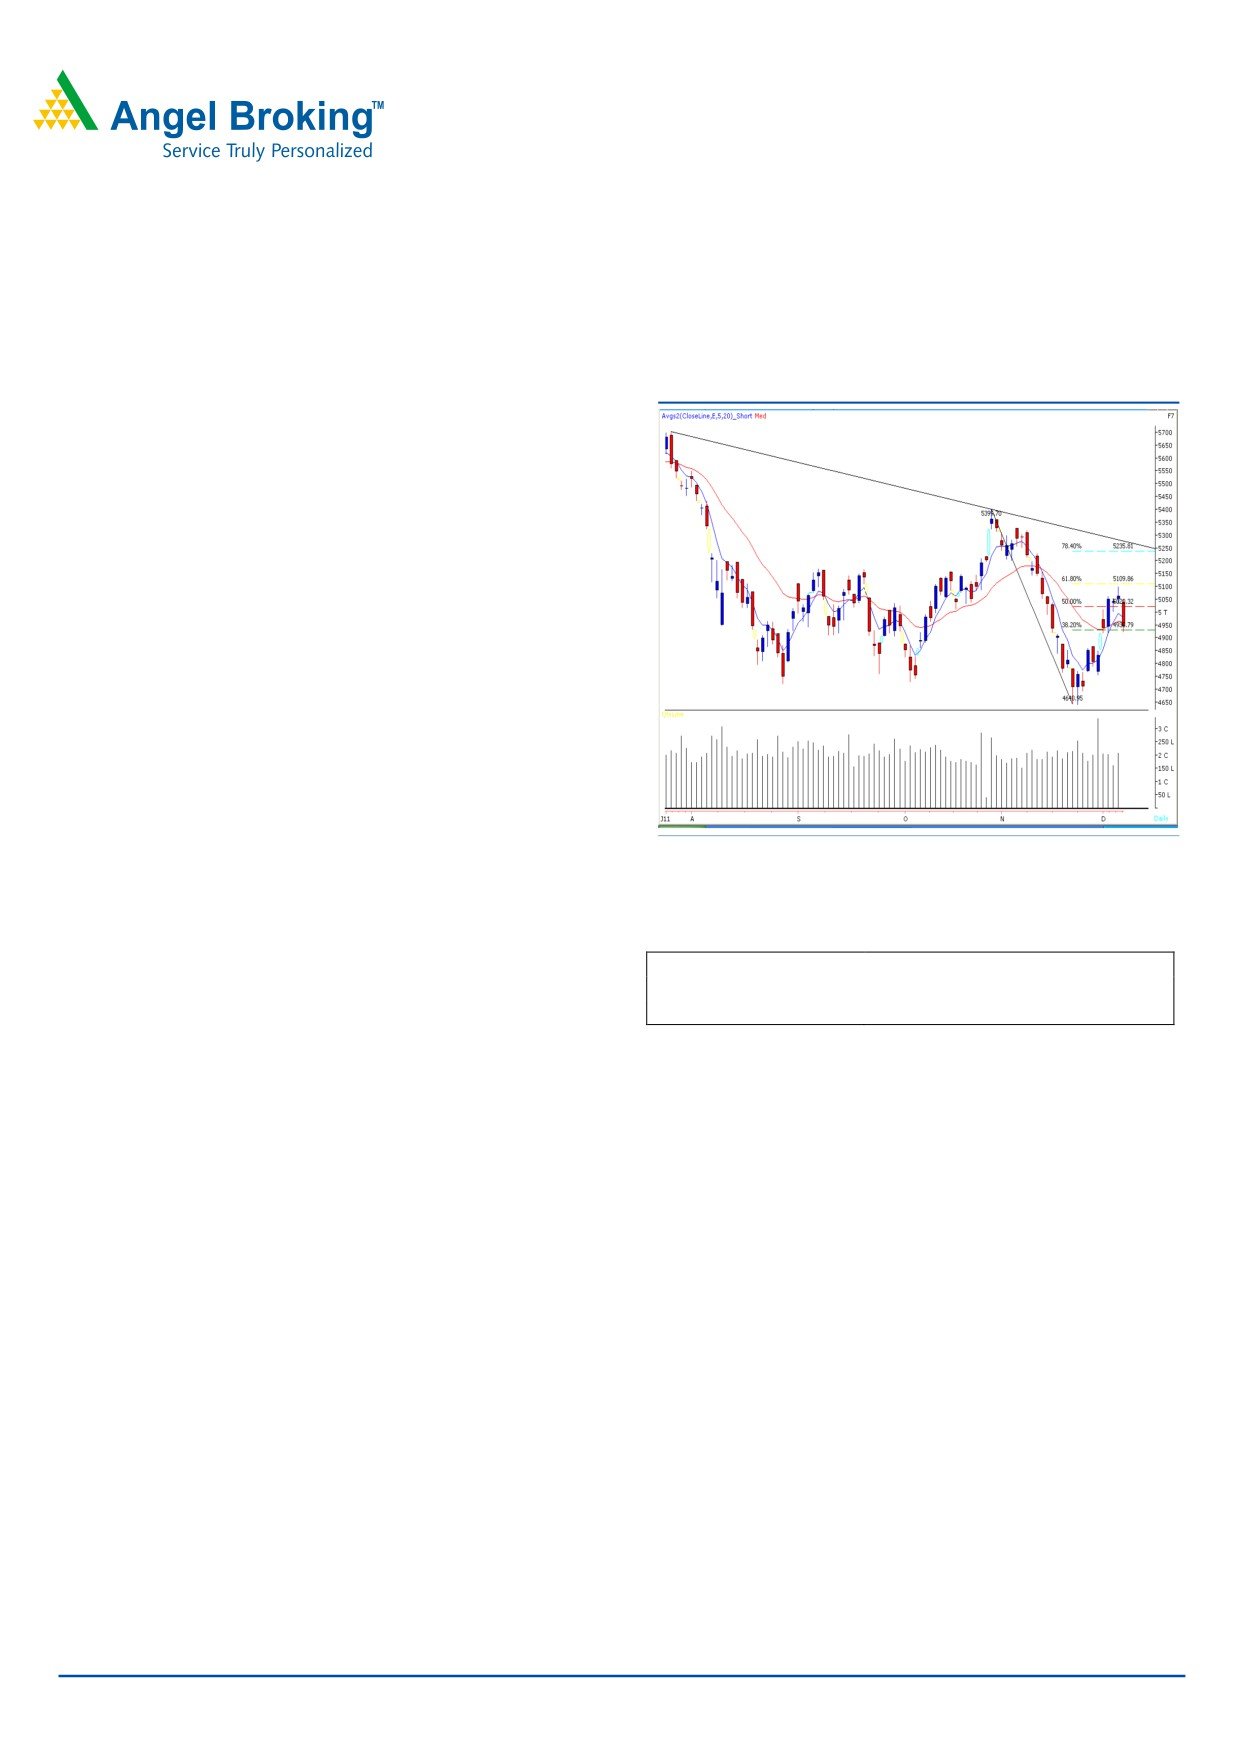
Sensex (16448) / NIFTY (4944)
Exhibit 1: Nifty Daily Chart
Yesterday markets opened with a minor downside gap and
breached previous day’s low of 16781 / 5032 during the
initial part of the session to close below 16500 / 4950
mark. On the sectoral front, Capital Goods, Realty and
Metal counters contributed heavily in yesterday’s sharp
correction. The advance decline ratio was strongly in favour
of declining counters. (A=842 D=1910). (Source
-
Formation
• The Weekly “20 EMA” is placed at 17000 / 5110 level.
• On the Daily chart, the 61.8% Fibonacci Retracement
level of the fall from 17908 to 15478 / 5400 to 4639 levels
is at 16980 / 5110 level.
Source: Falcon
Trading strategy:
Actionable points:
As mentioned in our earlier report, indices confirmed a
“Spinning Top” candlestick pattern after breaching
View
Neutral
Wednesday’s low of
16781 /
5032. As a result, we
Resistance levels
5032
witnessed strong selling pressure which dragged indices
Support level
4866 - 4754
sharply lower to test expected support level of 16530 /
4960. Considering the bearish global cues, it is likely that
our benchmarks Indices may open with a downward gap
and test the next support level at 15962 / 4866. A
sustainable move below this may attract further selling
pressure which would drag indices lower to test 15850 /
4754 level. On the upside, 16781 / 5032 is likely to act as
strong resistance in the coming trading sessions.
For Private Circulation Only |
1
Technical Research | December 09, 2011
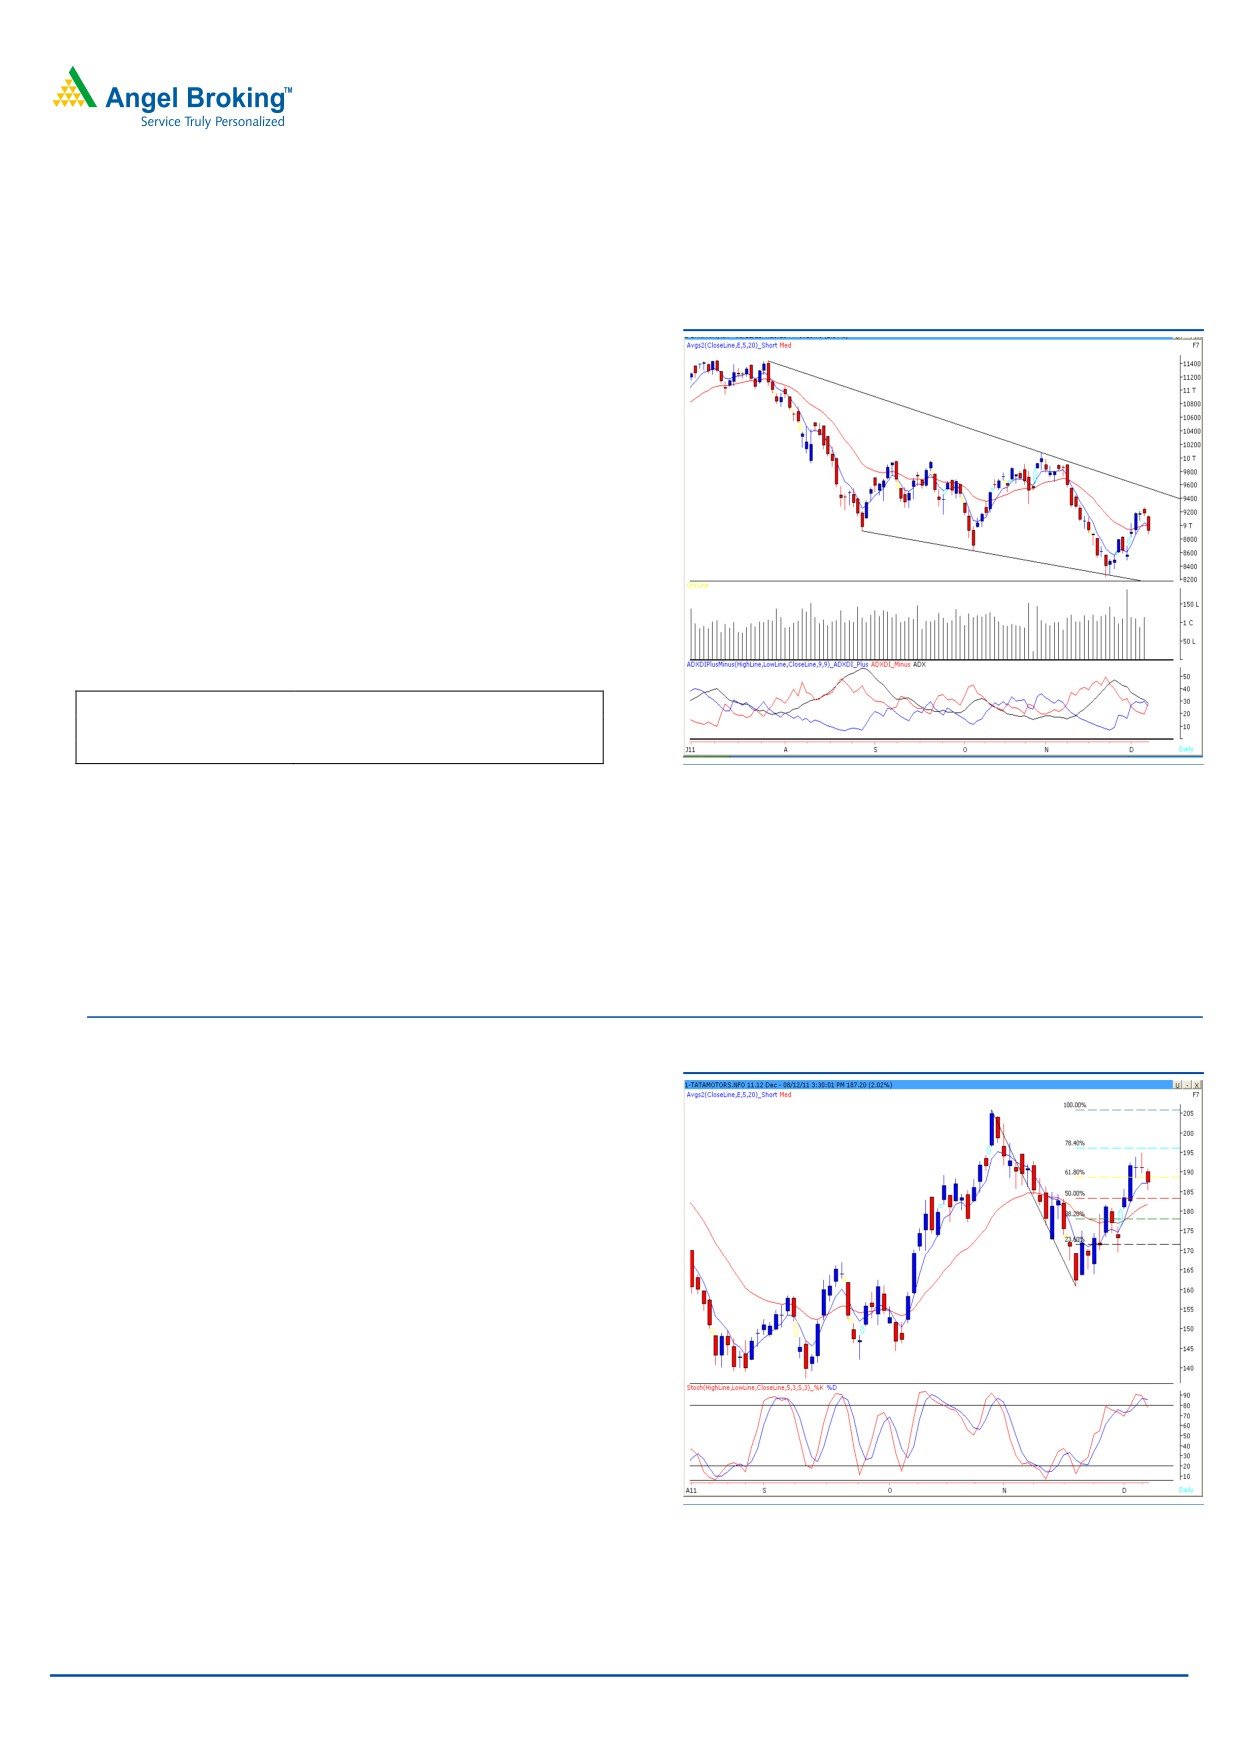
Bank Nifty Outlook - (8916)
Exhibit 2: Bank Nifty Daily Chart
Bank nifty opened on a pessimistic note and selling pressure
was clearly seen throughout the session. The momentum
oscillators on the daily chart are negatively poised. In
addition, we are observing a negative crossover in the daily
“ADX (9)” indicator which indicates further weakness. Thus,
if Bank Nifty sustains below yesterday’s low of 8871 then it is
likely to test 8756 - 8635 levels. On the upside, 9020 -
9085 levels are likely to act as resistance for the day.
Actionable points:
View
Neutral
Resistance level
9020 - 9085
Support levels
8756 - 8635
Source: Falcon
Stock Recommendations:
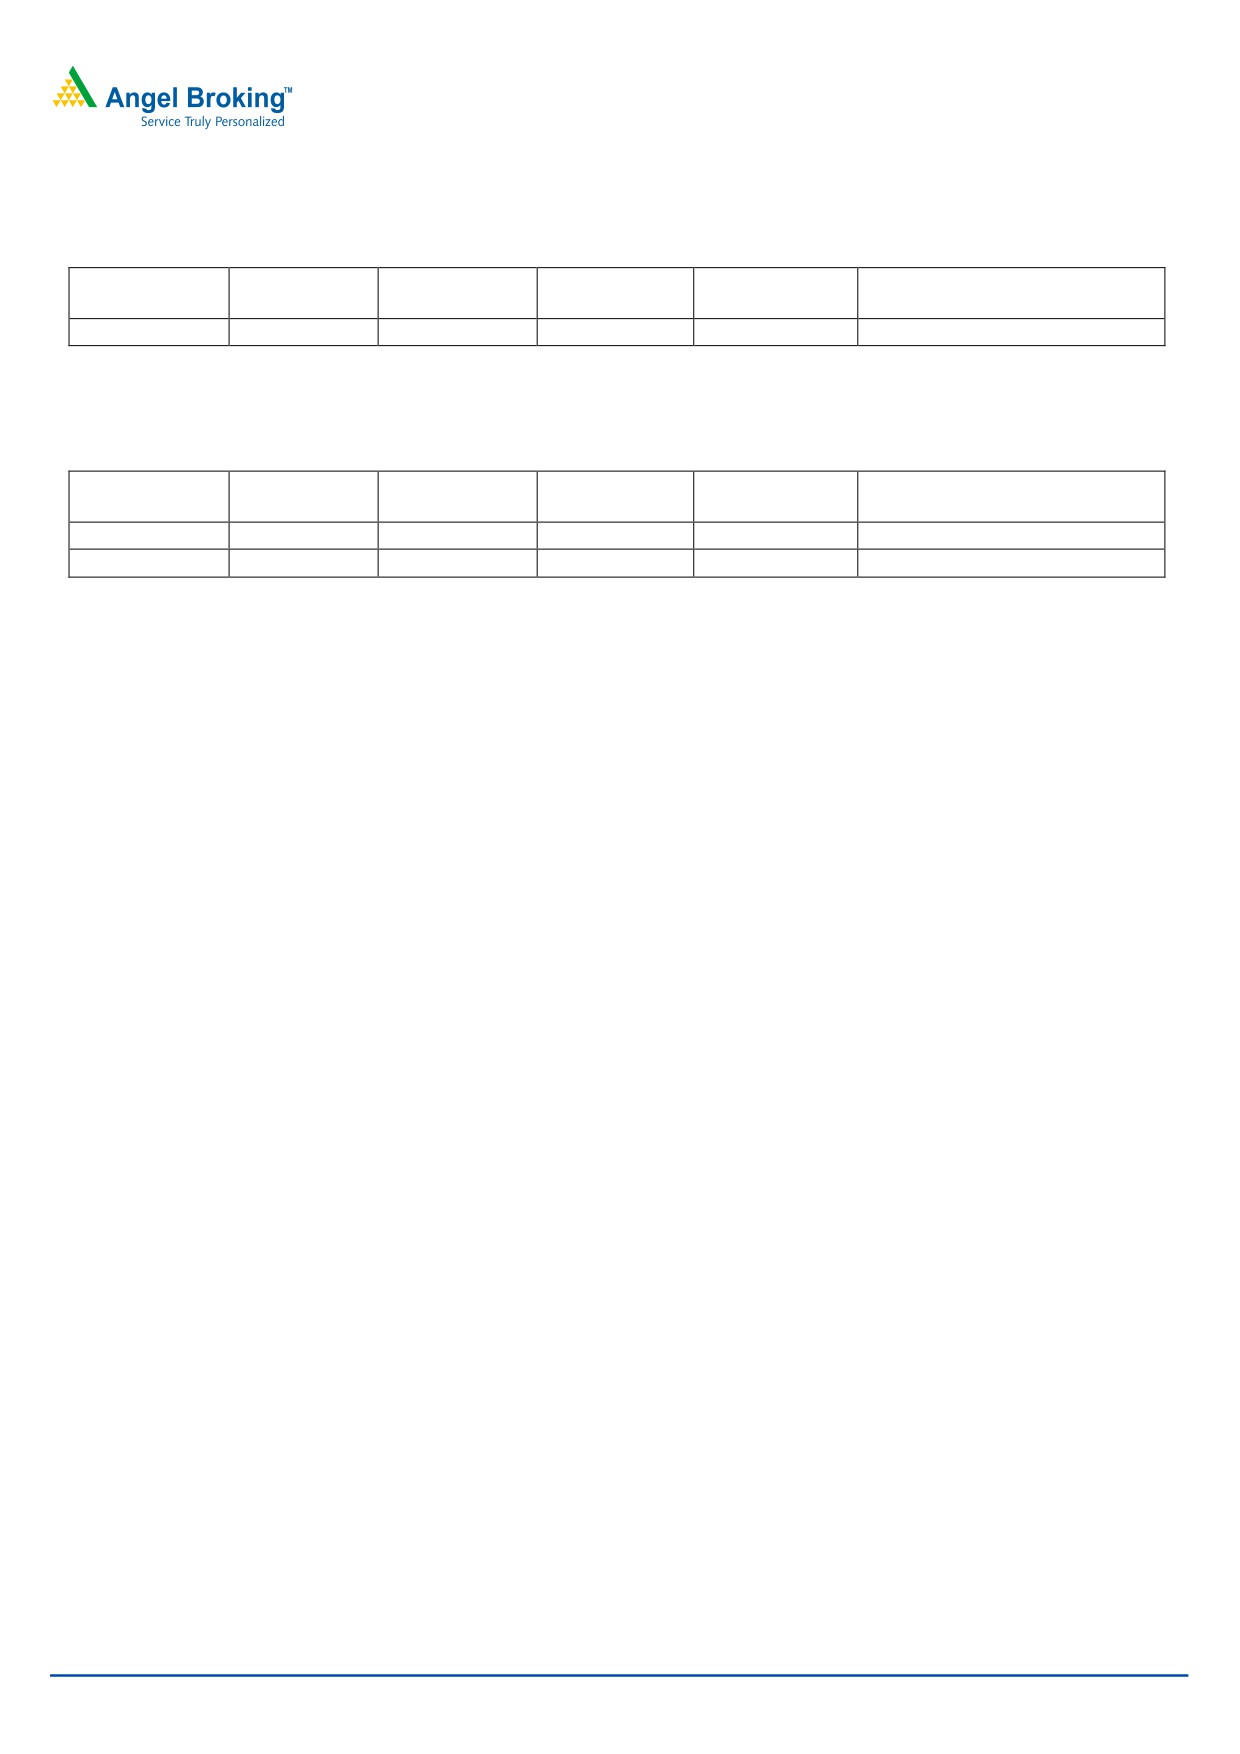
Exhibit 3: Tata Motors (December Futures)
Stock - Tata Motors (December Futures)
Action - Sell
Last close
` 187.20
Selling Range ` 188.20 - 188
Stop Loss
` 190.45
Target
` 183
Justification - On the daily chart, the stock has faced
resistance near 78.4% retracement of the fall from 205.80
- 160.85. In addition, the momentum oscillator on the daily
chart has given a fresh sell signal. We advise selling this
stock in a range of ` 188.20 to ` 188 for a target of ` 183
in coming 1 - 2 days.
Source: Falcon
For Private Circulation Only |
2
Technical Research | December 09, 2011
Positive Bias:
Expected
Stock Name
CMP
5 Day EMA
20 Day EMA
Remarks
Target
Cipla
328.2
327.4
316.9
340
View will change below 325
Negative Bias:
Expected
Stock Name
CMP
5 Day EMA
20 Day EMA
Remarks
Target
Yes Bank
287.2
287.5
283.6
275
View will change above 293
Techm
574.5
580
583.3
550
View will change above 595
For Private Circulation Only |
3
Technical Research | December 09, 2011
Daily Pivot Levels for Nifty 50 Stocks
SCRIPS
S2
S1
PIVOT
R1
R2
SENSEX
16,261
16,554
16,721
17,014
17,182
NIFTY
4,866
4,958
5,010
5,102
5,155
BANKNIFTY
8,737
8,955
9,078
9,296
9,419
ACC
1,152
1,183
1,201
1,232
1,250
AMBUJACEM
146
153
158
165
169
AXISBANK
948
977
995
1,023
1,041
BAJAJ-AUTO
1,663
1,689
1,704
1,730
1,746
BHARTIARTL
364
377
386
399
407
BHEL
267
275
279
287
292
BPCL
501
529
548
576
595
CAIRN
306
312
315
321
324
CIPLA
326
328
331
333
335
DLF
212
218
221
227
231
DRREDDY
1,511
1,544
1,564
1,597
1,618
GAIL
391
395
397
401
404
HCLTECH
392
405
412
424
432
HDFC
649
659
664
673
678
HDFCBANK
448
457
462
472
477
HEROMOTOCO
2,029
2,055
2,082
2,108
2,135
HINDALCO
126
131
134
138
142
HINDUNILVR
389
392
395
398
401
ICICIBANK
745
767
779
800
813
IDFC
106
111
114
119
122
INFY
2,618
2,656
2,686
2,724
2,753
ITC
201
204
205
208
210
JINDALSTEL
503
518
529
544
555
JPASSOCIAT
63
65
66
69
70
KOTAKBANK
467
481
490
504
512
LT
1,265
1,288
1,301
1,324
1,337
M&M
710
730
741
761
772
MARUTI
950
971
984
1,005
1,018
NTPC
162
167
171
176
180
ONGC
258
263
266
271
275
PNB
878
897
909
928
940
POWERGRID
98
101
102
105
107
RANBAXY
426
434
440
448
454
RCOM
73
75
77
79
80
RELCAPITAL
286
294
299
307
311
RELIANCE
776
794
805
823
833
RELINFRA
397
405
410
418
423
RPOWER
86
88
89
92
93
SAIL
83
85
87
88
90
SBIN
1,765
1,826
1,863
1,923
1,960
SESAGOA
181
186
189
194
198
SIEMENS
685
704
717
736
749
STER
101
105
108
112
115
SUNPHARMA
511
522
530
541
549
SUZLON
23
23
24
24
25
TATAMOTORS
178
185
189
196
200
TATAPOWER
88
93
97
102
105
TATASTEEL
387
403
413
429
439
TCS
1,109
1,143
1,164
1,199
1,220
WIPRO
369
381
390
402
411
Technical Research Team
For Private Circulation Only |
4
Technical Report
RESEARCH TEAM
Shardul Kulkarni
Head - Technicals
Sameet Chavan
Technical Analyst
Sacchitanand Uttekar
Technical Analyst
Mehul Kothari
Technical Analyst
Ankur Lakhotia
Technical Analyst
Research Team: 022-3952 6600
DISCLAIMER: This document is not for public distribution and has been furnished to you solely for your information and must not
be reproduced or redistributed to any other person. Persons into whose possession this document may come are required to observe
these restrictions.
Opinion expressed is our current opinion as of the date appearing on this material only. While we endeavor to update on a
reasonable basis the information discussed in this material, there may be regulatory, compliance, or other reasons that prevent us
from doing so. Prospective investors and others are cautioned that any forward-looking statements are not predictions and may be
subject to change without notice. Our proprietary trading and investment businesses may make investment decisions that are
inconsistent with the recommendations expressed herein.
The information in this document has been printed on the basis of publicly available information, internal data and other reliable
sources believed to be true and are for general guidance only. While every effort is made to ensure the accuracy and completeness of
information contained, the company takes no guarantee and assumes no liability for any errors or omissions of the information. No
one can use the information as the basis for any claim, demand or cause of action.
Recipients of this material should rely on their own investigations and take their own professional advice. Each recipient of this
document should make such investigations as it deems necessary to arrive at an independent evaluation of an investment in the
securities of companies referred to in this document (including the merits and risks involved), and should consult their own advisors to
determine the merits and risks of such an investment. Price and value of the investments referred to in this material may go up or
down. Past performance is not a guide for future performance. Certain transactions - futures, options and other derivatives as well as
non-investment grade securities - involve substantial risks and are not suitable for all investors. Reports based on technical analysis
centers on studying charts of a stock's price movement and trading volume, as opposed to focusing on a company's fundamentals
and as such, may not match with a report on a company's fundamentals.
We do not undertake to advise you as to any change of our views expressed in this document. While we would endeavor to update
the information herein on a reasonable basis, Angel Broking, its subsidiaries and associated companies, their directors and
employees are under no obligation to update or keep the information current. Also there may be regulatory, compliance, or other
reasons that may prevent Angel Broking and affiliates from doing so. Prospective investors and others are cautioned that any
forward-looking statements are not predictions and may be subject to change without notice.
Angel Broking Limited and affiliates, including the analyst who has issued this report, may, on the date of this report, and from time
to time, have long or short positions in, and buy or sell the securities of the companies mentioned herein or engage in any other
transaction involving such securities and earn brokerage or compensation or act as advisor or have other potential conflict of interest
with respect to company/ies mentioned herein or inconsistent with any recommendation and related information and opinions.
Angel Broking Limited and affiliates may seek to provide or have engaged in providing corporate finance, investment banking or
other advisory services in a merger or specific transaction to the companies referred to in this report, as on the date of this report or
in the past.
Sebi Registration No : INB 010996539
For Private Circulation Only |