Daily Technical Report
July 09, 2012
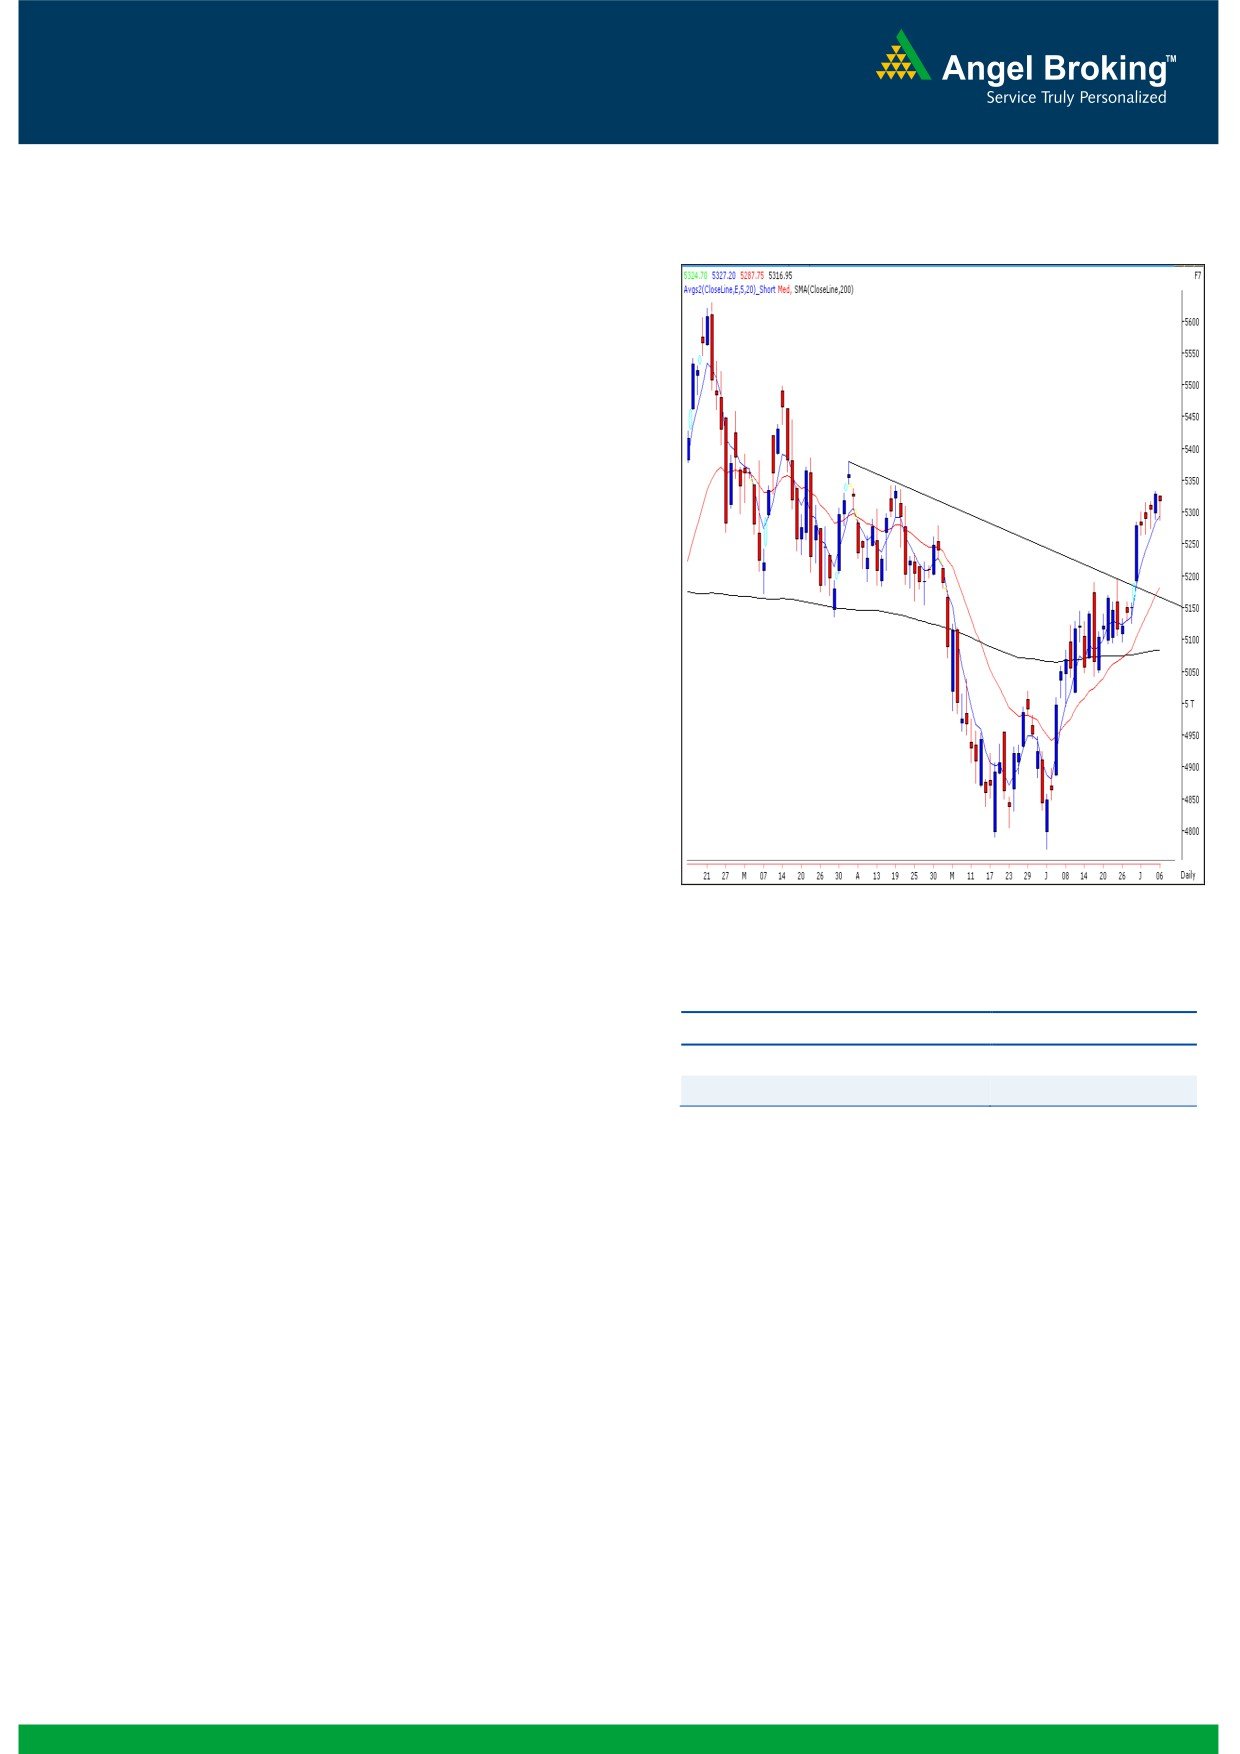
Exhibit 1: Nifty Daily Chart
Sensex (17521) / NIFTY (5317)
On Friday, once again our benchmark indices traded
in a narrow range throughout the day and closed flat
for the fifth consecutive session. On sectoral front,
FMCG and Banking counters were marginally
positive; whereas Realty, Metal and Consumer
Durables sectors were the biggest losers. The advance
to decline ratio was strongly in favor of advancing
counters
(A=1542
D=971)
(Source
-
Formation
The 200-day SMA (Simple Moving Average) is
placed at 16824 / 5083 level.
Markets have taken support at the Monthly
‘Upward Sloping Trend Line’ and have formed a
‘Bullish Engulfing’ Pattern.
We are witnessing a narrow range body
formation near 61.8% Fibonacci retracement of
the fall from 18524 / 5630 (February 22, 2012)
- 15749 / 4770 (June 4, 2012). This level is at
Source: Falcon
17464 / 5302.
On the weekly chart we are witnessing a
Actionable points:
“Downward Sloping Trend Line” resistance near
17780 / 5420 formed by joining the highs of
View
Neutral
21109 / 6339 (November 5, 2010) - 18524 /
Resistance Levels
5340 - 5386
5630 (February 24, 2012).
Support Levels
5263 - 5240
Trading strategy:
However this pullback should be treated as a normal
After the much-awaited breakout above 5200 mark in
corrective move and not as reversal of existing
the previous week, we witnessed a range bound
uptrend. A sustainable move below 17350 / 5260
activity for 5 consecutive sessions. A series of narrow
level would indicate short term loss of momentum
range body formations on the daily chart indicates
and indices may drift towards the gap area formed in
strong consolidation for the Indices. On weekly chart
last Friday’s session (17135 - 16919 / 5189 - 5159
we are observing that the indices are hovering around
levels). These levels also coincide with the “20- Day
61.8% Fibonacci retracement of the fall from 18524 /
EMA”. On the flip side a close above 17570 - 5340
5630 (February 22, 2012) - 15749 / 4770 (June 4,
would activate fresh momentum on the upside. In this
2012). This level is at 17464 / 5302. The weekly ‘RSI-
case the indices are likely to rally towards the
Smoothened’ oscillator and positive crossover in ‘5 &
“Downward Sloping Trend line” formed by joining
20 EMA’ are still intact. However, due to overbought
the highs of 21109 / 6339 (November 5, 2010) -
nature of momentum oscillators “RSI” and
18524 / 5630 (February 24, 2012) which is placed
“Stochastic” on the daily chart, some consolidation or
at 17780 / 5420 level. Positional traders holding
minor pullback is likely in the early part of the coming
long positions in Nifty should place a trailing stop
week.
loss at 5090 (Nifty spot).
1
Daily Technical Report
July 09, 2012
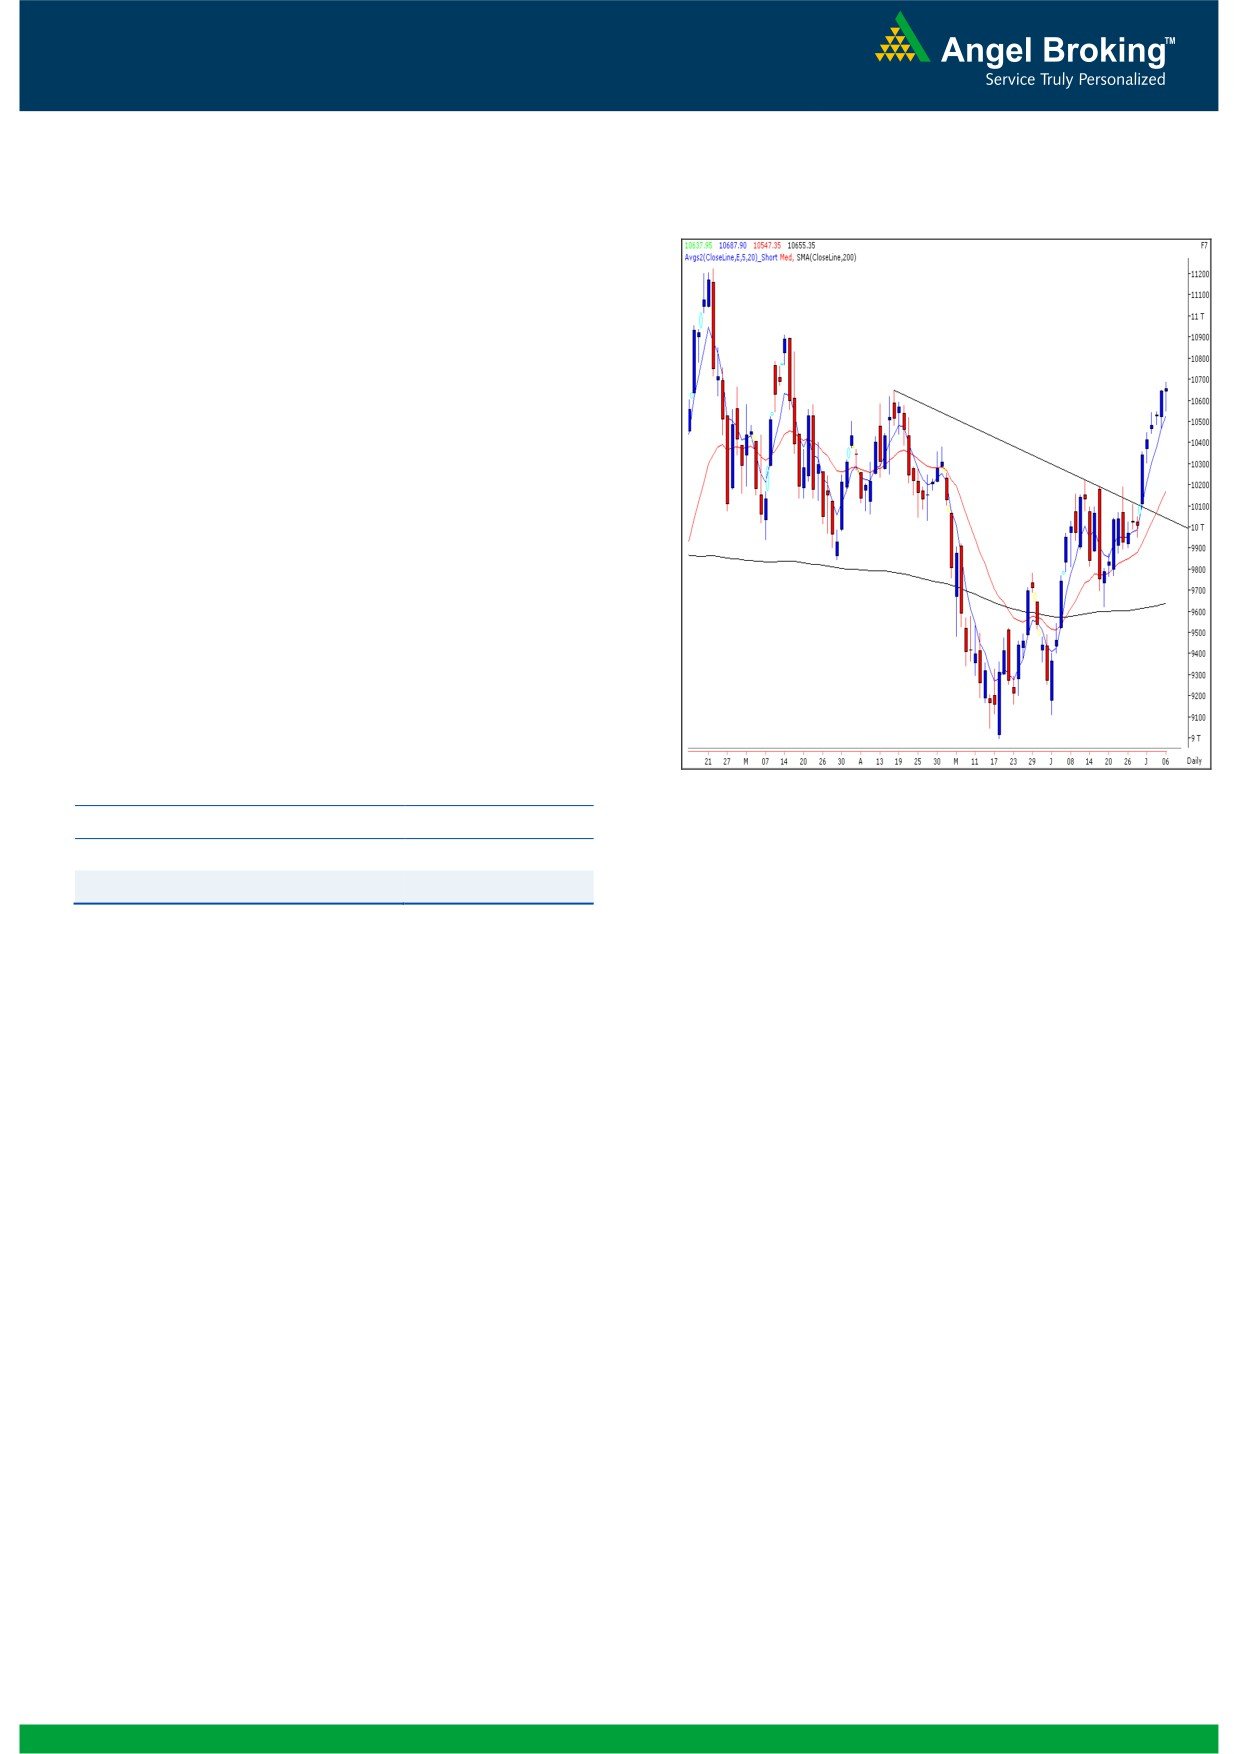
Exhibit 2: Bank Nifty Daily Chart
Bank Nifty Outlook - (10655)
On Friday, Bank Nifty opened on an optimistic note
and traded in a narrow range to close near the initial
opening level. We are now witnessing a negative
divergence in “RSI” momentum oscillator on the
hourly chart, coupled with “overbought” conditions of
the momentum oscillators on the daily chart. Hence in
the coming sessions a chance of minor pullback /
consolidation cannot be ruled out. However,
considering a larger time frame we continue to
remain optimistic on the index and the bullish view
would change only if the index closes below 10050.
For the day, 10740 - 10830 levels are likely to act as
resistance and 10545 - 10444 levels are likely to act
as support. Positional traders holding long positions
are advised to trail their stop loss of 10050 level
(Closing basis) on Bank Nifty spot.
Actionable points:
Source: Falcon
View
Neutral
Resistance Levels
10651 - 10740
Support Levels
10523 - 10480
2
Daily Technical Report
July 09, 2012
Daily Pivot Levels for Nifty 50 Stocks
SCRIPS
S2
S1
PIVOT
R1
R2
SENSEX
17,371
17,446
17,500
17,575
17,629
NIFTY
5,271
5,294
5,311
5,334
5,350
BANKNIFTY
10,490
10,573
10,630
10,713
10,771
ACC
1,275
1,286
1,298
1,308
1,320
AMBUJACEM
169
171
174
176
178
ASIANPAINT
3,627
3,671
3,724
3,768
3,821
AXISBANK
1,018
1,028
1,038
1,047
1,057
BAJAJ-AUTO
1,513
1,526
1,544
1,557
1,575
BANKBARODA
711
719
728
736
744
BHARTIARTL
316
319
322
325
328
BHEL
231
234
235
238
240
BPCL
748
756
765
773
782
CAIRN
311
313
315
317
319
CIPLA
319
324
327
331
334
COALINDIA
344
348
351
355
358
DLF
207
209
212
214
216
DRREDDY
1,603
1,619
1,630
1,646
1,657
GAIL
350
354
357
360
364
GRASIM
2,636
2,657
2,678
2,698
2,719
HCLTECH
478
484
489
495
499
HDFC
672
678
682
688
692
HDFCBANK
573
577
583
588
594
HEROMOTOCO
2,036
2,059
2,096
2,119
2,155
HINDALCO
121
123
124
126
127
HINDUNILVR
438
442
445
449
452
ICICIBANK
902
918
928
945
955
IDFC
138
140
141
144
145
INFY
2,412
2,428
2,457
2,473
2,502
ITC
247
250
252
255
256
JINDALSTEL
445
450
458
463
471
JPASSOCIAT
76
76
77
78
79
KOTAKBANK
587
595
601
609
615
LT
1,381
1,393
1,410
1,422
1,439
M&M
718
725
729
736
740
MARUTI
1,193
1,204
1,223
1,235
1,254
NTPC
159
160
161
162
163
ONGC
271
275
277
281
284
PNB
823
832
839
849
856
POWERGRID
111
112
113
114
116
RANBAXY
495
500
507
512
519
RELIANCE
726
730
734
739
743
RELINFRA
557
564
570
577
583
SAIL
93
94
94
95
96
SBIN
2,191
2,207
2,221
2,237
2,251
SESAGOA
194
196
199
201
204
SIEMENS
722
728
733
739
744
STER
105
106
108
109
111
SUNPHARMA
628
631
633
637
639
TATAMOTORS
234
237
241
244
247
TATAPOWER
101
102
104
105
107
TATASTEEL
440
444
448
452
455
TCS
1,217
1,232
1,243
1,258
1,268
WIPRO
386
389
392
395
398
3
Daily Technical Report
July 09, 2012
Research Team Tel: 022 - 39357800
DISCLAIMER
This document is solely for the personal information of the recipient, and must not be singularly used as the basis of any investment
decision. Nothing in this document should be construed as investment or financial advice. Each recipient of this document should make
such investigations as they deem necessary to arrive at an independent evaluation of an investment in the securities of the companies
referred to in this document (including the merits and risks involved), and should consult their own advisors to determine the merits and
risks of such an investment.
Angel Broking Limited, its affiliates, directors, its proprietary trading and investment businesses may, from time to time, make
investment decisions that are inconsistent with or contradictory to the recommendations expressed herein. The views contained in this
document are those of the analyst, and the company may or may not subscribe to all the views expressed within.
Reports based on technical and derivative analysis center on studying charts of a stock's price movement, outstanding positions and
trading volume, as opposed to focusing on a company's fundamentals and, as such, may not match with a report on a company's
fundamentals.
The information in this document has been printed on the basis of publicly available information, internal data and other reliable
sources believed to be true, but we do not represent that it is accurate or complete and it should not be relied on as such, as this
document is for general guidance only. Angel Broking Limited or any of its affiliates/ group companies shall not be in any way
responsible for any loss or damage that may arise to any person from any inadvertent error in the information contained in this report.
Angel Broking Limited has not independently verified all the information contained within this document. Accordingly, we cannot testify,
nor make any representation or warranty, express or implied, to the accuracy, contents or data contained within this document. While
Angel Broking Limited endeavours to update on a reasonable basis the information discussed in this material, there may be regulatory,
compliance, or other reasons that prevent us from doing so.
This document is being supplied to you solely for your information, and its contents, information or data may not be reproduced,
redistributed or passed on, directly or indirectly.
Angel Broking Limited and its affiliates may seek to provide or have engaged in providing corporate finance, investment banking or
other advisory services in a merger or specific transaction to the companies referred to in this report, as on the date of this report or in
the past.
Neither Angel Broking Limited, nor its directors, employees or affiliates shall be liable for any loss or damage that may arise from or in
connection with the use of this information.
Note: Please refer to the important `Stock Holding Disclosure' report on the Angel website (Research Section). Also, please refer to the
latest update on respective stocks for the disclosure status in respect of those stocks. Angel Broking Limited and its affiliates may have
investment positions in the stocks recommended in this report.
Research Team
Shardul Kulkarni
-
Head - Technicals
Sameet Chavan
-
Technical Analyst
Sacchitanand Uttekar
-
Technical Analyst
Mehul Kothari
-
Technical Analyst
Ankur Lakhotia
-
Technical Analyst
Angel Broking Pvt. Ltd.
Registered Office: G-1, Ackruti Trade Centre, Rd. No. 7, MIDC, Andheri (E), Mumbai - 400 093.
Corporate Office: 6th Floor, Ackruti Star, MIDC, Andheri (E), Mumbai - 400 093. Tel: (022) 3952 6600
Sebi Registration No: INB 010996539
4