Daily Technical Report
May 09, 2012
Sensex (16546) / NIFTY (5000)
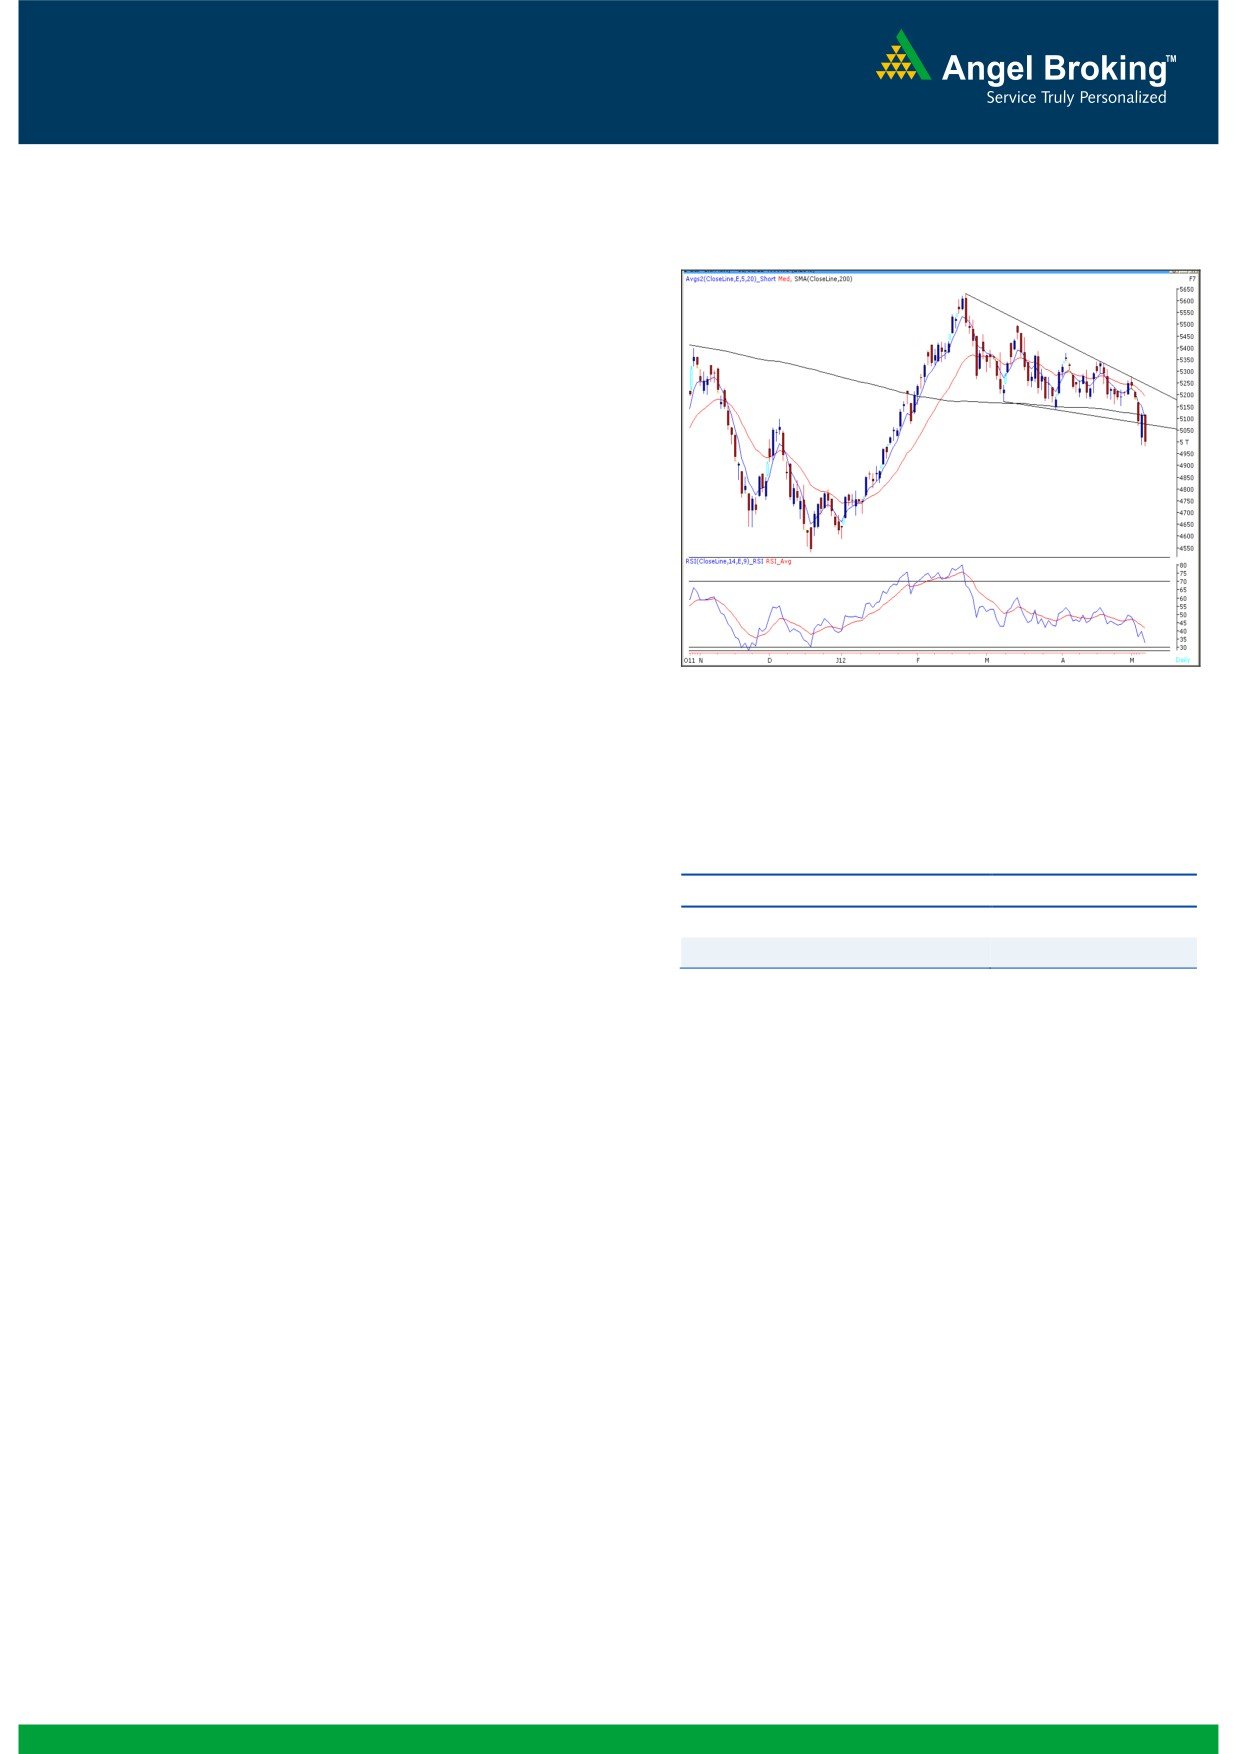
Exhibit 1: Nifty Daily Chart
Yesterday markets opened on a flat note in-line with
other Asian indices, after a sharp bounce back on
Monday’s session. However, intense selling pressure
on the back of negative sentiment in European
markets led to a close almost at the lowest point of
the day. All sectors corrected sharply during
yesterday’s session. Stocks in the Capital Goods, IT
and Banking space were among the major losers. The
advance to decline ratio was strongly in favor of
declining counters (A=1052 D=1688) (Source
-
Formation
Source: Falcon
The 200-day SMA (Simple Moving Average) and
20-day EMA (Exponential Moving Average) have
now shifted to 16949 / 5115 and 17220 /
5225, respectively.
We are now witnessing a negative crossover in
weekly ‘5 & 20 EMA’.
Actionable points:
View
Neutral
Trading strategy:
Resistance Levels
5125
After seeing a sharp pull back towards 5100 mark on
Support Levels
4988 - 4950 - 4900
Monday’s session, once again markets lost positive
momentum and corrected to close around the 5000
mark. Going forward, Tuesday’s high of 16945 /
5125 level would act as a strong resistance zone. This
level also coincides with the 200 day SMA and thus as
long as indices stay below 16945 / 5125, we are
likely to trade with negative bias. On the downside,
indices may slide towards 16430 / 4950 level if
markets sustain below yesterday’s low of 16502 /
4983. We advise traders to avoid creating fresh long
or short positions.
1
Daily Technical Report
May 09, 2012
Bank Nifty Outlook - (9589)
Yesterday, Bank Nifty opened on a flat note and
Exhibit 2: Bank Nifty Daily Chart
traded in a narrow range during the first half of the
session. However in the second half, in line with the
sell-off in the broader market, the index fell and
closed well below the “200 - day SMA” support level.
As mentioned in our previous report that we witnessed
immense volatility throughout the session. Going
forward, Monday’s low of 9480 might provide decent
support to the index. A move and close below 9480
will further intensify the selling pressure and the index
may drift lower to test 9364 - 9270 levels. On the
upside 9780 - 9897 are likely to as resistance in
coming trading session.
Actionable points:
View
Neutral
Support Levels
9480 - 9364
Resistance Levels
9780 - 9897
Source: Falcon
2
Daily Technical Report
May 09, 2012
Research Team Tel: 022 - 39357800
DISCLAIMER
This document is solely for the personal information of the recipient, and must not be singularly used as the basis of any investment
decision. Nothing in this document should be construed as investment or financial advice. Each recipient of this document should make
such investigations as they deem necessary to arrive at an independent evaluation of an investment in the securities of the companies
referred to in this document (including the merits and risks involved), and should consult their own advisors to determine the merits and
risks of such an investment.
Angel Broking Limited, its affiliates, directors, its proprietary trading and investment businesses may, from time to time, make
investment decisions that are inconsistent with or contradictory to the recommendations expressed herein. The views contained in this
document are those of the analyst, and the company may or may not subscribe to all the views expressed within.
Reports based on technical and derivative analysis center on studying charts of a stock's price movement, outstanding positions and
trading volume, as opposed to focusing on a company's fundamentals and, as such, may not match with a report on a company's
fundamentals.
The information in this document has been printed on the basis of publicly available information, internal data and other reliable
sources believed to be true, but we do not represent that it is accurate or complete and it should not be relied on as such, as this
document is for general guidance only. Angel Broking Limited or any of its affiliates/ group companies shall not be in any way
responsible for any loss or damage that may arise to any person from any inadvertent error in the information contained in this report.
Angel Broking Limited has not independently verified all the information contained within this document. Accordingly, we cannot testify,
nor make any representation or warranty, express or implied, to the accuracy, contents or data contained within this document. While
Angel Broking Limited endeavours to update on a reasonable basis the information discussed in this material, there may be regulatory,
compliance, or other reasons that prevent us from doing so.
This document is being supplied to you solely for your information, and its contents, information or data may not be reproduced,
redistributed or passed on, directly or indirectly.
Angel Broking Limited and its affiliates may seek to provide or have engaged in providing corporate finance, investment banking or
other advisory services in a merger or specific transaction to the companies referred to in this report, as on the date of this report or in
the past.
Neither Angel Broking Limited, nor its directors, employees or affiliates shall be liable for any loss or damage that may arise from or in
connection with the use of this information.
Note: Please refer to the important `Stock Holding Disclosure' report on the Angel website (Research Section). Also, please refer to the
latest update on respective stocks for the disclosure status in respect of those stocks. Angel Broking Limited and its affiliates may have
investment positions in the stocks recommended in this report.
Research Team
Shardul Kulkarni
-
Head - Technicals
Sameet Chavan
-
Technical Analyst
Sacchitanand Uttekar
-
Technical Analyst
Mehul Kothari
-
Technical Analyst
Ankur Lakhotia
-
Technical Analyst
Angel Broking Pvt. Ltd.
Registered Office: G-1, Ackruti Trade Centre, Rd. No. 7, MIDC, Andheri (E), Mumbai - 400 093.
Corporate Office: 6th Floor, Ackruti Star, MIDC, Andheri (E), Mumbai - 400 093. Tel: (022) 3952 6600
Sebi Registration No: INB 010996539
4