Technical Research | April 09, 2012
Daily Technical Report
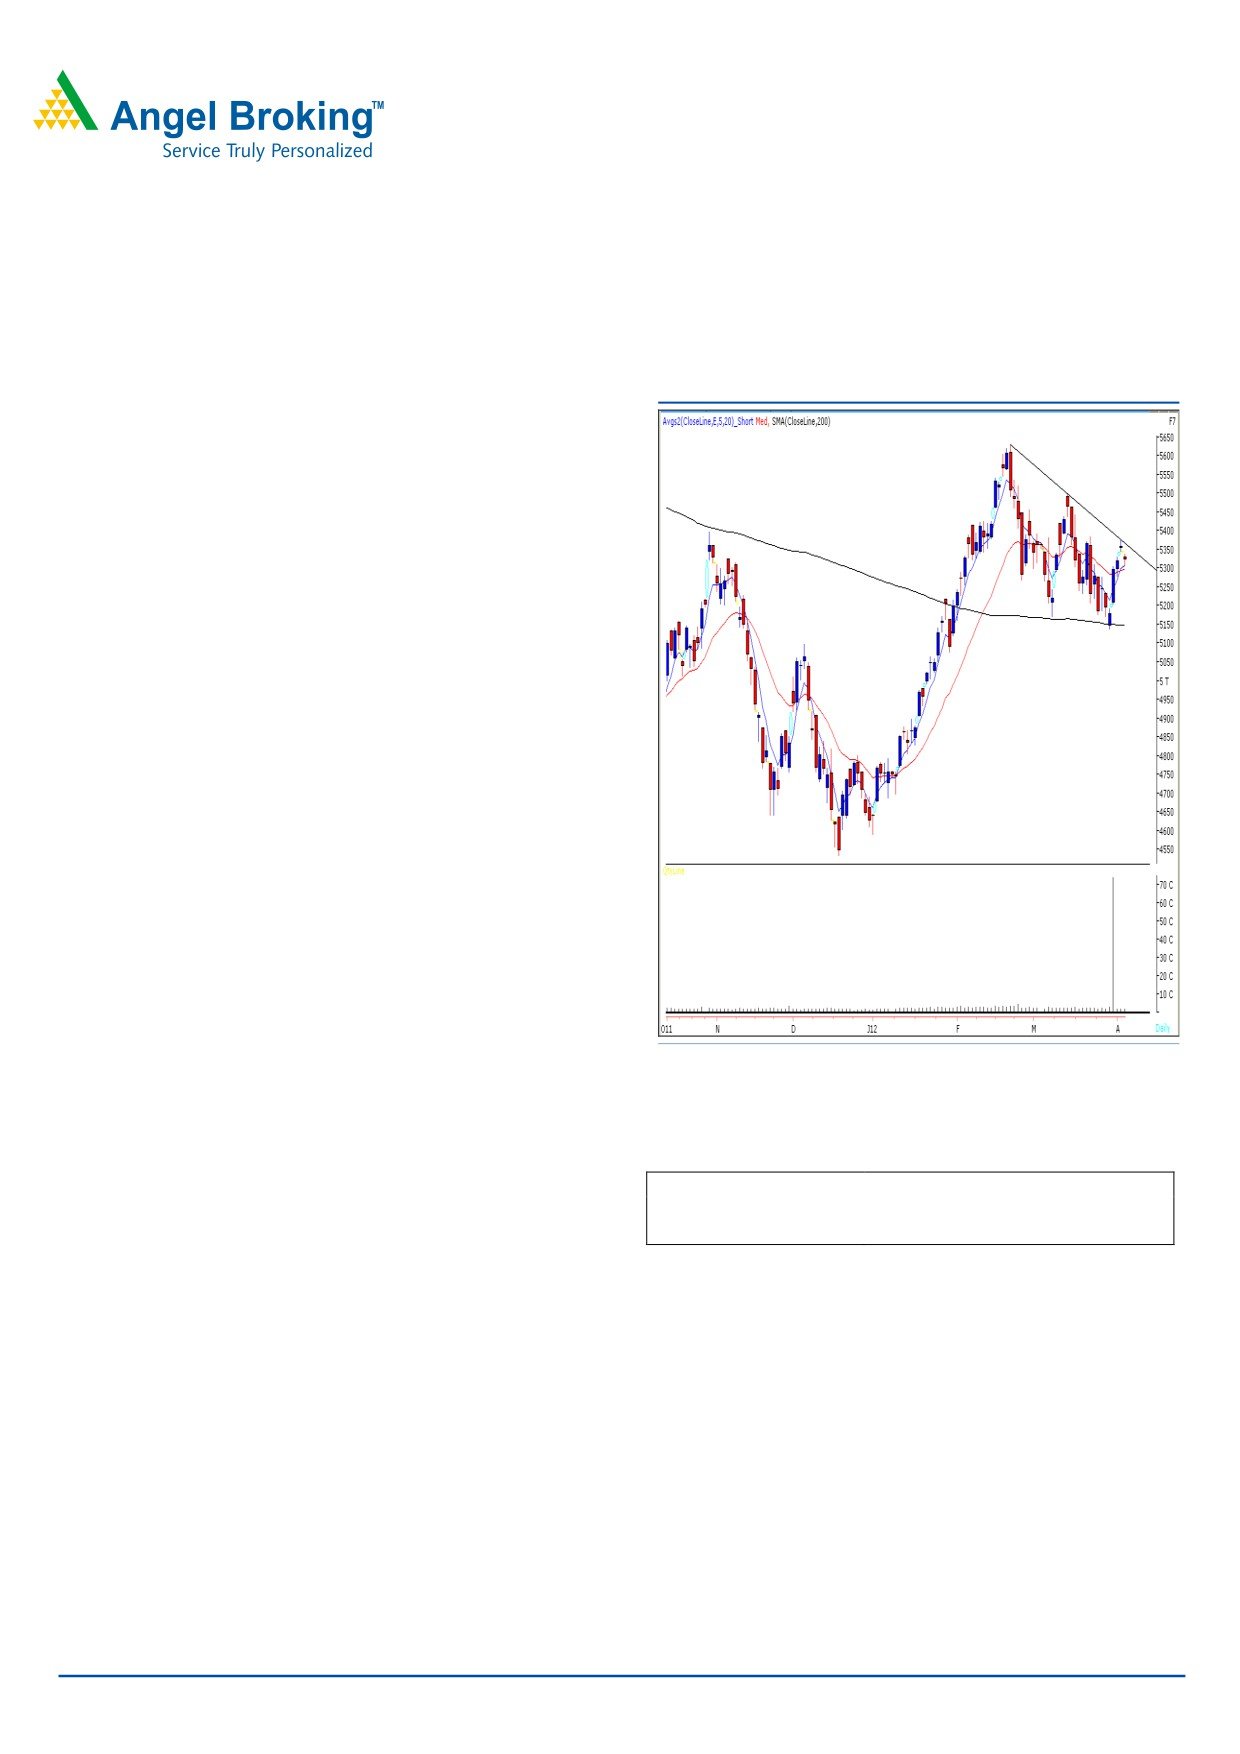
Sensex (17486) / NIFTY (5323)
Exhibit 1: Nifty Daily Chart
On Wednesday April 04, 2012, our benchmark indices
opened with a minor downside gap and traded in a narrow
range throughout the day to close in red. Our indices
almost tested the mentioned support level of 17420 / 5300
and managed to close above the same. On sectoral front,
Realty, Metal and Banking counters were among the major
losers, whereas Power and Consumer durables ended with
a nominal gain. The advance to decline ratio was
marginally in favour of advancing counters (A=1446
Formation:
• The 200-day SMA (Simple Moving Average) and 20-
day EMA (Exponential Moving Average) have now shifted to
17100 / 5150 and 17400 / 5300, respectively.
• The ‘20-Week EMA’ is placed at 17200 / 5200 level.
• The positive crossover in daily ‘RSI-smoothened’
oscillator is still intact.
• We are witnessing a ‘Downward Sloping Trend Line’
Source: Falcon
resistance around 17630 / 5365 level.
Actionable points:
Trading strategy:
View
Neutral
We have witnessed a small trading range during the
Resistance Levels
5340 - 5380
truncated week. On account of public holidays,
Support Levels
5300 - 5278
participation in the market was lower and volumes were
below average. As expected, after crossing last week’s high
Conversely, indices may face selling pressure only if the
of 17440 / 5307, indices moved towards the ‘Downward
support level of 17382 / 5278 is breached. In this case,
Sloping Trend Line’ resistance level of 17630 / 5365.
indices may slide towards the next support zone of 17105 -
Going forward, 17664 / 5379 is likely to act as an
16920 / 5203 - 5135 levels.
immediate resistance level. The positive momentum is likely
to resume after crossing this resistance and would lead to a
break out from the mentioned ‘Downward Trend Line’
resistance. In this scenario, we may witness a rally with
enhanced positive momentum to test 18041 - 18250 /
5500 - 5540 levels.
For Private Circulation Only |
1
Technical Research | April 09, 2012
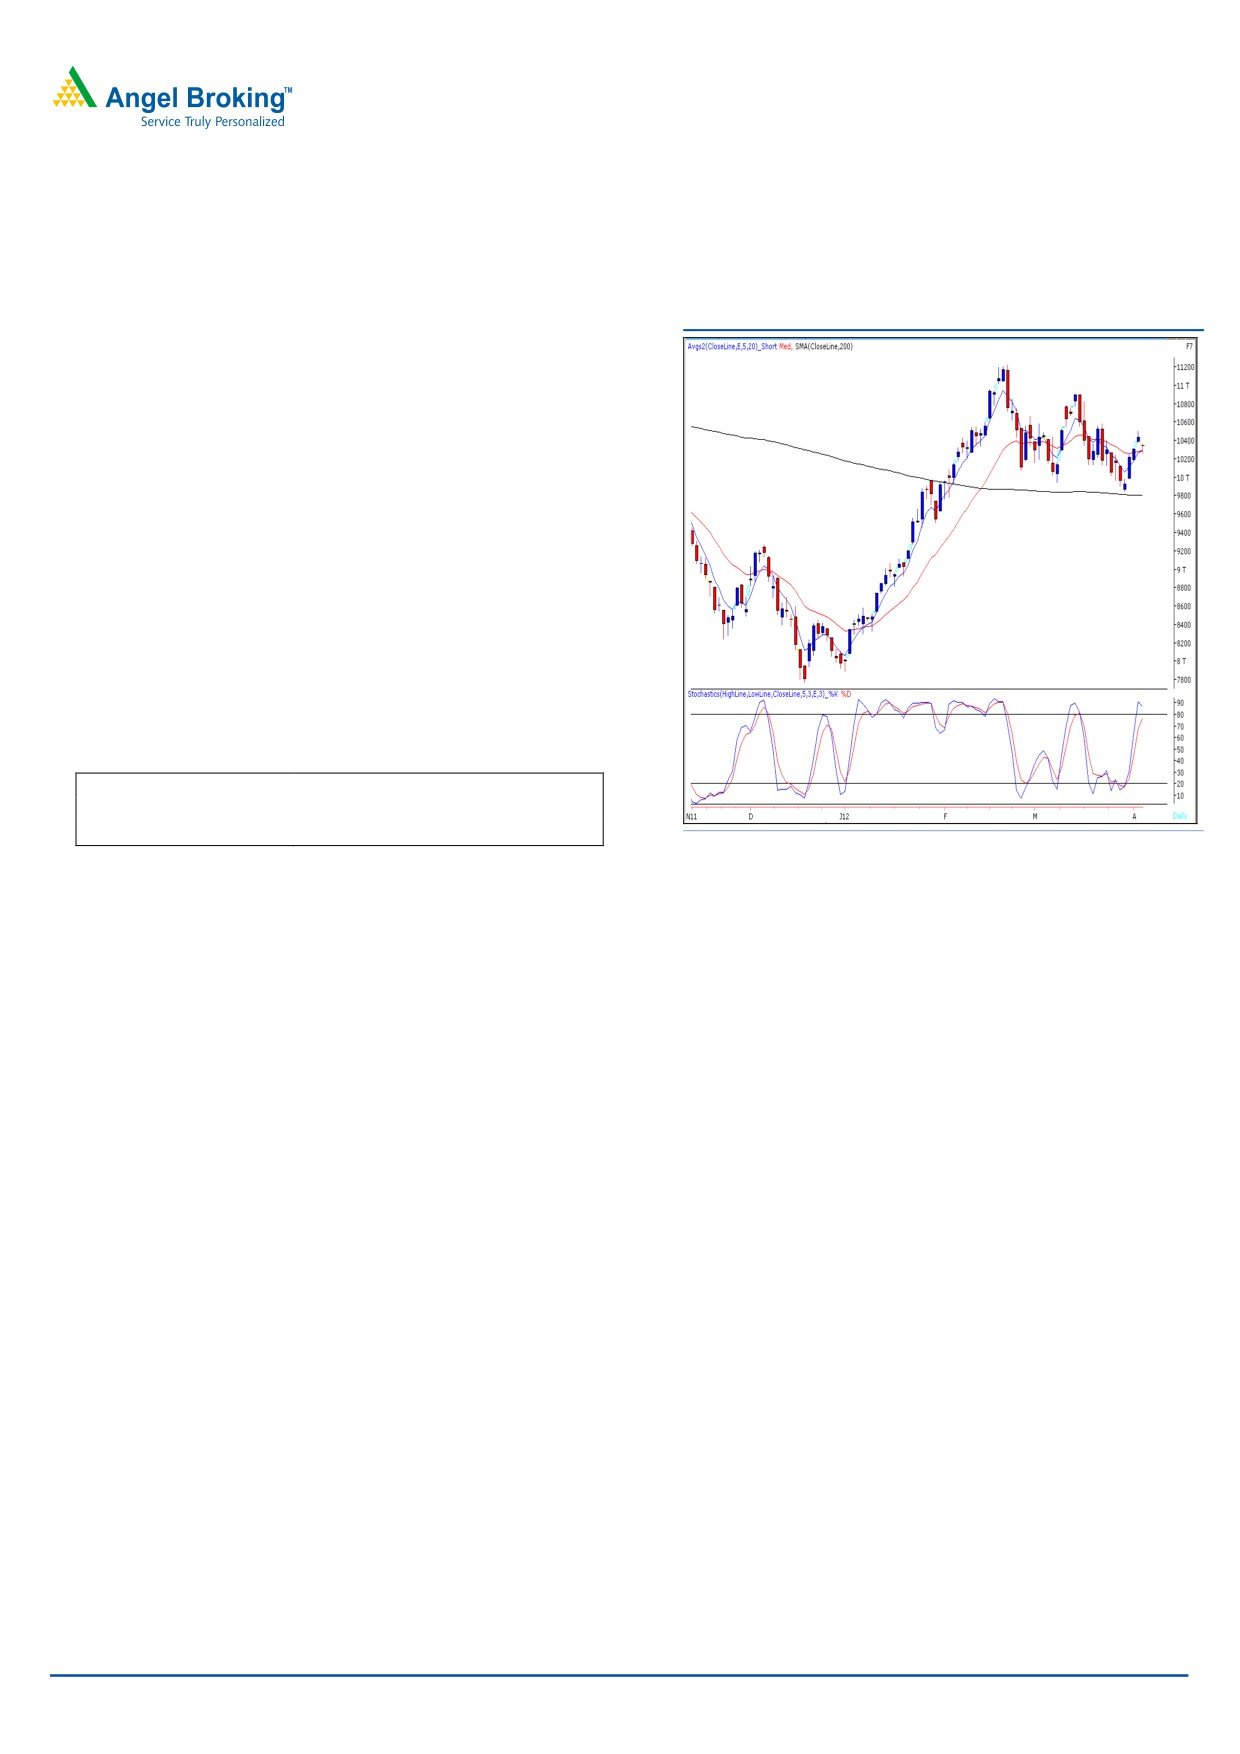
Bank Nifty Outlook - (10340)
Exhibit 2: Bank Nifty Daily Chart
On Wednesday, Bank Nifty opened with a minor
downside gap and traded in a narrow range throughout
the session. We had mentioned in our previous report
that the momentum oscillators on the hourly chart are
negatively poised and a minor pullback cannot be ruled
out. The momentum oscillator “Stochastic” on the daily
chart is in an overbought condition. Looking at the above
technical evidences and price patterns on the Daily chart,
it is likely that if the index sustains below Wednesday’s
low of 10267 then it may drift towards 10174 - 10100
levels. On the upside 10375 - 10503 levels are expected
to act as intermediate resistance levels.
Actionable points:
View
Neutral
Resistance Levels
10375 - 10503
Support Levels
10267 - 10174 - 10100
Source: Falcon
For Private Circulation Only |
2
Technical Research | April 09, 2012
Negative Bias:
Negative
Expected
Stock Name
CMP
5 Day EMA
20 Day EMA
Remarks
Below
Target
Jubilant
View will change above
1186
1171
1105.7
1170
1110
Foods
1205
For Private Circulation Only |
3
Technical Research | April 09, 2012
Daily Pivot Levels for Nifty 50 Stocks
SCRIPS
S2
S1
PIVOT
R1
R2
SENSEX
17,375
17,431
17,492
17,547
17,609
NIFTY
5,289
5,306
5,322
5,339
5,355
BANKNIFTY
10,223
10,281
10,327
10,385
10,431
ACC
1,321
1,333
1,348
1,360
1,375
AMBUJACEM
166
167
169
170
172
AXISBANK
1,147
1,157
1,165
1,175
1,184
BAJAJ-AUTO
1,613
1,623
1,635
1,646
1,658
BHARTIARTL
325
327
332
334
339
BHEL
258
266
270
278
282
BPCL
689
694
699
704
709
CAIRN
351
355
359
363
367
CIPLA
301
303
307
310
314
COALINDIA
330
336
340
346
350
DLF
199
202
204
207
209
DRREDDY
1,685
1,699
1,710
1,724
1,735
GAIL
362
367
373
378
384
HCLTECH
495
502
507
514
520
HDFC
674
677
681
684
688
HDFCBANK
522
524
527
529
531
HEROMOTOCO
1,962
1,987
2,015
2,040
2,067
HINDALCO
129
131
132
134
136
HINDUNILVR
394
397
401
403
407
ICICIBANK
870
880
891
901
911
IDFC
135
137
138
140
141
INFY
2,826
2,838
2,857
2,869
2,888
ITC
224
226
227
229
231
JINDALSTEL
512
519
529
535
546
JPASSOCIAT
83
85
86
88
89
KOTAKBANK
543
547
553
557
562
LT
1,325
1,335
1,344
1,354
1,363
M&M
688
693
699
704
710
MARUTI
1,289
1,302
1,320
1,333
1,351
NTPC
165
166
168
169
171
ONGC
271
272
274
276
278
PNB
917
923
928
935
940
POWERGRID
108
110
110
112
113
RANBAXY
454
466
474
486
494
RCOM
83
84
85
87
88
RELIANCE
736
741
749
755
763
RELINFRA
587
594
602
609
617
RPOWER
119
120
122
123
125
SAIL
96
97
98
99
100
SBIN
2,117
2,140
2,159
2,182
2,202
SESAGOA
190
192
195
197
200
SIEMENS
774
781
787
794
800
STER
108
109
111
112
114
SUNPHARMA
555
560
565
569
575
SUZLON
24
25
25
26
26
TATAMOTORS
275
277
279
281
284
TATAPOWER
98
99
102
103
106
TATASTEEL
467
471
475
479
483
TCS
1,156
1,167
1,178
1,190
1,201
WIPRO
434
439
445
450
457
Technical Research Team
For Private Circulation Only |
4
Technical Report
RESEARCH TEAM
Shardul Kulkarni
Head - Technicals
Sameet Chavan
Technical Analyst
Sacchitanand Uttekar
Technical Analyst
Mehul Kothari
Technical Analyst
Ankur Lakhotia
Technical Analyst
Research Team: 022-3952 6600
DISCLAIMER: This document is not for public distribution and has been furnished to you solely for your information and must not
be reproduced or redistributed to any other person. Persons into whose possession this document may come are required to observe
these restrictions.
Opinion expressed is our current opinion as of the date appearing on this material only. While we endeavor to update on a
reasonable basis the information discussed in this material, there may be regulatory, compliance, or other reasons that prevent us
from doing so. Prospective investors and others are cautioned that any forward-looking statements are not predictions and may be
subject to change without notice. Our proprietary trading and investment businesses may make investment decisions that are
inconsistent with the recommendations expressed herein.
The information in this document has been printed on the basis of publicly available information, internal data and other reliable
sources believed to be true and are for general guidance only. While every effort is made to ensure the accuracy and completeness of
information contained, the company takes no guarantee and assumes no liability for any errors or omissions of the information. No
one can use the information as the basis for any claim, demand or cause of action.
Recipients of this material should rely on their own investigations and take their own professional advice. Each recipient of this
document should make such investigations as it deems necessary to arrive at an independent evaluation of an investment in the
securities of companies referred to in this document (including the merits and risks involved), and should consult their own advisors to
determine the merits and risks of such an investment. Price and value of the investments referred to in this material may go up or
down. Past performance is not a guide for future performance. Certain transactions - futures, options and other derivatives as well as
non-investment grade securities - involve substantial risks and are not suitable for all investors. Reports based on technical analysis
centers on studying charts of a stock's price movement and trading volume, as opposed to focusing on a company's fundamentals
and as such, may not match with a report on a company's fundamentals.
We do not undertake to advise you as to any change of our views expressed in this document. While we would endeavor to update
the information herein on a reasonable basis, Angel Broking, its subsidiaries and associated companies, their directors and
employees are under no obligation to update or keep the information current. Also there may be regulatory, compliance, or other
reasons that may prevent Angel Broking and affiliates from doing so. Prospective investors and others are cautioned that any
forward-looking statements are not predictions and may be subject to change without notice.
Angel Broking Limited and affiliates, including the analyst who has issued this report, may, on the date of this report, and from time
to time, have long or short positions in, and buy or sell the securities of the companies mentioned herein or engage in any other
transaction involving such securities and earn brokerage or compensation or act as advisor or have other potential conflict of interest
with respect to company/ies mentioned herein or inconsistent with any recommendation and related information and opinions.
Angel Broking Limited and affiliates may seek to provide or have engaged in providing corporate finance, investment banking or
other advisory services in a merger or specific transaction to the companies referred to in this report, as on the date of this report or
in the past.
Sebi Registration No: INB 010996539
For Private Circulation Only |