Technical Research | March 09, 2012
Daily Technical Report
Sensex (17146) / NIFTY (5220)
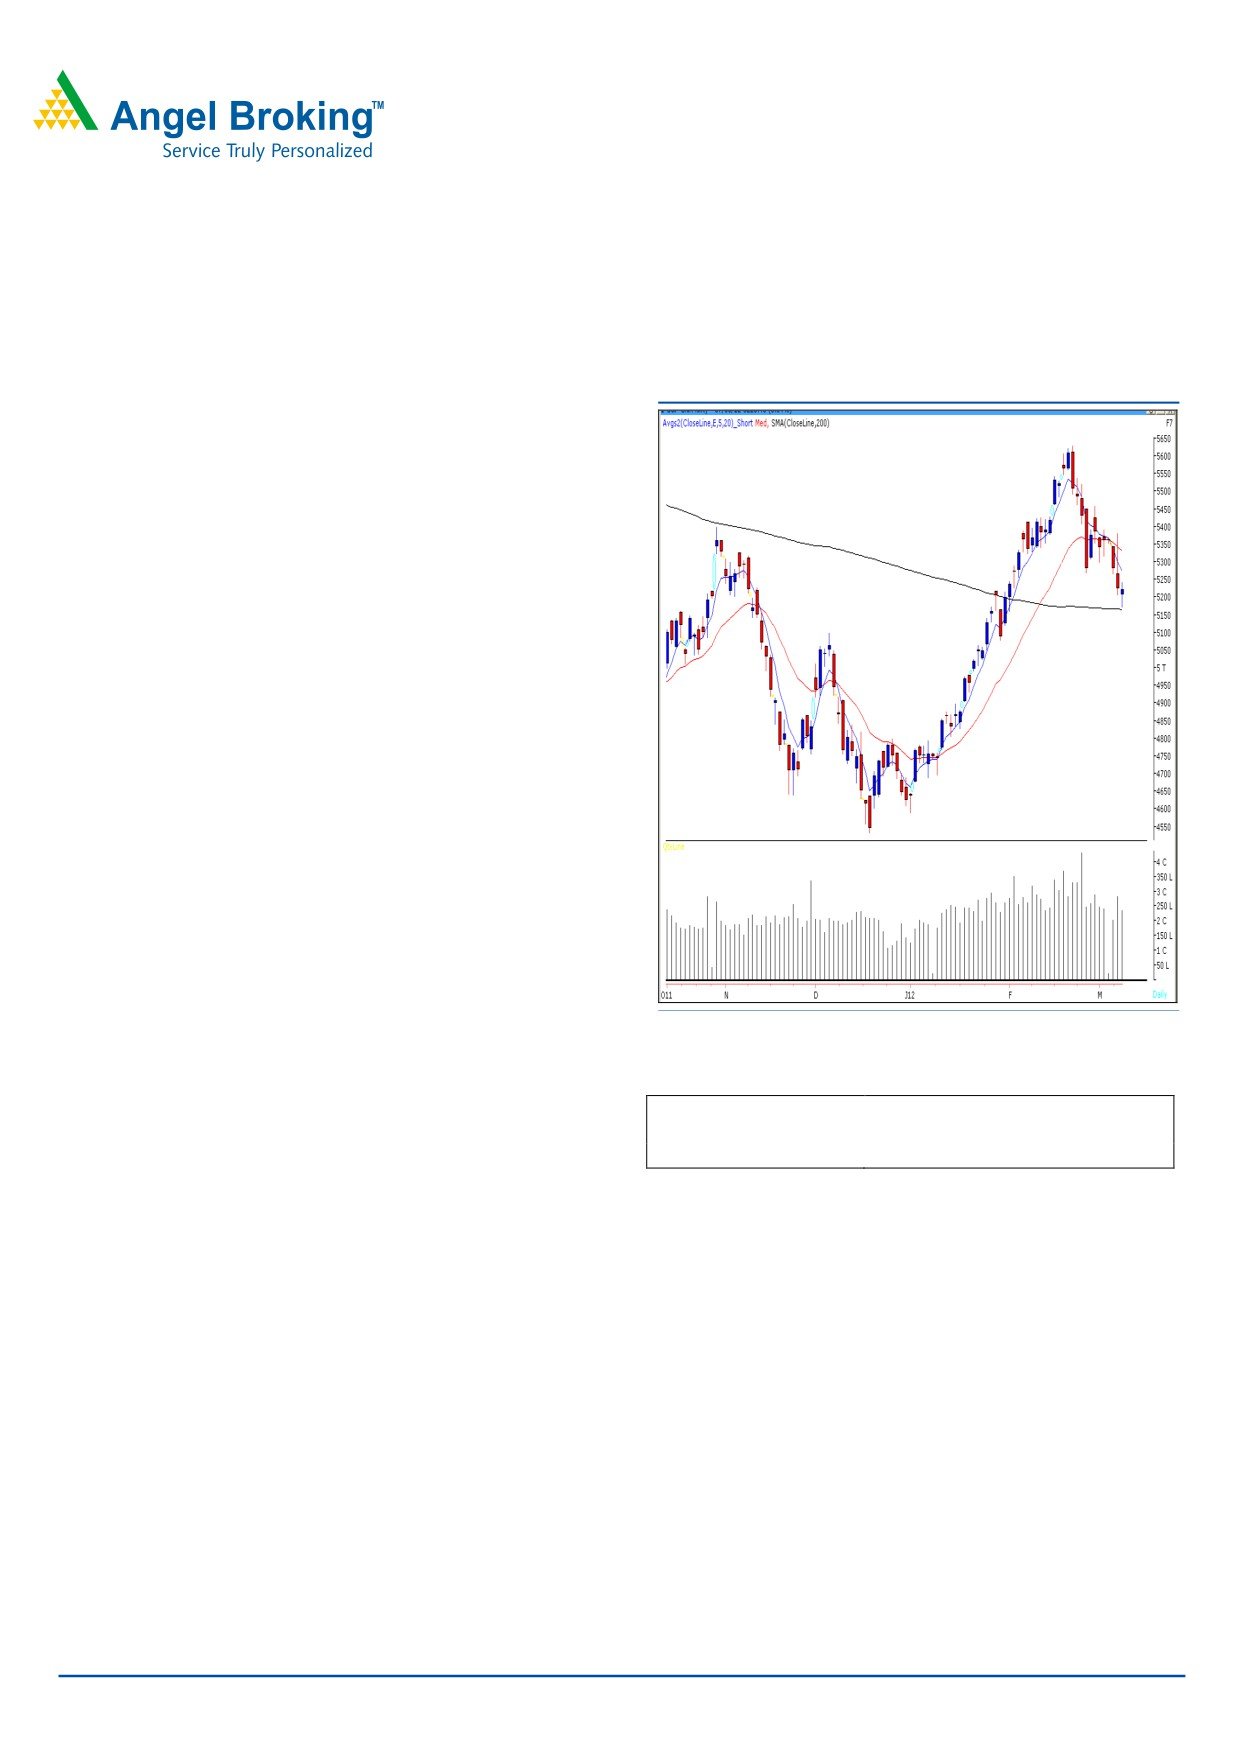
Exhibit 1: Nifty Daily Chart
One Wednesday, markets again opened lower but
managed to show strength in the later half to finally close in
green. As mentioned and expected, our benchmark indices
found some support near 200-day SMA. On the sectoral
front, the recovery was lead by Realty, IT and Banking
counters whereas Oil & Gas and Metal sectors once again
remained under pressure. The advance to decline ratio was
in favor of declining counters. (A=1141 D=1690) (Source -
Formation:
• The 200-day SMA and 20-day EMA have now shifted to
17180 / 5164 and 17682 / 5330, respectively.
• The 38.8 % and 50 % Fibonacci retracement of the rise
from 15135 / 4530 to 18524 / 5630 levels are at
17230 / 5210 and 16830 / 5080 respectively.
• The Daily chart depicts a Japanese candlestick pattern
which resembles a “Hammer” near 200-day SMA.
Source: Falcon
Actionable points:
Trading strategy:
View
Neutral
In our previous trading session, we witnessed that initially
Resistance Levels
5244 - 5284 - 5330
indices drifted lower to test mentioned support level of
Support level
5164 / 5080
17000 / 5167and later pulled back to close in the green.
Now on the Daily chart, we are witnessing a Japanese
candlestick pattern which resembles a “Hammer” near 200-
day SMA which needs confirmation. The global cues
suggest that our Benchmark indices might open with
positive bias. Going forward, a closing above 5244 level
which is the high of “Hammer” would confirm the bullish
implication of the pattern. In such scenario, indices are
likely to test 17362 - 17562 / 5284 - 5330 levels. On
the downside, 17000 / 5164 may act as strong support in
coming trading session.
For Private Circulation Only |
1
Technical Research | March 09, 2012
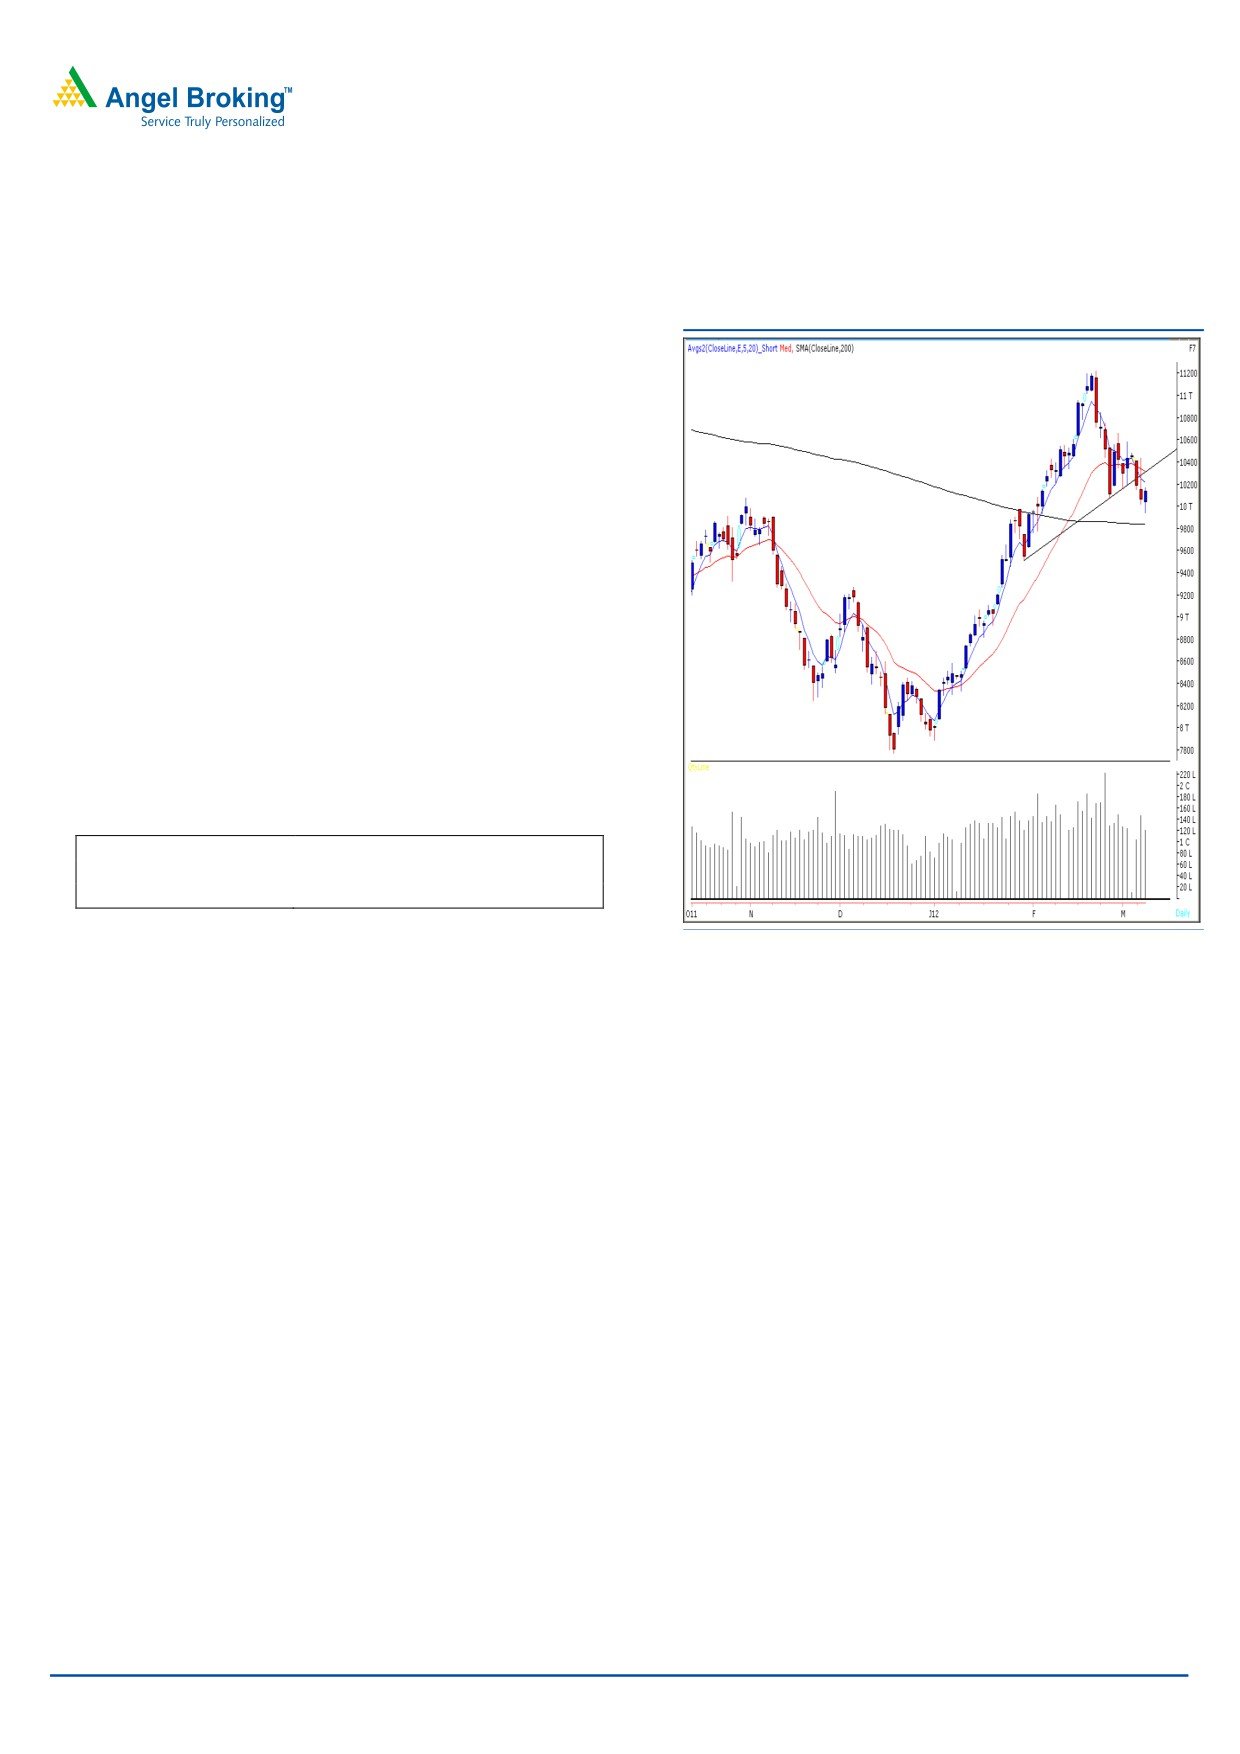
Bank Nifty Outlook - (10133)
Exhibit 2: Bank Nifty Daily Chart
On Wednesday, Bank Nifty opened on lower in line with
our benchmark indices but contributed significantly to the
bullish undertone in the later of the day. Strong buying
emerged near the mentioned support zone of 9900 -
9838 which led the index to close near the highest point
of the day. As mentioned in our earlier report, the “RSI”
momentum oscillator is still below 50 and there is a
negative crossover in “5 & 20 EMA”. However, the
oversold condition of “stochastic” momentum oscillator
on daily chart indicates a possibility of a minor pullback.
Thus, if the index sustains above Wednesday’s high of
10169, then it is likely to test 10294 - 10438 levels. On
the downside 9900 - 9833 levels are likely to act as
support in coming trading session.
Actionable points:
View
Bullish
Expected Targets
10294 - 10438
Support Levels
9900 - 9833
Source: Falcon
For Private Circulation Only |
2
Technical Research | March 09, 2012
Positive Bias:
20 Day
Positive
Expected
Stock Name
CMP
5 Day EMA
Remarks
EMA
Above
Target
View will change below
TTK Prestige
2889
2848
2835
2930
3040
2800
For Private Circulation Only |
3
Technical Research | March 09, 2012
Daily Pivot Levels for Nifty 50 Stocks
SCRIPS
S2
S1
PIVOT
R1
R2
SENSEX
16,901
17,023
17,131
17,254
17,362
NIFTY
5,140
5,180
5,212
5,252
5,284
BANKNIFTY
9,851
9,992
10,081
10,222
10,310
ACC
1,270
1,287
1,299
1,316
1,327
AMBUJACEM
158
159
160
161
162
AXISBANK
1,116
1,140
1,155
1,180
1,194
BAJAJ-AUTO
1,663
1,698
1,726
1,761
1,789
BHARTIARTL
322
326
331
335
341
BHEL
257
264
271
278
285
BPCL
641
650
658
667
675
CAIRN
349
353
359
363
369
CIPLA
301
305
308
312
315
COALINDIA
320
323
327
330
334
DLF
188
194
198
203
207
DRREDDY
1,654
1,673
1,690
1,709
1,725
GAIL
342
345
349
352
356
HCLTECH
466
481
489
503
511
HDFC
643
648
654
659
665
HDFCBANK
490
503
510
523
531
HEROMOTOCO
1,859
1,874
1,887
1,902
1,915
HINDALCO
125
128
131
134
137
HINDUNILVR
375
380
383
388
391
ICICIBANK
833
846
857
871
882
IDFC
132
135
138
142
145
INFY
2,811
2,848
2,871
2,908
2,931
ITC
207
208
210
211
213
JINDALSTEL
517
527
535
545
553
JPASSOCIAT
64
69
72
78
81
KOTAKBANK
537
545
551
558
564
LT
1,191
1,214
1,233
1,256
1,275
M&M
660
667
675
682
690
MARUTI
1,258
1,283
1,306
1,332
1,355
NTPC
167
168
171
173
176
ONGC
274
276
280
283
286
PNB
908
920
930
942
952
POWERGRID
105
107
109
110
112
RANBAXY
401
409
415
423
429
RCOM
88
90
91
94
95
RELIANCE
737
749
763
776
790
RELINFRA
591
610
623
642
656
RPOWER
119
126
130
137
141
SAIL
87
89
92
93
96
SBIN
2,079
2,110
2,137
2,168
2,195
SESAGOA
185
189
194
198
203
SIEMENS
767
778
788
799
809
STER
104
106
110
113
117
SUNPHARMA
551
555
559
563
567
SUZLON
26
27
27
28
28
TATAMOTORS
259
264
267
271
274
TATAPOWER
106
107
109
110
112
TATASTEEL
409
417
423
430
437
TCS
1,176
1,184
1,195
1,204
1,215
WIPRO
422
431
438
446
453
Technical Research Team
For Private Circulation Only |
4
Technical Report
RESEARCH TEAM
Shardul Kulkarni
Head - Technicals
Sameet Chavan
Technical Analyst
Sacchitanand Uttekar
Technical Analyst
Mehul Kothari
Technical Analyst
Ankur Lakhotia
Technical Analyst
Research Team: 022-3952 6600
DISCLAIMER: This document is not for public distribution and has been furnished to you solely for your information and must not
be reproduced or redistributed to any other person. Persons into whose possession this document may come are required to observe
these restrictions.
Opinion expressed is our current opinion as of the date appearing on this material only. While we endeavor to update on a
reasonable basis the information discussed in this material, there may be regulatory, compliance, or other reasons that prevent us
from doing so. Prospective investors and others are cautioned that any forward-looking statements are not predictions and may be
subject to change without notice. Our proprietary trading and investment businesses may make investment decisions that are
inconsistent with the recommendations expressed herein.
The information in this document has been printed on the basis of publicly available information, internal data and other reliable
sources believed to be true and are for general guidance only. While every effort is made to ensure the accuracy and completeness of
information contained, the company takes no guarantee and assumes no liability for any errors or omissions of the information. No
one can use the information as the basis for any claim, demand or cause of action.
Recipients of this material should rely on their own investigations and take their own professional advice. Each recipient of this
document should make such investigations as it deems necessary to arrive at an independent evaluation of an investment in the
securities of companies referred to in this document (including the merits and risks involved), and should consult their own advisors to
determine the merits and risks of such an investment. Price and value of the investments referred to in this material may go up or
down. Past performance is not a guide for future performance. Certain transactions - futures, options and other derivatives as well as
non-investment grade securities - involve substantial risks and are not suitable for all investors. Reports based on technical analysis
centers on studying charts of a stock's price movement and trading volume, as opposed to focusing on a company's fundamentals
and as such, may not match with a report on a company's fundamentals.
We do not undertake to advise you as to any change of our views expressed in this document. While we would endeavor to update
the information herein on a reasonable basis, Angel Broking, its subsidiaries and associated companies, their directors and
employees are under no obligation to update or keep the information current. Also there may be regulatory, compliance, or other
reasons that may prevent Angel Broking and affiliates from doing so. Prospective investors and others are cautioned that any
forward-looking statements are not predictions and may be subject to change without notice.
Angel Broking Limited and affiliates, including the analyst who has issued this report, may, on the date of this report, and from time
to time, have long or short positions in, and buy or sell the securities of the companies mentioned herein or engage in any other
transaction involving such securities and earn brokerage or compensation or act as advisor or have other potential conflict of interest
with respect to company/ies mentioned herein or inconsistent with any recommendation and related information and opinions.
Angel Broking Limited and affiliates may seek to provide or have engaged in providing corporate finance, investment banking or
other advisory services in a merger or specific transaction to the companies referred to in this report, as on the date of this report or
in the past.
Sebi Registration No : INB 010996539
For Private Circulation Only |