Technical Research | January 09, 2012
Daily Technical Report
Sensex (15849) / NIFTY (4747)
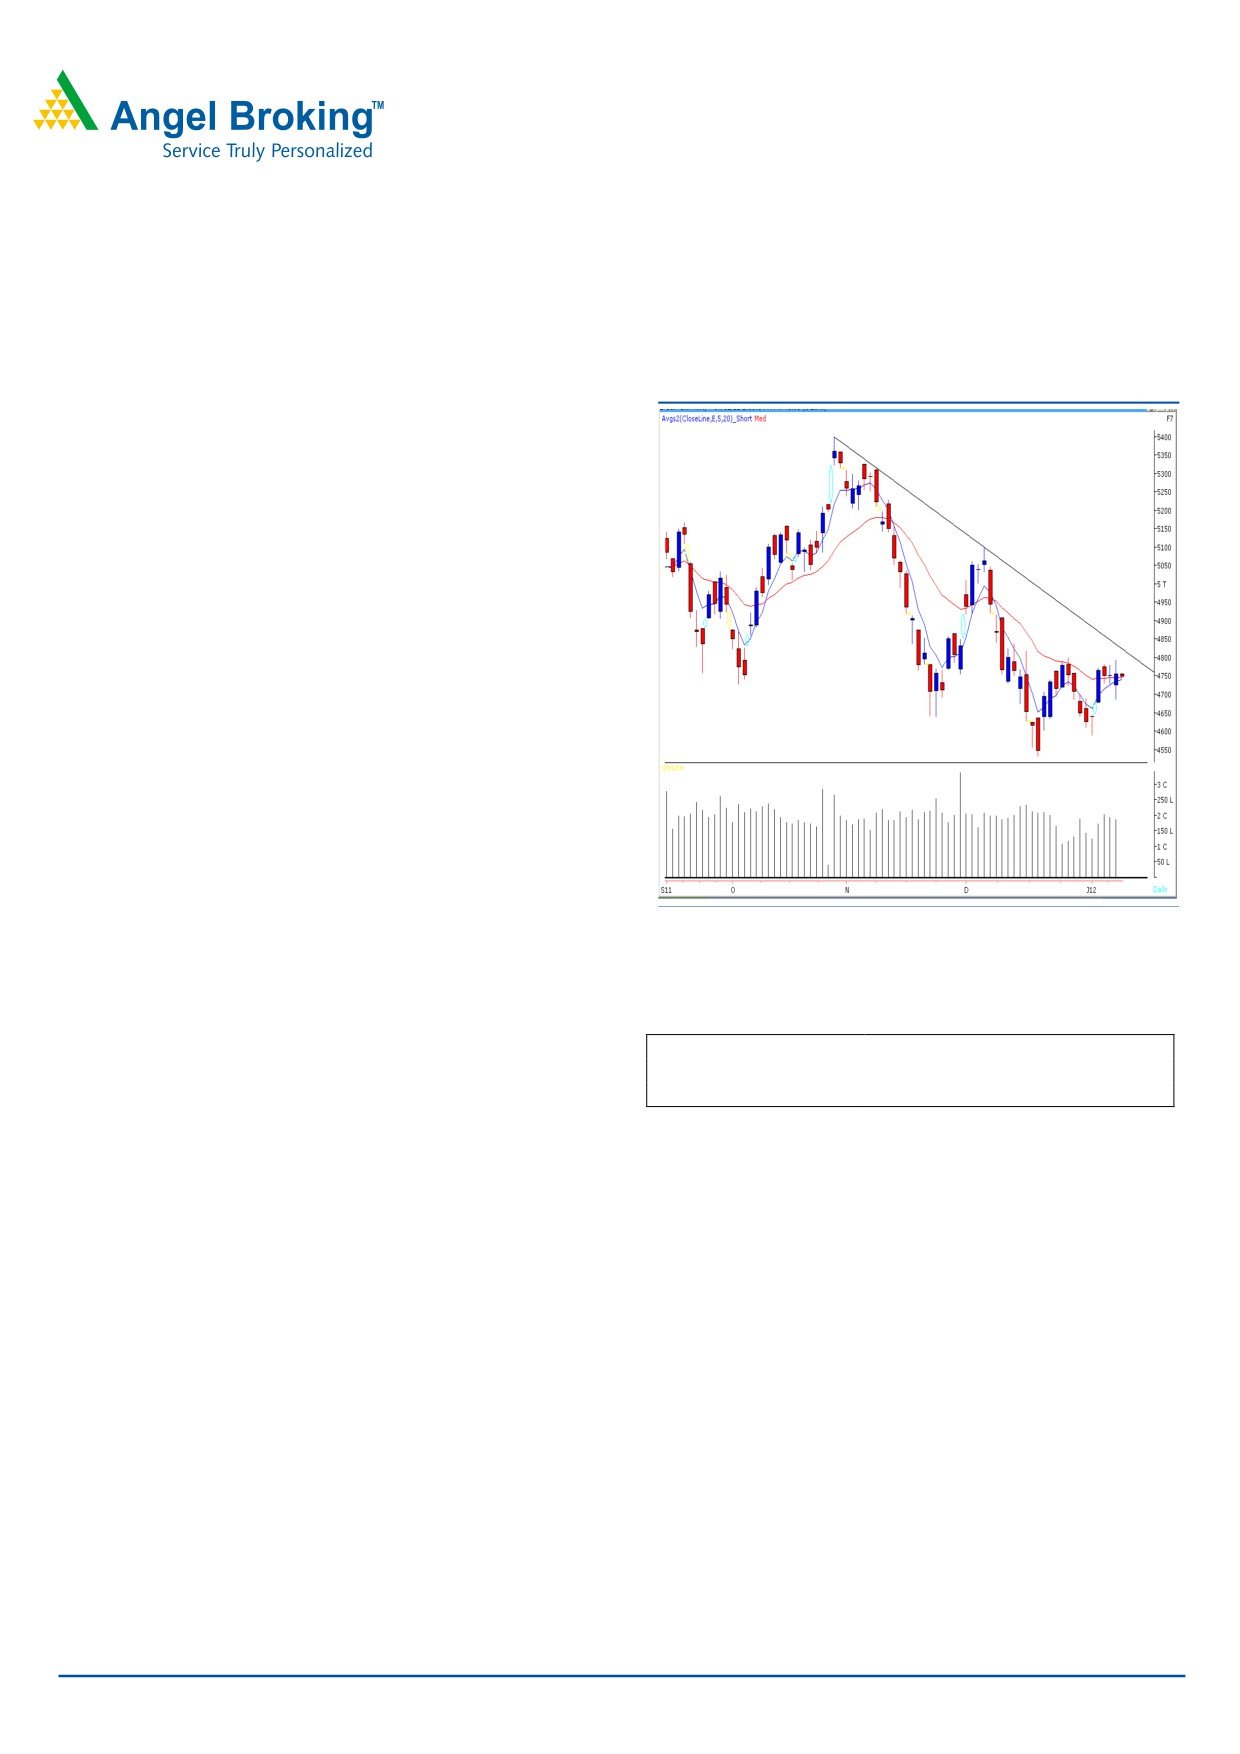
Exhibit 1: Nifty Daily Chart
On Friday, indices opened on a flat note and traded with
immense volatility throughout the day. After making one
more attempt of crossing 16070 / 4820 level, indices finally
closed around 15900 / 4750 mark. On the sectoral front,
Oil & Gas, PSU and Banking sectors were among the major
gainers. The advance to decline ratio was in favor of
gaining counters. (A=1570 D=652).
(Source
-
Formation:
• The 20 - day EMA (Exponential Moving Average) has
now shifted to the 15846 / 4745 level.
• We are witnessing a positive crossover in weekly
momentum oscillators viz., the RSI and the Stochastic.
• On the Daily chart, we are observing a “Downward
Source: Falcon
Sloping Trend Line” resistance around 16070 / 4820 level.
Actionable points:
Trading strategy:
View
Positive Above 4820
Indices have moved in a narrow range after taking support
Expected Targets
4881 - 4920
around the mentioned levels of 15331 / 4589. Buying
Support level
4686
interest was seen on Friday’s session as indices moved
sharply from day’s low and made one more attempt to
cross the 16070 / 4820 levels. However, markets finally
Therefore, we reiterate that if indices manage to sustain
closed around the 15900 / 4750 mark. We are now
above 16070 / 4820, then they are likely to head towards
witnessing a positive crossover in “RSI” and “Stochastic”
16286 - 16421/ 4881 - 4920 levels. A move beyond
16421 / 4920 may push indices higher to test the next
oscillators. Also, indices have been consistently closing
resistance levels of 16600 - 17004 / 4976 - 5100. On the
above the 20 day - EMA since the past few trading sessions,
downside, 15358 - 15135 / 4588 - 4531 remains to be a
which indicate possibility of a strong positive momentum if
strong support level.
indices manage to sustain above 16070 / 4820. This level
is also coinciding with a “Downward Sloping Trend Line”
resistance.
For Private Circulation Only |
1
Technical Research | January 09, 2012
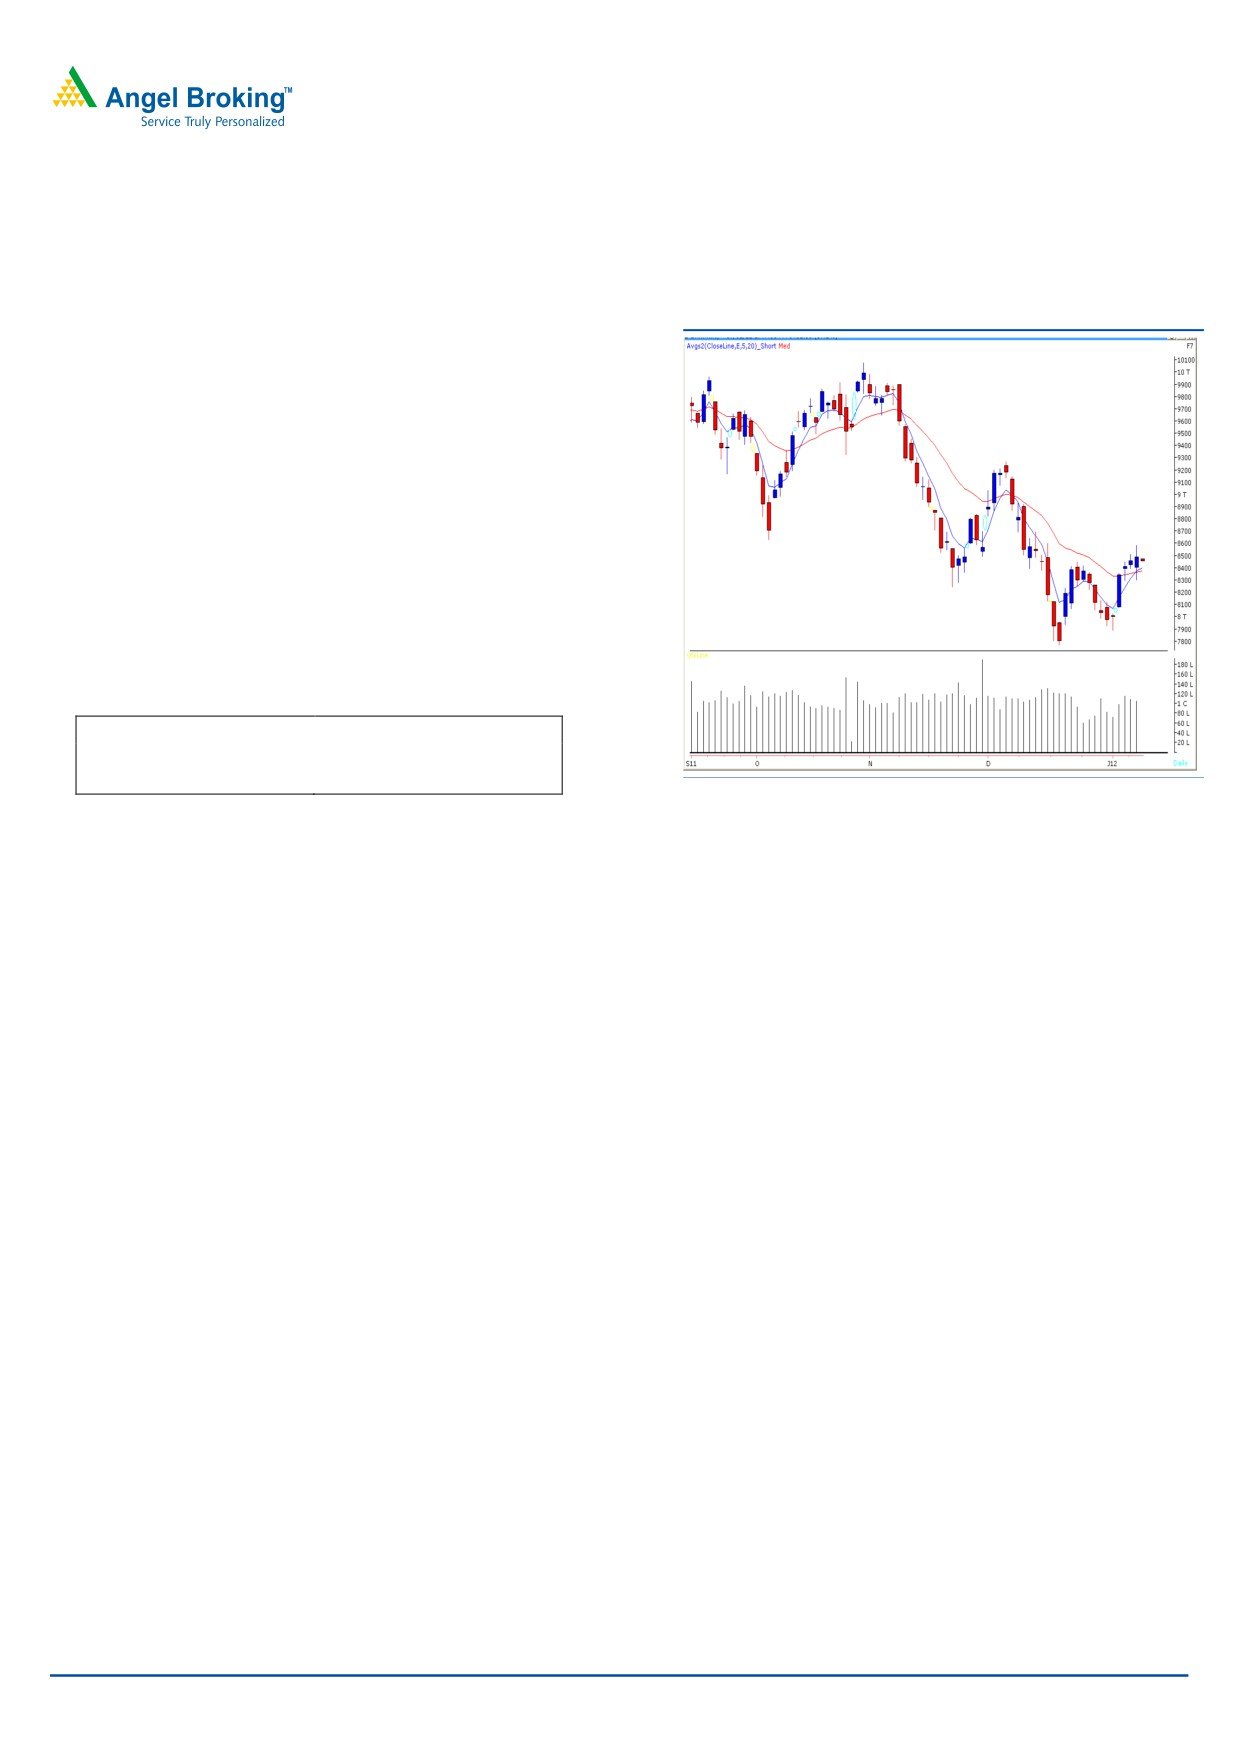
Bank Nifty Outlook - (8453)
Exhibit 2: Bank Nifty Daily Chart
On Friday’s session, Bank Nifty opened on flat note and
traded with extreme volatility throughout the session. The
index took support near the “20 SMA” and bounced back
sharply to test the mentioned resistance zone of 8580 -
8604. We reiterate our view, that only a sustainable move
above this resistance zone will lead the index higher. In this
case, if Bank Nifty sustains above 8604 level then it is likely
to test 8697 - 8800 levels. On the downside, 8339 - 8297
levels are likely to act as support in coming trading session.
Actionable points:
View
Positive Above 8604
Expected Target
8697 - 8800
Support Levels
8339 - 8297
Source: Falcon
For Private Circulation Only |
2
Technical Research | January 09, 2012
Positive Bias:
Expected
Stock Name
CMP
5 Day EMA
20 Day EMA
Remarks
Target
Siemens
668.5
663.4
666.5
700
View will change below 640
Reliance Cap
261.9
253.7
256.1
290
View will change below 241
Negative Bias:
Expected
Stock Name
CMP
5 Day EMA
20 Day EMA
Remarks
Target
Cairn India
338.2
333.6
321.1
320
View will change above 346
For Private Circulation Only |
3
Technical Research | January 09, 2012
Daily Pivot Levels for Nifty 50 Stocks
SCRIPS
S2
S1
PIVOT
R1
R2
SENSEX
15,796
15,823
15,861
15,888
15,926
NIFTY
4,733
4,740
4,750
4,757
4,766
BANKNIFTY
8,413
8,433
8,457
8,477
8,501
ACC
1,089
1,095
1,104
1,111
1,120
AMBUJACEM
151
152
153
154
155
AXISBANK
845
848
852
856
859
BAJAJ-AUTO
1,430
1,439
1,454
1,463
1,478
BHARTIARTL
328
329
331
332
334
BHEL
246
248
251
253
255
BPCL
469
473
475
479
481
CAIRN
335
337
338
340
341
CIPLA
333
334
337
338
341
DLF
174
175
177
178
179
DRREDDY
1,597
1,601
1,606
1,611
1,616
GAIL
376
380
382
386
388
HCLTECH
411
413
416
419
422
HDFC
664
666
670
672
676
HDFCBANK
448
450
451
453
455
HEROMOTOCO
1,708
1,719
1,733
1,744
1,758
HINDALCO
117
117
118
119
119
HINDUNILVR
393
394
396
397
399
ICICIBANK
740
743
746
748
751
IDFC
97
97
98
98
99
INFY
2,815
2,825
2,838
2,848
2,862
ITC
201
201
202
202
203
JINDALSTEL
454
461
465
471
475
JPASSOCIAT
51
51
52
52
53
KOTAKBANK
445
448
451
454
457
LT
1,075
1,079
1,084
1,088
1,093
M&M
648
651
655
658
663
MARUTI
934
944
951
961
968
NTPC
156
157
157
158
158
ONGC
255
256
256
257
258
PNB
807
811
816
820
826
POWERGRID
99
100
100
100
101
RANBAXY
432
436
439
443
446
RCOM
75
77
77
79
80
RELCAPITAL
251
257
261
266
270
RELIANCE
710
712
716
718
721
RELINFRA
365
371
376
382
387
RPOWER
72
73
74
75
75
SAIL
83
84
84
85
86
SBIN
1,650
1,659
1,672
1,682
1,694
SESAGOA
164
165
165
166
167
SIEMENS
657
663
668
673
678
STER
93
94
94
95
96
SUNPHARMA
496
498
500
502
504
SUZLON
18
18
18
19
19
TATAMOTORS
202
203
203
204
205
TATAPOWER
91
91
92
93
94
TATASTEEL
360
361
363
364
366
TCS
1,165
1,169
1,174
1,178
1,183
WIPRO
404
406
407
408
410
Technical Research Team
For Private Circulation Only |
4
Technical Report
RESEARCH TEAM
Shardul Kulkarni
Head - Technicals
Sameet Chavan
Technical Analyst
Sacchitanand Uttekar
Technical Analyst
Mehul Kothari
Technical Analyst
Ankur Lakhotia
Technical Analyst
Research Team: 022-3952 6600
DISCLAIMER: This document is not for public distribution and has been furnished to you solely for your information and must not
be reproduced or redistributed to any other person. Persons into whose possession this document may come are required to observe
these restrictions.
Opinion expressed is our current opinion as of the date appearing on this material only. While we endeavor to update on a
reasonable basis the information discussed in this material, there may be regulatory, compliance, or other reasons that prevent us
from doing so. Prospective investors and others are cautioned that any forward-looking statements are not predictions and may be
subject to change without notice. Our proprietary trading and investment businesses may make investment decisions that are
inconsistent with the recommendations expressed herein.
The information in this document has been printed on the basis of publicly available information, internal data and other reliable
sources believed to be true and are for general guidance only. While every effort is made to ensure the accuracy and completeness of
information contained, the company takes no guarantee and assumes no liability for any errors or omissions of the information. No
one can use the information as the basis for any claim, demand or cause of action.
Recipients of this material should rely on their own investigations and take their own professional advice. Each recipient of this
document should make such investigations as it deems necessary to arrive at an independent evaluation of an investment in the
securities of companies referred to in this document (including the merits and risks involved), and should consult their own advisors to
determine the merits and risks of such an investment. Price and value of the investments referred to in this material may go up or
down. Past performance is not a guide for future performance. Certain transactions - futures, options and other derivatives as well as
non-investment grade securities - involve substantial risks and are not suitable for all investors. Reports based on technical analysis
centers on studying charts of a stock's price movement and trading volume, as opposed to focusing on a company's fundamentals
and as such, may not match with a report on a company's fundamentals.
We do not undertake to advise you as to any change of our views expressed in this document. While we would endeavor to update
the information herein on a reasonable basis, Angel Broking, its subsidiaries and associated companies, their directors and
employees are under no obligation to update or keep the information current. Also there may be regulatory, compliance, or other
reasons that may prevent Angel Broking and affiliates from doing so. Prospective investors and others are cautioned that any
forward-looking statements are not predictions and may be subject to change without notice.
Angel Broking Limited and affiliates, including the analyst who has issued this report, may, on the date of this report, and from time
to time, have long or short positions in, and buy or sell the securities of the companies mentioned herein or engage in any other
transaction involving such securities and earn brokerage or compensation or act as advisor or have other potential conflict of interest
with respect to company/ies mentioned herein or inconsistent with any recommendation and related information and opinions.
Angel Broking Limited and affiliates may seek to provide or have engaged in providing corporate finance, investment banking or
other advisory services in a merger or specific transaction to the companies referred to in this report, as on the date of this report or
in the past.
Sebi Registration No : INB 010996539
For Private Circulation Only |