Daily Technical Report
June 07, 2012
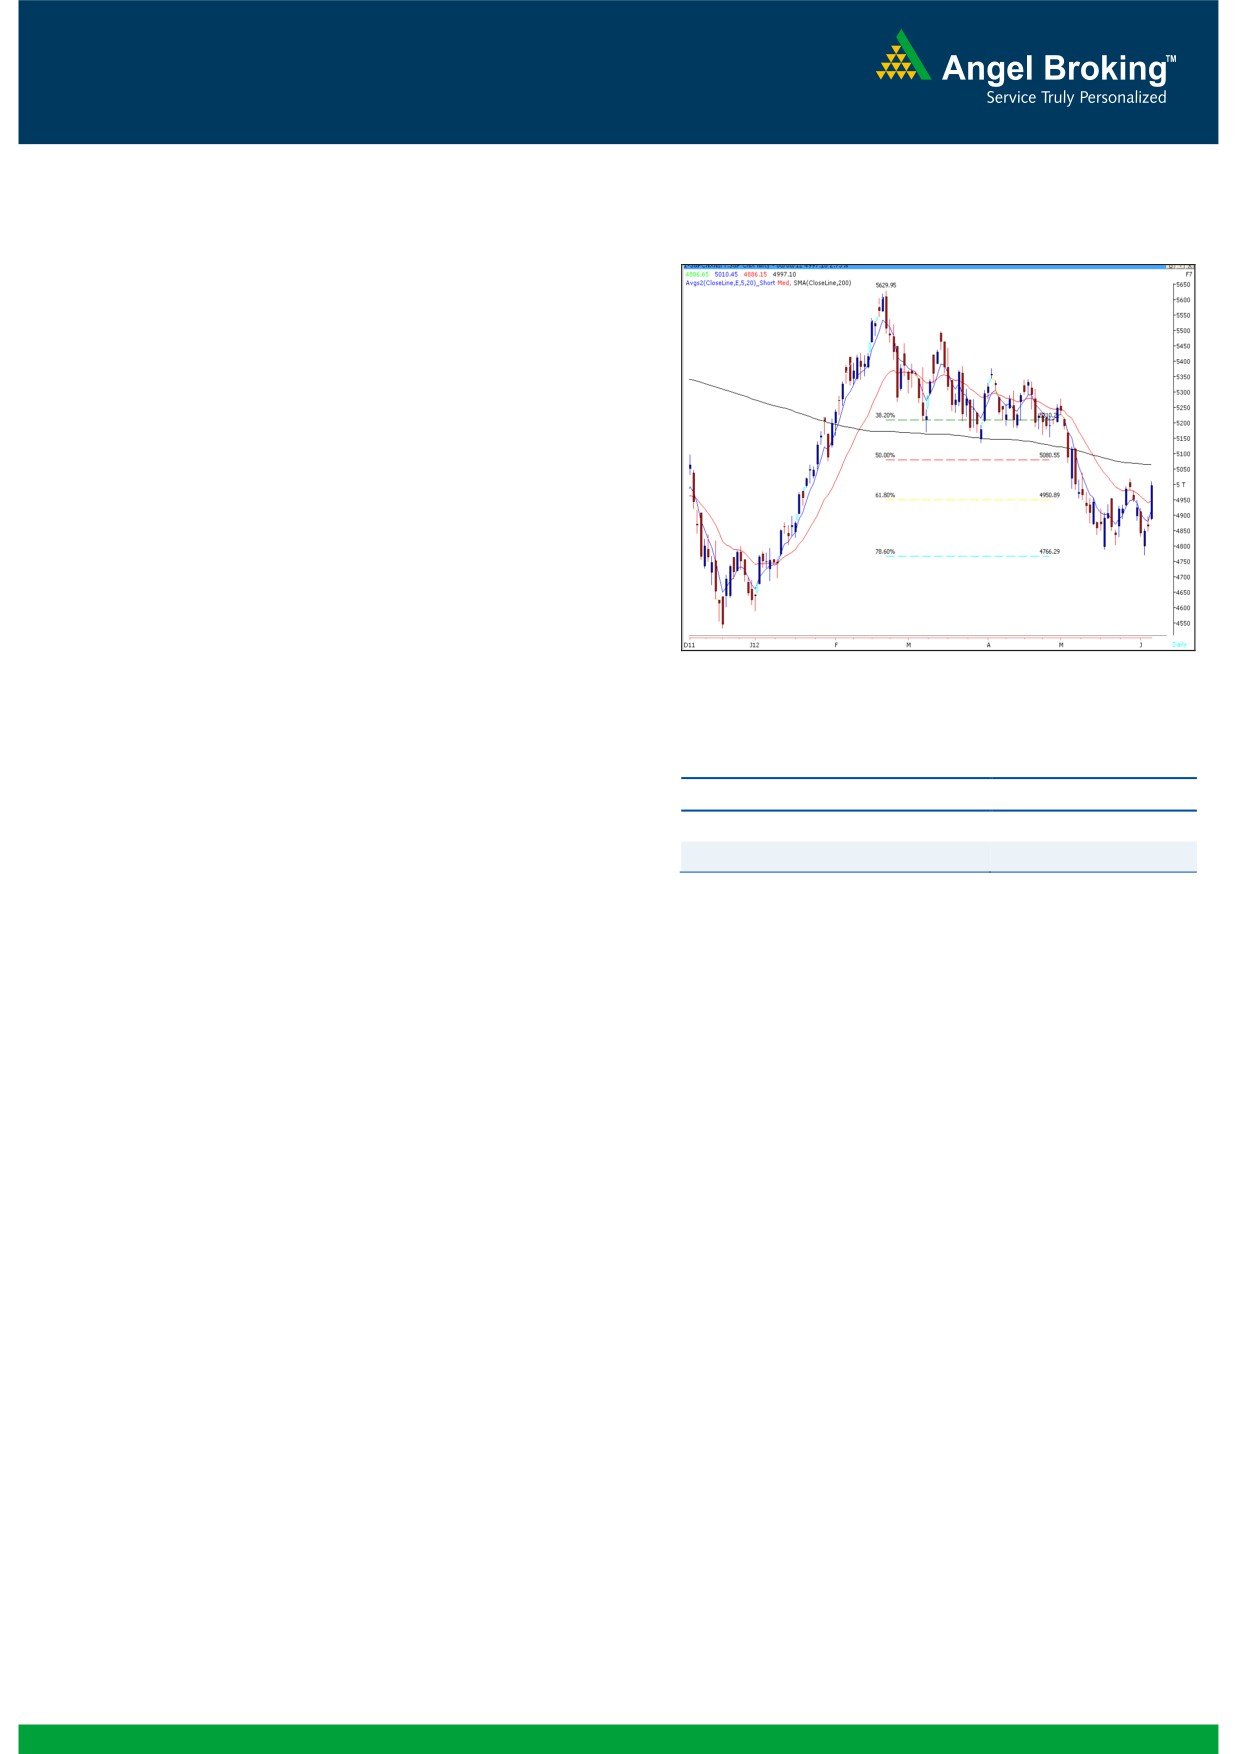
Exhibit 1: Nifty Daily Chart
Sensex (16454) / NIFTY (4997)
After immense volatility on Tuesday’s session,
yesterday our benchmark indices opened on a higher
note in-line with positive clues from other Asian
bourses. Subsequently, strong buying interest among
market participants resulted in a strong intraday rally
of nearly 3%. On sectoral front, Auto, Capital Goods,
Power and Banking counters contributed heavily in
yesterday’s huge rally. There was no sector in the
negative territory. The advance to decline ratio was in
favor of advancing counters (A=1847 D=894)
Formation
Source: Falcon
The 200-day SMA (Simple Moving Average) and
20-day EMA (Exponential Moving Average) have
now shifted to 16800 / 5070 and 16360 /
Actionable points:
4960, respectively.
View
Bullish Above 5020
The ‘20-Week EMA’ is placed at 16840 / 5100
Resistance Levels
5050 - 5090
level.
Support Levels
4947 - 4925
Indices have taken a support near 15860 /
4766 level, which is the
78.6% Fibonacci
Retracement level of the rise from 15135 / 4531
Hence, indices are likely to test their recent swing
(Low on December 23, 2011) to 18524 / 5630
high of 16544 / 5020. A sustainable move beyond
(High on February 22, 2012).
this level may push indices higher to test '200-day
SMA' resistance zone of 16780 - 16840 / 5050 -
The weekly ‘RSI’ momentum oscillator is
5090. Conversely, 16290 - 16220 / 4947 - 4925
signaling a positive crossover.
levels may provide a decent support for the markets.
Trading strategy:
Yesterday, after a gap opening, we witnessed a
strong rally on the back rumors that the Fed will resort
to Quantitative Easing (QE3) in the near future. On
the charts, positive divergence observed in daily 'RSI'
momentum oscillator helped the bulls to make
significant gains. Indices have now closed
convincingly above '20-day EMA'. In addition, the
weekly RSI oscillator is now signaling a positive
crossover. This technical indication would get
confirmed if indices give a weekly closing around
5000 mark. Going forward, considering yesterday's
sharp rally and a closing above 20-day EMA, we
expect a positive opening for the markets.
1
Daily Technical Report
June 07, 2012
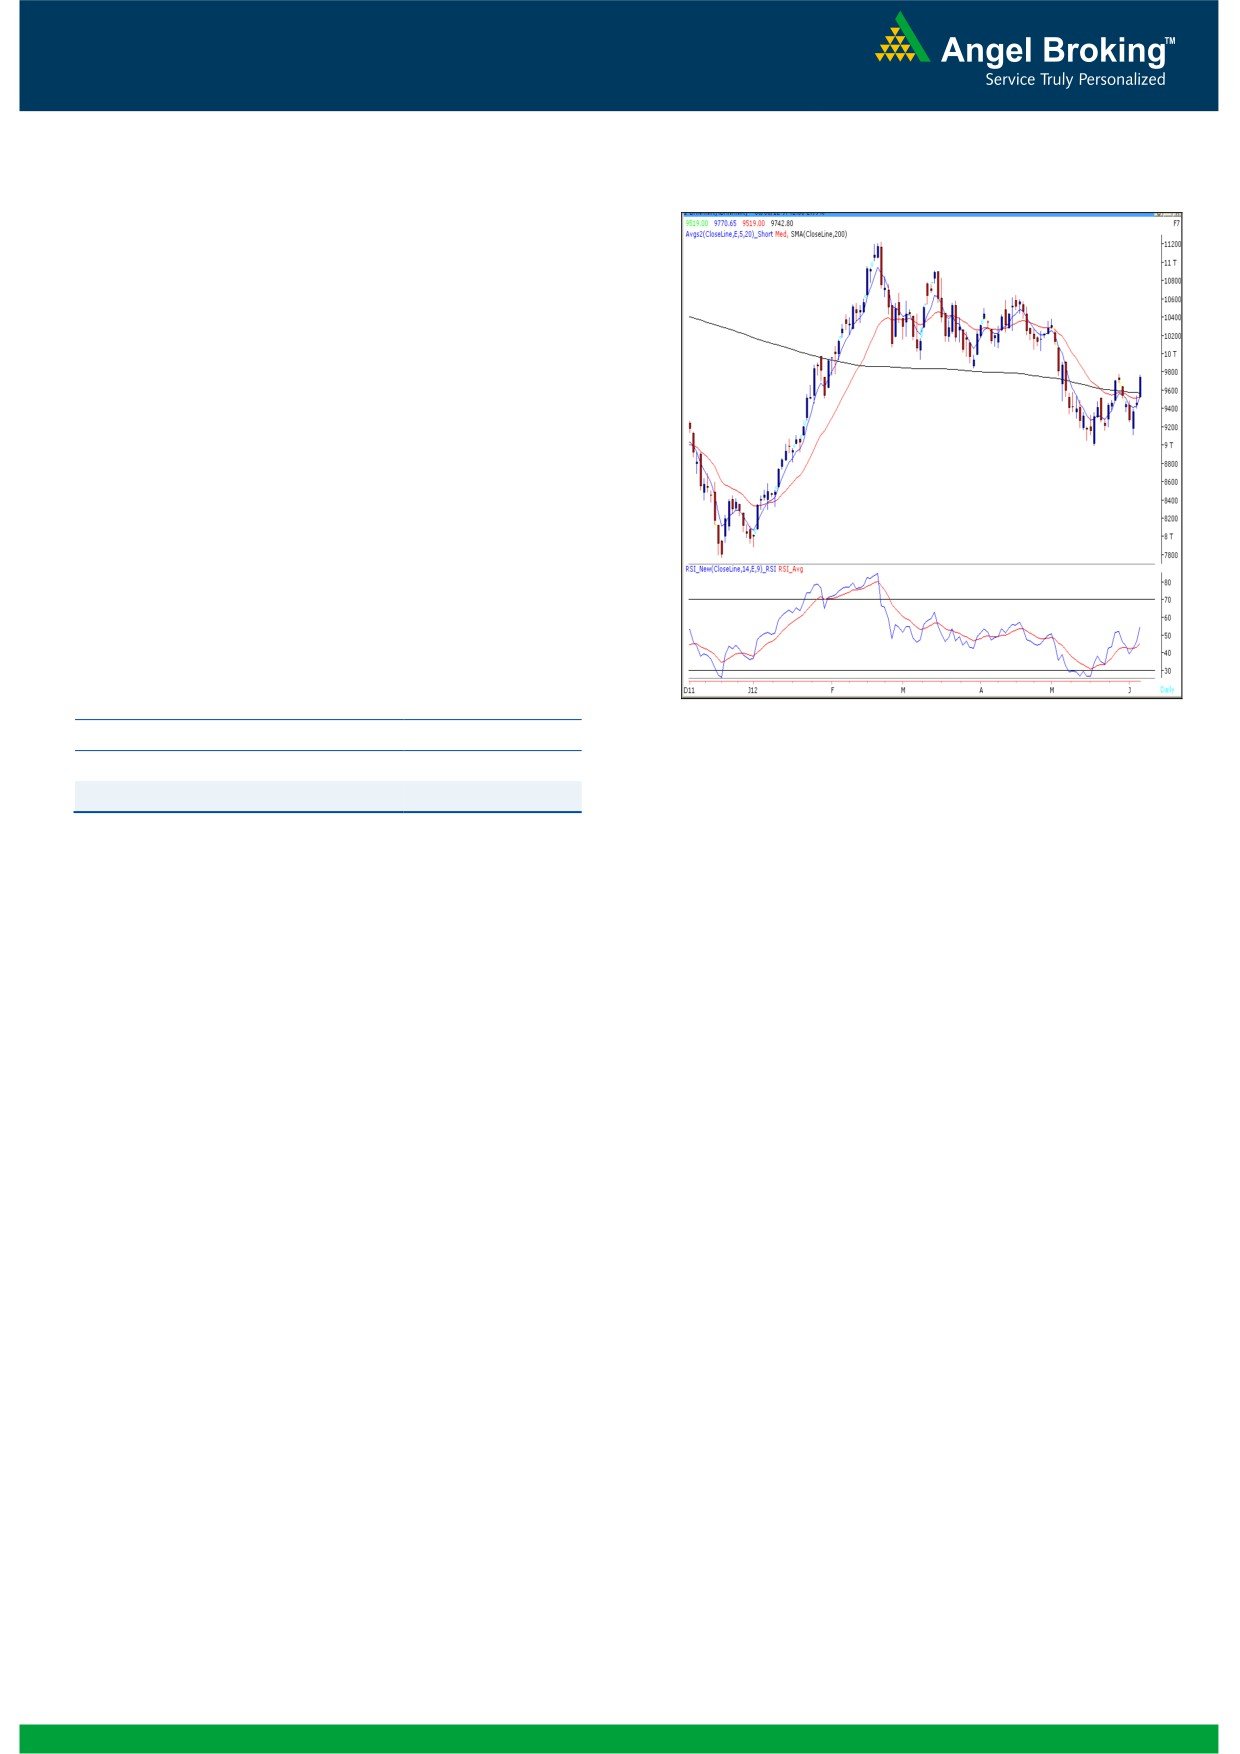
Exhibit 2: Bank Nifty Daily Chart
Bank Nifty Outlook - (9743)
Yesterday, Bank Nifty opened on an optimistic note
and gained momentum as the day progressed to
close near the highest point of the day. As mentioned
in our previous report we witnessed accelerated
momentum above 9545 level and the index almost
achieved the mentioned “Inverted Head & Shoulder”
target of 9800. The momentum oscillators on the
daily chart continue with their buy signals. However
the momentum oscillators on the hourly chart are
placed in extreme overbought territory and thus a
minor pullback or consolidation, post today’s gap up
opening, cannot be ruled out. On the upside a move
beyond 9783 level is likely to push the indices further
to test 9871 - 10030 levels.
Actionable points:
Source: Falcon
View
Bullish above 9783
Expected targets
9871 - 10030
Support Levels
9540 - 9480
2
Daily Technical Report
June 07, 2012
Daily Pivot Levels for Nifty 50 Stocks
SCRIPS
S2
S1
PIVOT
R1
R2
SENSEX
15,956
16,205
16,350
16,599
16,744
NIFTY
4,840
4,919
4,965
5,043
5,089
BANKNIFTY
9,426
9,584
9,677
9,836
9,929
ACC
1,118
1,138
1,152
1,172
1,186
AMBUJACEM
144
148
151
156
158
ASIANPAINT
3,712
3,768
3,806
3,862
3,900
AXISBANK
985
1,003
1,015
1,033
1,045
BAJAJ-AUTO
1,478
1,509
1,530
1,561
1,582
BANKBARODA
688
704
714
730
740
BHARTIARTL
280
289
294
303
308
BHEL
209
213
215
218
221
BPCL
690
698
704
712
719
CAIRN
314
318
321
325
328
CIPLA
305
307
310
312
314
COALINDIA
314
318
321
325
327
DLF
183
185
187
190
192
DRREDDY
1,581
1,598
1,619
1,636
1,656
GAIL
319
323
326
330
333
GRASIM
2,249
2,291
2,321
2,363
2,393
HCLTECH
491
497
502
507
512
HDFC
641
646
649
654
657
HDFCBANK
496
508
515
527
535
HEROMOTOCO
1,843
1,899
1,937
1,992
2,030
HINDALCO
117
119
120
122
123
HINDUNILVR
402
411
418
427
435
ICICIBANK
791
800
805
814
820
IDFC
122
125
127
131
133
INFY
2,378
2,397
2,415
2,434
2,452
ITC
221
228
232
239
244
JINDALSTEL
407
419
428
440
449
JPASSOCIAT
63
65
66
67
68
KOTAKBANK
544
556
563
574
581
LT
1,192
1,230
1,251
1,288
1,309
M&M
650
662
669
682
688
MARUTI
1,061
1,084
1,100
1,124
1,139
NTPC
145
149
151
155
157
ONGC
250
255
259
264
268
PNB
744
757
764
777
784
POWERGRID
104
107
109
112
114
RANBAXY
469
481
492
504
514
RELIANCE
691
704
711
723
730
RELINFRA
447
459
466
478
485
SAIL
92
93
94
95
96
SBIN
2,069
2,114
2,141
2,186
2,213
SESAGOA
173
177
181
185
188
SIEMENS
644
655
665
676
685
STER
89
91
93
95
96
SUNPHARMA
547
561
569
583
592
TATAMOTORS
218
226
231
239
245
TATAPOWER
88
90
91
93
95
TATASTEEL
398
404
408
414
417
TCS
1,213
1,232
1,248
1,267
1,283
WIPRO
396
403
408
415
420
3
Daily Technical Report
June 07, 2012
Research Team Tel: 022 - 39357800
DISCLAIMER
This document is solely for the personal information of the recipient, and must not be singularly used as the basis of any investment
decision. Nothing in this document should be construed as investment or financial advice. Each recipient of this document should make
such investigations as they deem necessary to arrive at an independent evaluation of an investment in the securities of the companies
referred to in this document (including the merits and risks involved), and should consult their own advisors to determine the merits and
risks of such an investment.
Angel Broking Limited, its affiliates, directors, its proprietary trading and investment businesses may, from time to time, make
investment decisions that are inconsistent with or contradictory to the recommendations expressed herein. The views contained in this
document are those of the analyst, and the company may or may not subscribe to all the views expressed within.
Reports based on technical and derivative analysis center on studying charts of a stock's price movement, outstanding positions and
trading volume, as opposed to focusing on a company's fundamentals and, as such, may not match with a report on a company's
fundamentals.
The information in this document has been printed on the basis of publicly available information, internal data and other reliable
sources believed to be true, but we do not represent that it is accurate or complete and it should not be relied on as such, as this
document is for general guidance only. Angel Broking Limited or any of its affiliates/ group companies shall not be in any way
responsible for any loss or damage that may arise to any person from any inadvertent error in the information contained in this report.
Angel Broking Limited has not independently verified all the information contained within this document. Accordingly, we cannot testify,
nor make any representation or warranty, express or implied, to the accuracy, contents or data contained within this document. While
Angel Broking Limited endeavours to update on a reasonable basis the information discussed in this material, there may be regulatory,
compliance, or other reasons that prevent us from doing so.
This document is being supplied to you solely for your information, and its contents, information or data may not be reproduced,
redistributed or passed on, directly or indirectly.
Angel Broking Limited and its affiliates may seek to provide or have engaged in providing corporate finance, investment banking or
other advisory services in a merger or specific transaction to the companies referred to in this report, as on the date of this report or in
the past.
Neither Angel Broking Limited, nor its directors, employees or affiliates shall be liable for any loss or damage that may arise from or in
connection with the use of this information.
Note: Please refer to the important `Stock Holding Disclosure' report on the Angel website (Research Section). Also, please refer to the
latest update on respective stocks for the disclosure status in respect of those stocks. Angel Broking Limited and its affiliates may have
investment positions in the stocks recommended in this report.
Research Team
Shardul Kulkarni
-
Head - Technicals
Sameet Chavan
-
Technical Analyst
Sacchitanand Uttekar
-
Technical Analyst
Mehul Kothari
-
Technical Analyst
Ankur Lakhotia
-
Technical Analyst
Angel Broking Pvt. Ltd.
Registered Office: G-1, Ackruti Trade Centre, Rd. No. 7, MIDC, Andheri (E), Mumbai - 400 093.
Corporate Office: 6th Floor, Ackruti Star, MIDC, Andheri (E), Mumbai - 400 093. Tel: (022) 3952 6600
Sebi Registration No: INB 010996539
4