Daily Technical Report
May 07, 2012
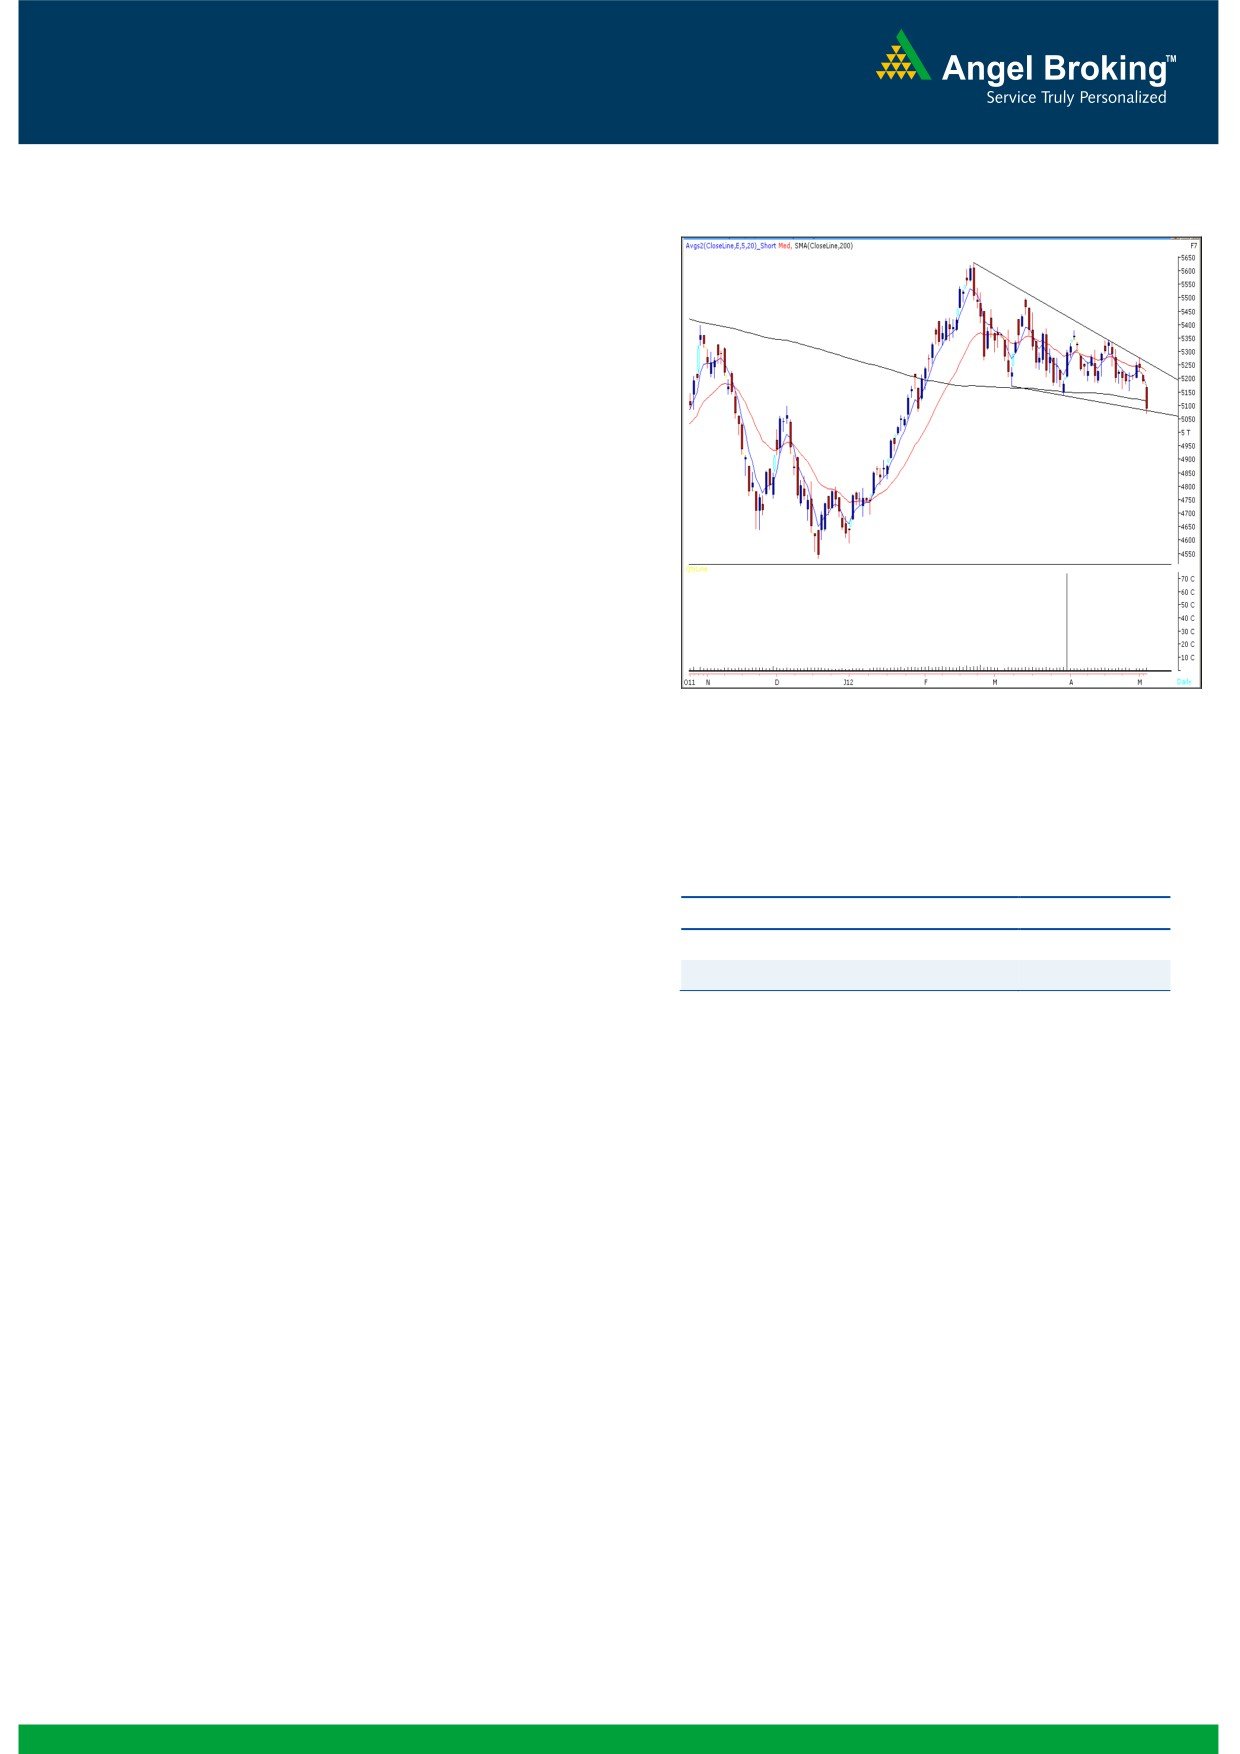
Exhibit 1: Nifty Daily Chart
Sensex (16831) / NIFTY (5087)
On Friday, our benchmark indices opened with a
downside gap and traded with negative bias
throughout the day to close with a loss of almost 2%.
Indices have broken the major support level of 16920
/5135 and have closed below the same, which is sign
of further weakness. On sectoral front, most of the
sectors contributed in Friday’s selloff, where Capital
Goods, Banking and Metal counter were among the
major losers. The advance to decline ratio was
strongly in favor of declining counters (A=744
Formation
The 200-day SMA (Simple Moving Average) and
Source: Falcon
20-day EMA (Exponential Moving Average) have
now shifted to 17100 / 5120 and 17220 /
5225, respectively.
The ‘20-Week EMA’ is placed at 17200 / 5200
level.
Actionable points:
We are now witnessing a negative crossover in
View
Bearish
weekly ‘5 & 20 EMA’.
Support Levels
5000 - 4950
We are observing a continuation pattern which
Resistance Levels
5110 - 5165
resembles a ‘Falling Wedge’.
Indices have now tested 16830 / 5080 which is
However it must be noted that at present markets are
the 50% Fibonacci Retracement level of the rise
hovering around the
50% Fibonacci Retracement
from 15135 / 4531 (Low on December 23,
level of the steep rise from 15135 / 4531 to 18524 /
2011) to 18524 / 5630 (High on February,
5630. The mentioned level is at 16830 / 5080 and
2012).
considered as a decent technical support. In addition,
Trading strategy:
we are observing that markets are moving in a
continuation pattern called as ‘Falling Wedge’ (Refer
We have been mentioning a trading range of 17530
Exhibit 1). The break out from the said pattern will
to 16920 / 5345 to 5135 in the last couple of reports.
be confirmed only if indices close above the upper
Markets have now closed below ‘200-day SMA’ and
trend line level of 17300 / 5230. This may boost the
’20-week EMA’ level on account of selling on Friday’s
buying interest among market participants and
session. We are now observing a negative crossover
eventually indices may rally higher to test 17530 -
in weekly ‘5 & 20 EMA’. The impact of this technical
17664 - 17871 / 5342 - 5380 - 5445 levels.
signal would be witnessed if indices sustain below
Market participants are advised to take positions post
Friday’s low of 16776 / 5080. In this scenario, selling
clarification of the GAAR issue as it would have a
pressure may persist and indices are likely to drift
significant impact on trader sentiment.
lower to test 16600 - 16430 / 5000 - 4950 levels.
1
Daily Technical Report
May 07, 2012
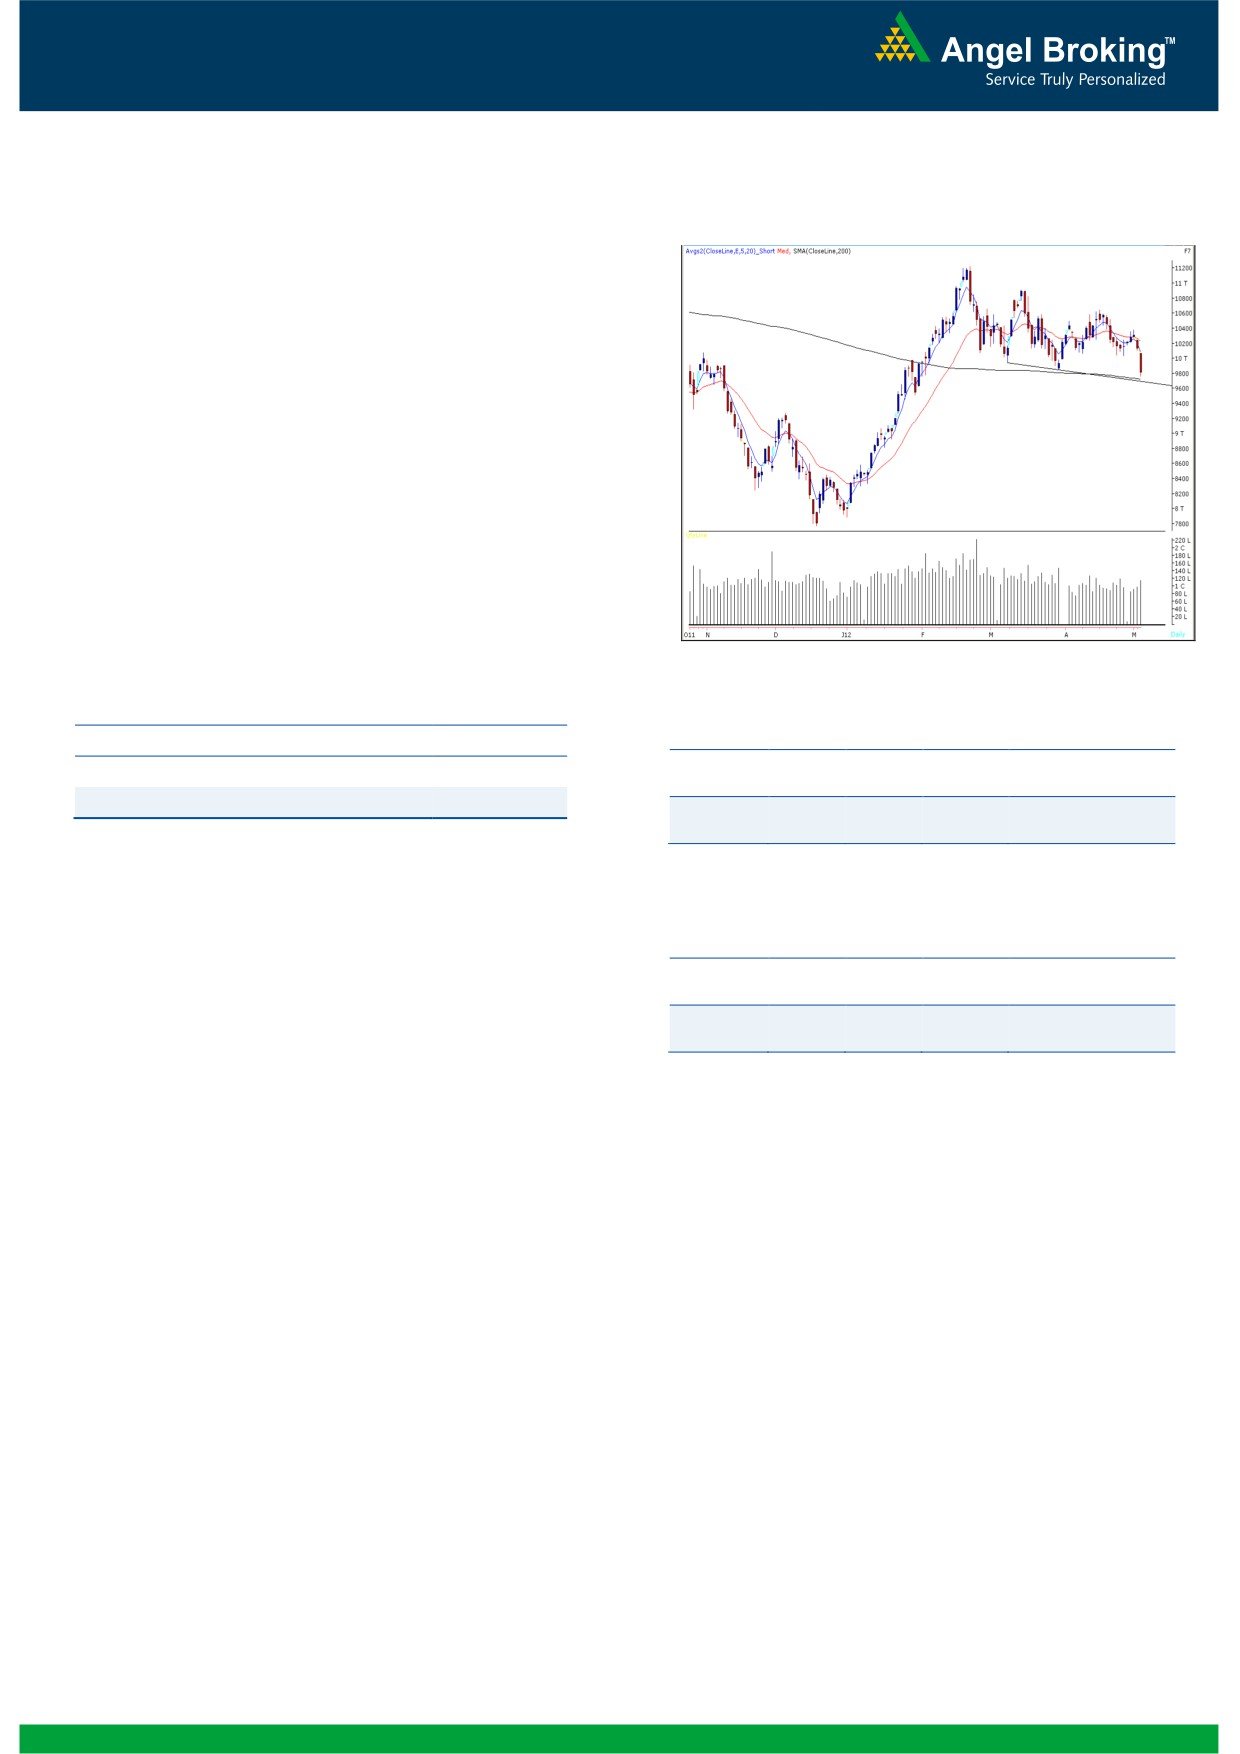
Bank Nifty Outlook - (9802)
Exhibit 2: Bank Nifty Daily Chart
On Friday, Bank Nifty for the second consecutive
session opened with a downside gap in line with our
benchmark indices and selling pressure was seen
throughout the day. At this juncture, index has taken
support near it “200 - day SMA” which coincides with
the trend line support formed by joining the lows of
March 7th, 2012 and March 29th, 2012. However,
we are witnessing a confirmation of “Lower Top and
Lower Bottom” formation on daily chart. Going
forward a breach and close below the “200 - day
SMA” will result in further selling pressure and the
index may test 9579 level. On the upside 10000 -
10070 are likely to act as resistance in coming
trading session.
Source: Falcon
Actionable points:
View
Neutral
Positive Bias:
Stock
Positive Expected
Resistance Levels
10000 -10070
CMP
Remarks
Name
Above
Target
Support Levels
9699 -9579
View will be
CIPLA
326
330
358
negated below 315
Negative Bias:
Stock
Negative Expected
CMP
Remarks
Name
Below
Target
Ambuja
View will be
142.3
141
130
Cement
negated above 146
2
Daily Technical Report
May 07, 2012
Daily Pivot Levels for Nifty 50 Stocks
SCRIPS
S2
S1
PIVOT
R1
R2
SENSEX
16,565
16,698
16,910
17,043
17,254
NIFTY
5,005
5,046
5,112
5,153
5,218
BANKNIFTY
9,565
9,684
9,876
9,995
10,187
ACC
1,184
1,196
1,209
1,221
1,234
AMBUJACEM
138
140
143
145
148
ASIANPAINT
3,545
3,580
3,615
3,650
3,685
AXISBANK
968
989
1,020
1,040
1,071
BAJAJ-AUTO
1,451
1,477
1,518
1,544
1,585
BANKBARODA
644
666
703
724
762
BHARTIARTL
307
309
312
315
318
BHEL
203
208
217
223
232
BPCL
635
643
656
665
678
CAIRN
321
327
337
343
353
CIPLA
314
320
325
331
335
COALINDIA
322
326
332
336
343
DLF
175
179
182
186
189
DRREDDY
1,721
1,734
1,748
1,762
1,776
GAIL
310
316
321
326
331
GRASIM
2,359
2,388
2,432
2,461
2,505
HCLTECH
501
507
515
521
528
HDFC
650
655
663
668
675
HDFCBANK
523
530
542
549
561
HEROMOTOCO
1,909
1,943
2,000
2,034
2,091
HINDALCO
112
114
116
118
121
HINDUNILVR
428
431
435
438
441
ICICIBANK
796
815
834
853
872
IDFC
110
112
114
117
119
INFY
2,380
2,411
2,454
2,486
2,529
ITC
233
235
240
243
248
JINDALSTEL
463
474
487
498
510
JPASSOCIAT
69
70
71
72
73
KOTAKBANK
548
556
567
575
586
LT
1,096
1,122
1,158
1,183
1,219
M&M
670
678
690
699
711
MARUTI
1,247
1,264
1,278
1,295
1,308
NTPC
152
153
156
157
160
ONGC
252
256
262
266
272
PNB
767
785
814
833
861
POWERGRID
105
106
107
108
110
RANBAXY
489
494
500
505
511
RELIANCE
711
719
729
737
747
RELINFRA
477
486
500
508
522
SAIL
90
92
94
96
98
SBIN
1,934
1,965
2,017
2,048
2,100
SESAGOA
176
178
183
185
189
SIEMENS
730
740
755
764
779
STER
98
100
102
103
105
SUNPHARMA
591
596
602
607
613
TATAMOTORS
292
297
300
305
309
TATAPOWER
97
99
100
102
103
TATASTEEL
418
425
436
443
453
TCS
1,246
1,261
1,278
1,294
1,311
WIPRO
407
411
415
419
424
3
Daily Technical Report
May 07, 2012
Research Team Tel: 022 - 39357800
DISCLAIMER
This document is solely for the personal information of the recipient, and must not be singularly used as the basis of any investment
decision. Nothing in this document should be construed as investment or financial advice. Each recipient of this document should make
such investigations as they deem necessary to arrive at an independent evaluation of an investment in the securities of the companies
referred to in this document (including the merits and risks involved), and should consult their own advisors to determine the merits and
risks of such an investment.
Angel Broking Limited, its affiliates, directors, its proprietary trading and investment businesses may, from time to time, make
investment decisions that are inconsistent with or contradictory to the recommendations expressed herein. The views contained in this
document are those of the analyst, and the company may or may not subscribe to all the views expressed within.
Reports based on technical and derivative analysis center on studying charts of a stock's price movement, outstanding positions and
trading volume, as opposed to focusing on a company's fundamentals and, as such, may not match with a report on a company's
fundamentals.
The information in this document has been printed on the basis of publicly available information, internal data and other reliable
sources believed to be true, but we do not represent that it is accurate or complete and it should not be relied on as such, as this
document is for general guidance only. Angel Broking Limited or any of its affiliates/ group companies shall not be in any way
responsible for any loss or damage that may arise to any person from any inadvertent error in the information contained in this report.
Angel Broking Limited has not independently verified all the information contained within this document. Accordingly, we cannot testify,
nor make any representation or warranty, express or implied, to the accuracy, contents or data contained within this document. While
Angel Broking Limited endeavours to update on a reasonable basis the information discussed in this material, there may be regulatory,
compliance, or other reasons that prevent us from doing so.
This document is being supplied to you solely for your information, and its contents, information or data may not be reproduced,
redistributed or passed on, directly or indirectly.
Angel Broking Limited and its affiliates may seek to provide or have engaged in providing corporate finance, investment banking or
other advisory services in a merger or specific transaction to the companies referred to in this report, as on the date of this report or in
the past.
Neither Angel Broking Limited, nor its directors, employees or affiliates shall be liable for any loss or damage that may arise from or in
connection with the use of this information.
Note: Please refer to the important `Stock Holding Disclosure' report on the Angel website (Research Section). Also, please refer to the
latest update on respective stocks for the disclosure status in respect of those stocks. Angel Broking Limited and its affiliates may have
investment positions in the stocks recommended in this report.
Research Team
Shardul Kulkarni
-
Head - Technicals
Sameet Chavan
-
Technical Analyst
Sacchitanand Uttekar
-
Technical Analyst
Mehul Kothari
-
Technical Analyst
Ankur Lakhotia
-
Technical Analyst
Angel Broking Pvt. Ltd.
Registered Office: G-1, Ackruti Trade Centre, Rd. No. 7, MIDC, Andheri (E), Mumbai - 400 093.
Corporate Office: 6th Floor, Ackruti Star, MIDC, Andheri (E), Mumbai - 400 093. Tel: (022) 3952 6600
Sebi Registration No: INB 010996539
4