Technical Research | March 07, 2012
Daily Technical Report
Sensex (17173) / NIFTY (5222)
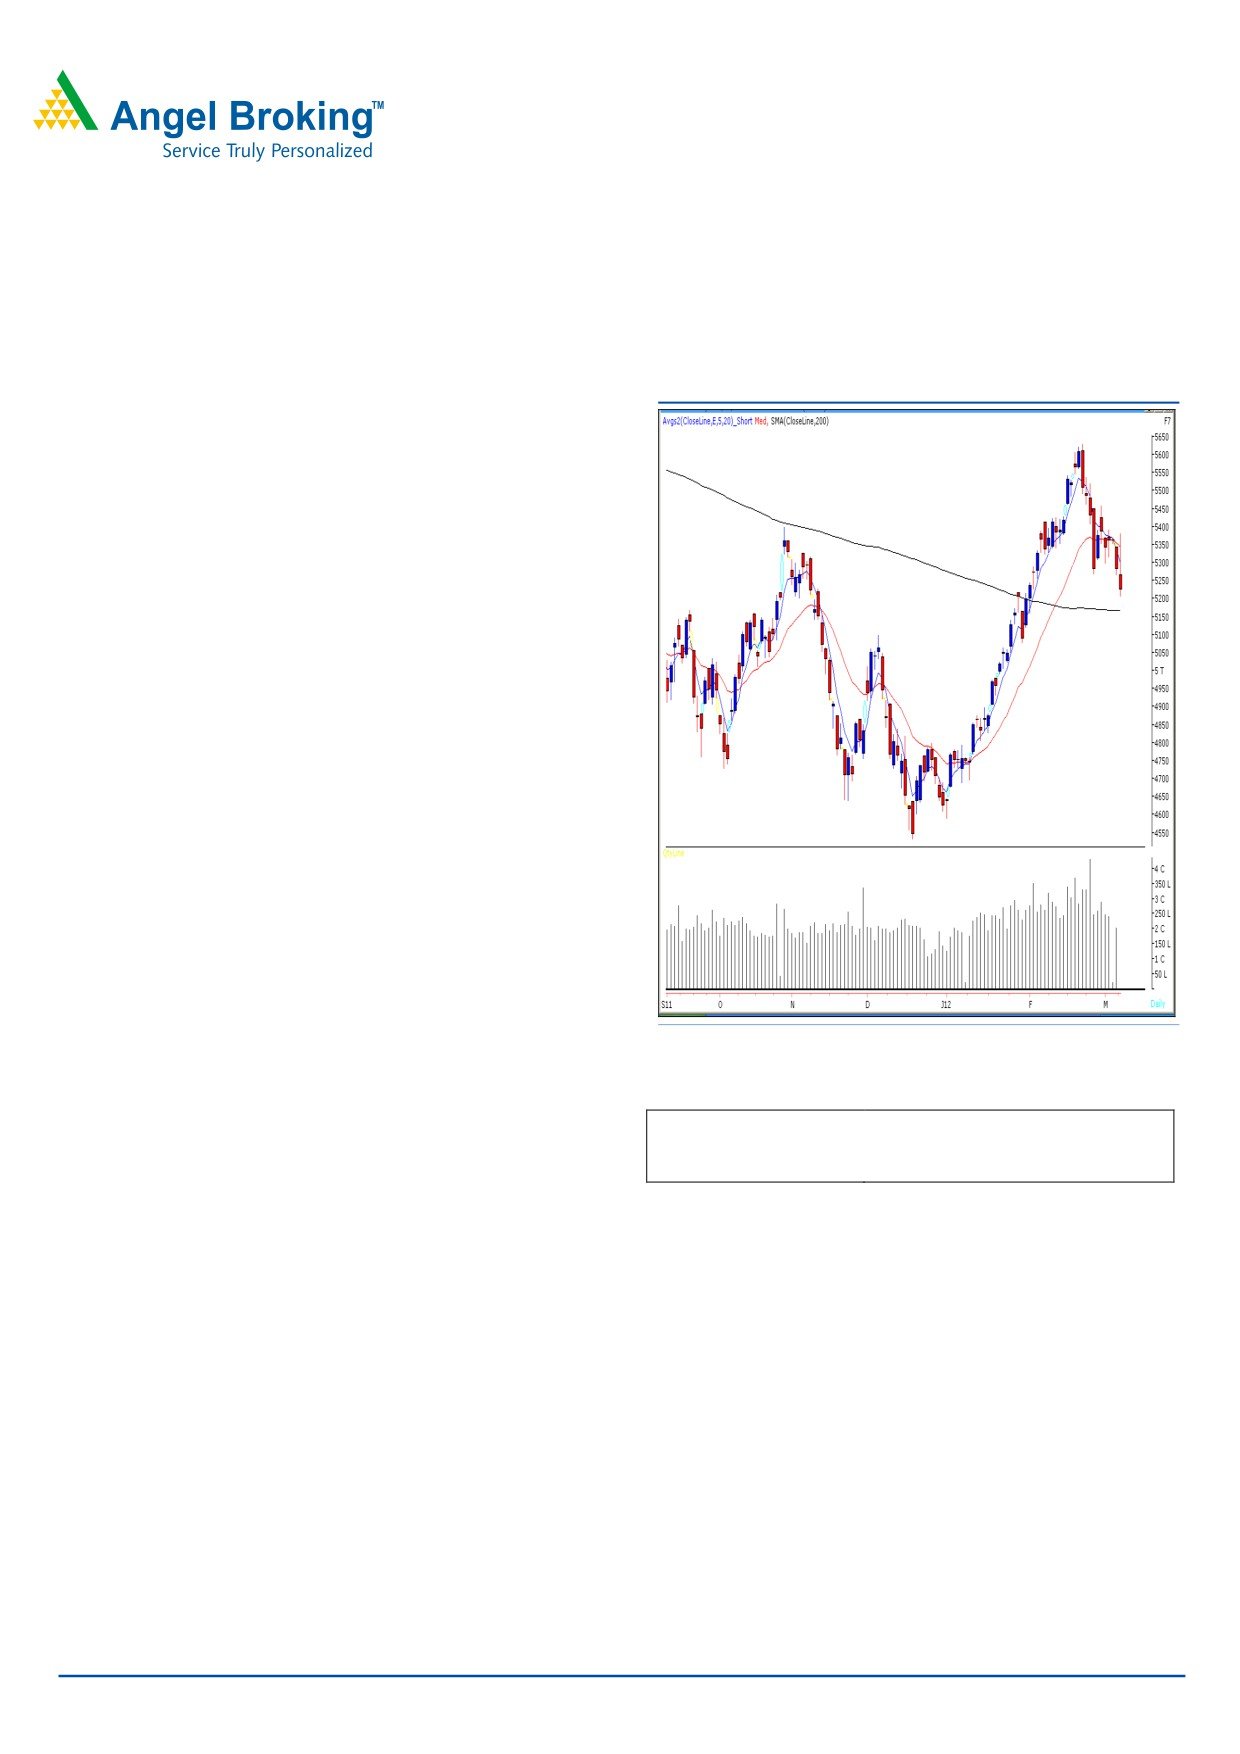
Exhibit 1: Nifty Daily Chart
Once again for the second consecutive session, markets
opened on a pessimistic note in-line with weak global cues.
As expected, we witnessed an extremely volatile session on
account of the results from the UP elections. Massive
selling pressure dragged indices significantly lower in the
second half to close well inside the negative territory for
the day. On the sectoral front, Metal, Power and Capital
goods counters were among the major losers, whereas
FMCG and Consumer Durables sectors ended on a positive
side. The advance to decline ratio was strongly in favor of
declining counters. (A=1063 D=1746) (Source
-
Formation:
• The 200-day SMA and 20-day EMA have now shifted to
17180 / 5167 and 17682 / 5362, respectively.
• The 38.8 % and 50 % Fibonacci retracement of the rise
from 15135 / 4530 to 18524 / 5630 levels are at
17230 / 5210 and 16830 / 5080 respectively.
Source: Falcon
Actionable points:
Trading strategy:
View
Neutral
Yesterday, indices tumbled significantly lower to test
Resistance Levels
5265 - 5382
mentioned support level of 17230 / 5210. The rise in the
Support level
5167 / 5080
dollar index and a weakening rupee continue to impede
trader sentiment in Indian markets. At this juncture, indices
are hovering around the “200-day SMA” support zone
17230 - 17180 / 5210 - 5167. We are the opinion that
indices may take support around these levels as “200-
day SMA” is considered as strong support level. In case
the markets break this support zone then Indices may
head further lower to test the 16830 / 5080 mark. On
the upside, 17312 - 17692 / 5265 - 5382 levels may
act as strong resistance in coming trading session.
For Private Circulation Only |
1
Technical Research | March 07, 2012
Bank Nifty Outlook - (10058)
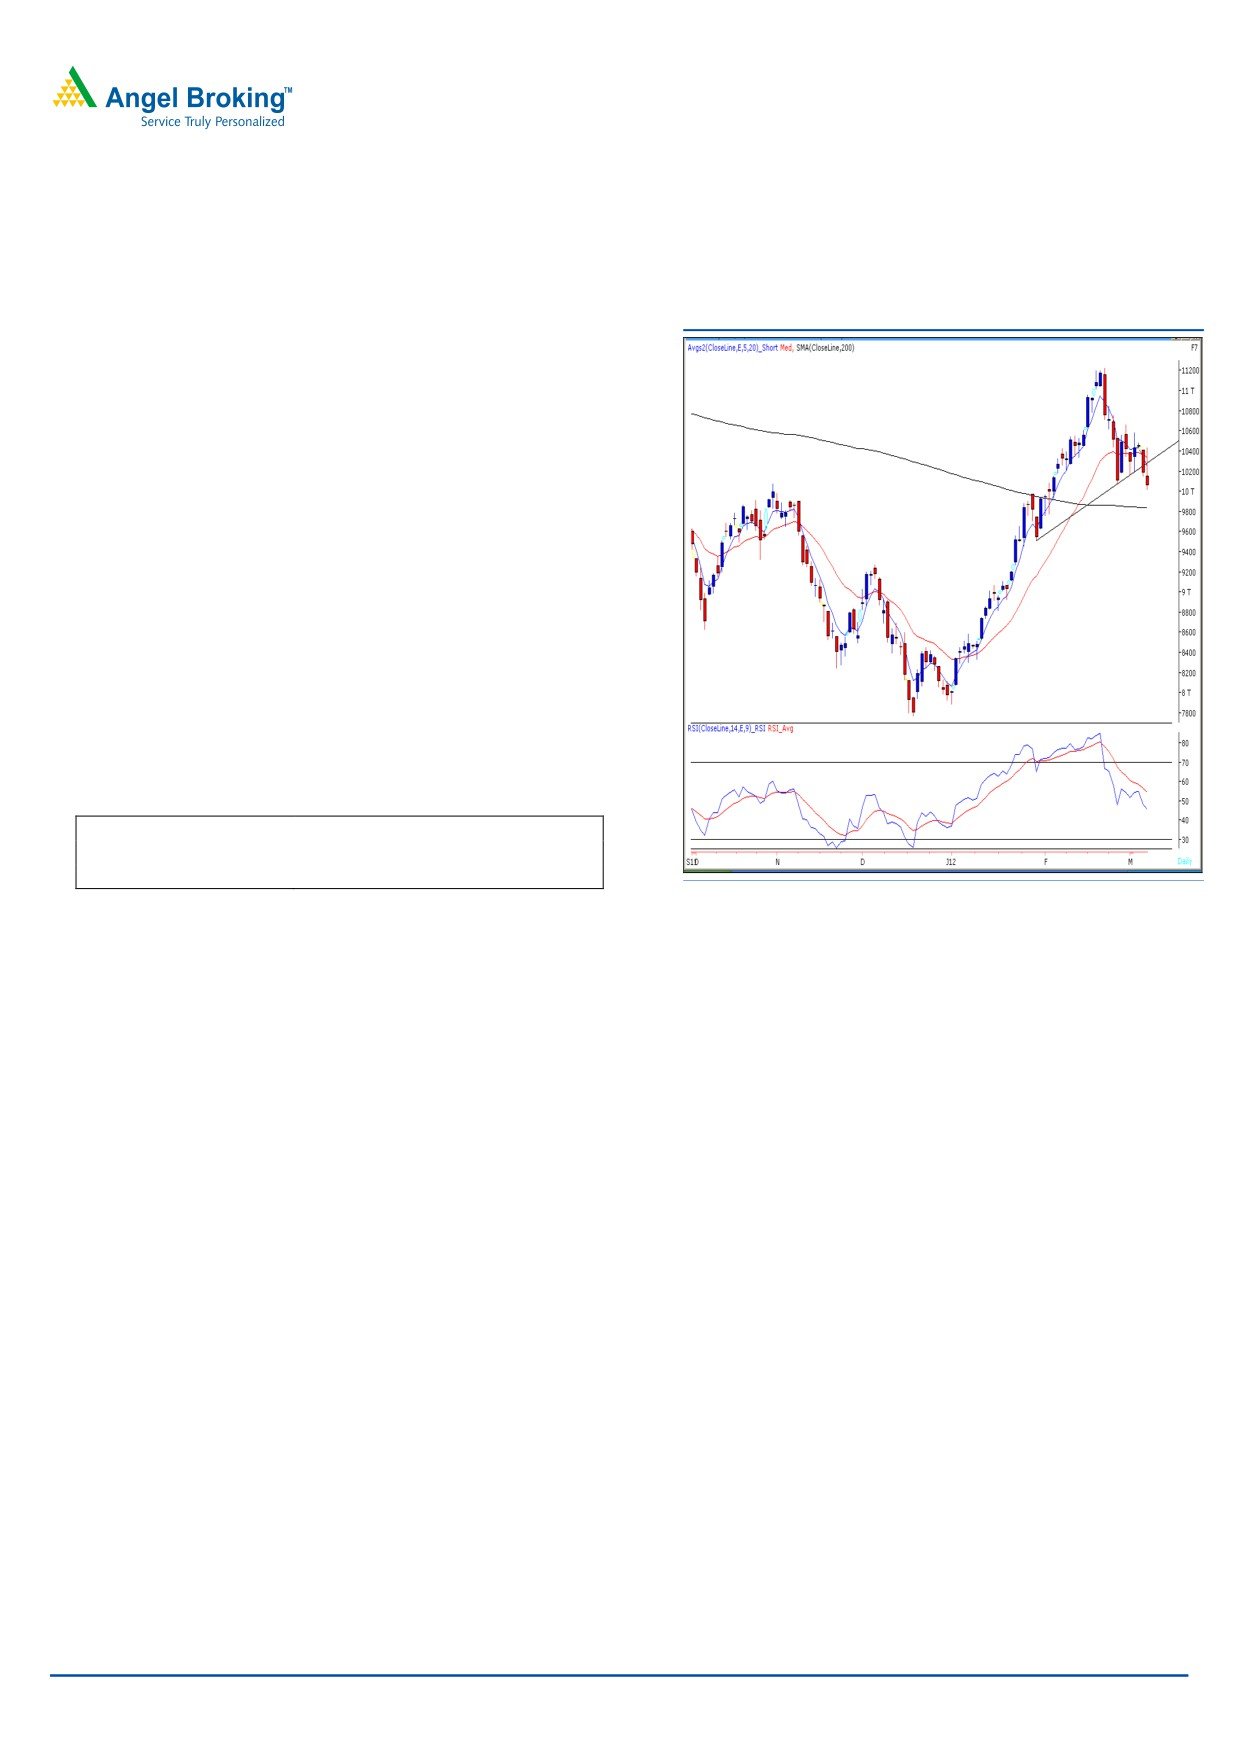
Exhibit 2: Bank Nifty Daily Chart
Yesterday, Bank Nifty opened on a pessimistic note and
traded with extreme volatility throughout the session. The
trend line breakdown formed by joining the lows of
January 30, 2012 - February 27, 2012 is still intact. As
stated in our previous report the “RSI” momentum
oscillator has dropped below 50 and when coupled with
negative crossover in “5 & 20 EMA”, suggests further
weakness in the index. Thus, if Bank Nifty sustains below
yesterday’s low of 10020 then it is likely to drift towards
the support zone 9900 - 9843 .On the upside 10340 -
10460 levels are likely to act as resistance in coming
trading session.
Actionable points:
View
Negative Below 10020
Expected Target
9900 - 9838
Resistance Levels
10340 - 10460
Source: Falcon
For Private Circulation Only |
2
Technical Research | March 07, 2012
Positive Bias:
Positive
Expected
Stock Name
CMP
5 Day EMA
20 Day EMA
Remarks
Above
Target
View will change below
ITC
210.4
208
206.7
211.7
218
205
Negative Bias:
Negative
Expected
Stock Name
CMP
5 Day EMA
20 Day EMA
Remarks
Below
Target
View will change above
Delta Corp
71.4
74.6
76.3
71
65
74.1
For Private Circulation Only |
3
Technical Research | March 07, 2012
Daily Pivot Levels for Nifty 50 Stocks
SCRIPS
S2
S1
PIVOT
R1
R2
SENSEX
16,767
16,970
17,331
17,534
17,895
NIFTY
5,095
5,159
5,270
5,334
5,446
BANKNIFTY
9,755
9,906
10,172
10,324
10,590
ACC
1,252
1,272
1,294
1,314
1,335
AMBUJACEM
157
159
161
163
165
AXISBANK
1,057
1,102
1,151
1,196
1,245
BAJAJ-AUTO
1,618
1,661
1,708
1,751
1,798
BHARTIARTL
324
330
340
346
357
BHEL
255
265
282
293
310
BPCL
651
660
670
679
689
CAIRN
344
352
364
372
384
CIPLA
298
302
309
313
319
COALINDIA
319
325
330
336
341
DLF
178
188
196
206
214
DRREDDY
1,639
1,664
1,687
1,712
1,734
GAIL
340
346
351
357
363
HCLTECH
466
474
483
490
499
HDFC
639
645
656
662
672
HDFCBANK
493
500
511
518
528
HEROMOTOCO
1,749
1,810
1,871
1,933
1,994
HINDALCO
123
128
135
139
146
HINDUNILVR
373
377
382
385
390
ICICIBANK
824
839
865
880
906
IDFC
132
136
141
146
151
INFY
2,766
2,809
2,845
2,888
2,923
ITC
203
207
209
213
216
JINDALSTEL
517
532
558
573
599
JPASSOCIAT
63
66
69
73
76
KOTAKBANK
532
542
555
564
578
LT
1,181
1,208
1,258
1,285
1,335
M&M
660
671
681
692
702
MARUTI
1,278
1,305
1,327
1,354
1,377
NTPC
169
172
176
179
183
ONGC
276
279
284
287
292
PNB
893
913
941
961
988
POWERGRID
109
110
111
112
113
RANBAXY
401
407
416
423
432
RCOM
86
89
94
97
102
RELIANCE
752
764
787
799
822
RELINFRA
570
594
637
661
704
RPOWER
115
120
130
135
145
SAIL
86
89
94
97
102
SBIN
2,027
2,088
2,175
2,236
2,323
SESAGOA
189
193
202
207
216
SIEMENS
746
766
780
801
815
STER
107
111
116
120
126
SUNPHARMA
547
553
561
567
574
SUZLON
26
26
27
28
29
TATAMOTORS
255
261
270
276
285
TATAPOWER
103
106
110
113
117
TATASTEEL
400
413
435
447
469
TCS
1,172
1,187
1,204
1,219
1,236
WIPRO
420
426
433
439
445
Technical Research Team
For Private Circulation Only |
4
Technical Report
RESEARCH TEAM
Shardul Kulkarni
Head - Technicals
Sameet Chavan
Technical Analyst
Sacchitanand Uttekar
Technical Analyst
Mehul Kothari
Technical Analyst
Ankur Lakhotia
Technical Analyst
Research Team: 022-3952 6600
DISCLAIMER: This document is not for public distribution and has been furnished to you solely for your information and must not
be reproduced or redistributed to any other person. Persons into whose possession this document may come are required to observe
these restrictions.
Opinion expressed is our current opinion as of the date appearing on this material only. While we endeavor to update on a
reasonable basis the information discussed in this material, there may be regulatory, compliance, or other reasons that prevent us
from doing so. Prospective investors and others are cautioned that any forward-looking statements are not predictions and may be
subject to change without notice. Our proprietary trading and investment businesses may make investment decisions that are
inconsistent with the recommendations expressed herein.
The information in this document has been printed on the basis of publicly available information, internal data and other reliable
sources believed to be true and are for general guidance only. While every effort is made to ensure the accuracy and completeness of
information contained, the company takes no guarantee and assumes no liability for any errors or omissions of the information. No
one can use the information as the basis for any claim, demand or cause of action.
Recipients of this material should rely on their own investigations and take their own professional advice. Each recipient of this
document should make such investigations as it deems necessary to arrive at an independent evaluation of an investment in the
securities of companies referred to in this document (including the merits and risks involved), and should consult their own advisors to
determine the merits and risks of such an investment. Price and value of the investments referred to in this material may go up or
down. Past performance is not a guide for future performance. Certain transactions - futures, options and other derivatives as well as
non-investment grade securities - involve substantial risks and are not suitable for all investors. Reports based on technical analysis
centers on studying charts of a stock's price movement and trading volume, as opposed to focusing on a company's fundamentals
and as such, may not match with a report on a company's fundamentals.
We do not undertake to advise you as to any change of our views expressed in this document. While we would endeavor to update
the information herein on a reasonable basis, Angel Broking, its subsidiaries and associated companies, their directors and
employees are under no obligation to update or keep the information current. Also there may be regulatory, compliance, or other
reasons that may prevent Angel Broking and affiliates from doing so. Prospective investors and others are cautioned that any
forward-looking statements are not predictions and may be subject to change without notice.
Angel Broking Limited and affiliates, including the analyst who has issued this report, may, on the date of this report, and from time
to time, have long or short positions in, and buy or sell the securities of the companies mentioned herein or engage in any other
transaction involving such securities and earn brokerage or compensation or act as advisor or have other potential conflict of interest
with respect to company/ies mentioned herein or inconsistent with any recommendation and related information and opinions.
Angel Broking Limited and affiliates may seek to provide or have engaged in providing corporate finance, investment banking or
other advisory services in a merger or specific transaction to the companies referred to in this report, as on the date of this report or
in the past.
Sebi Registration No : INB 010996539
For Private Circulation Only |