Daily Technical Report
August 06, 2012
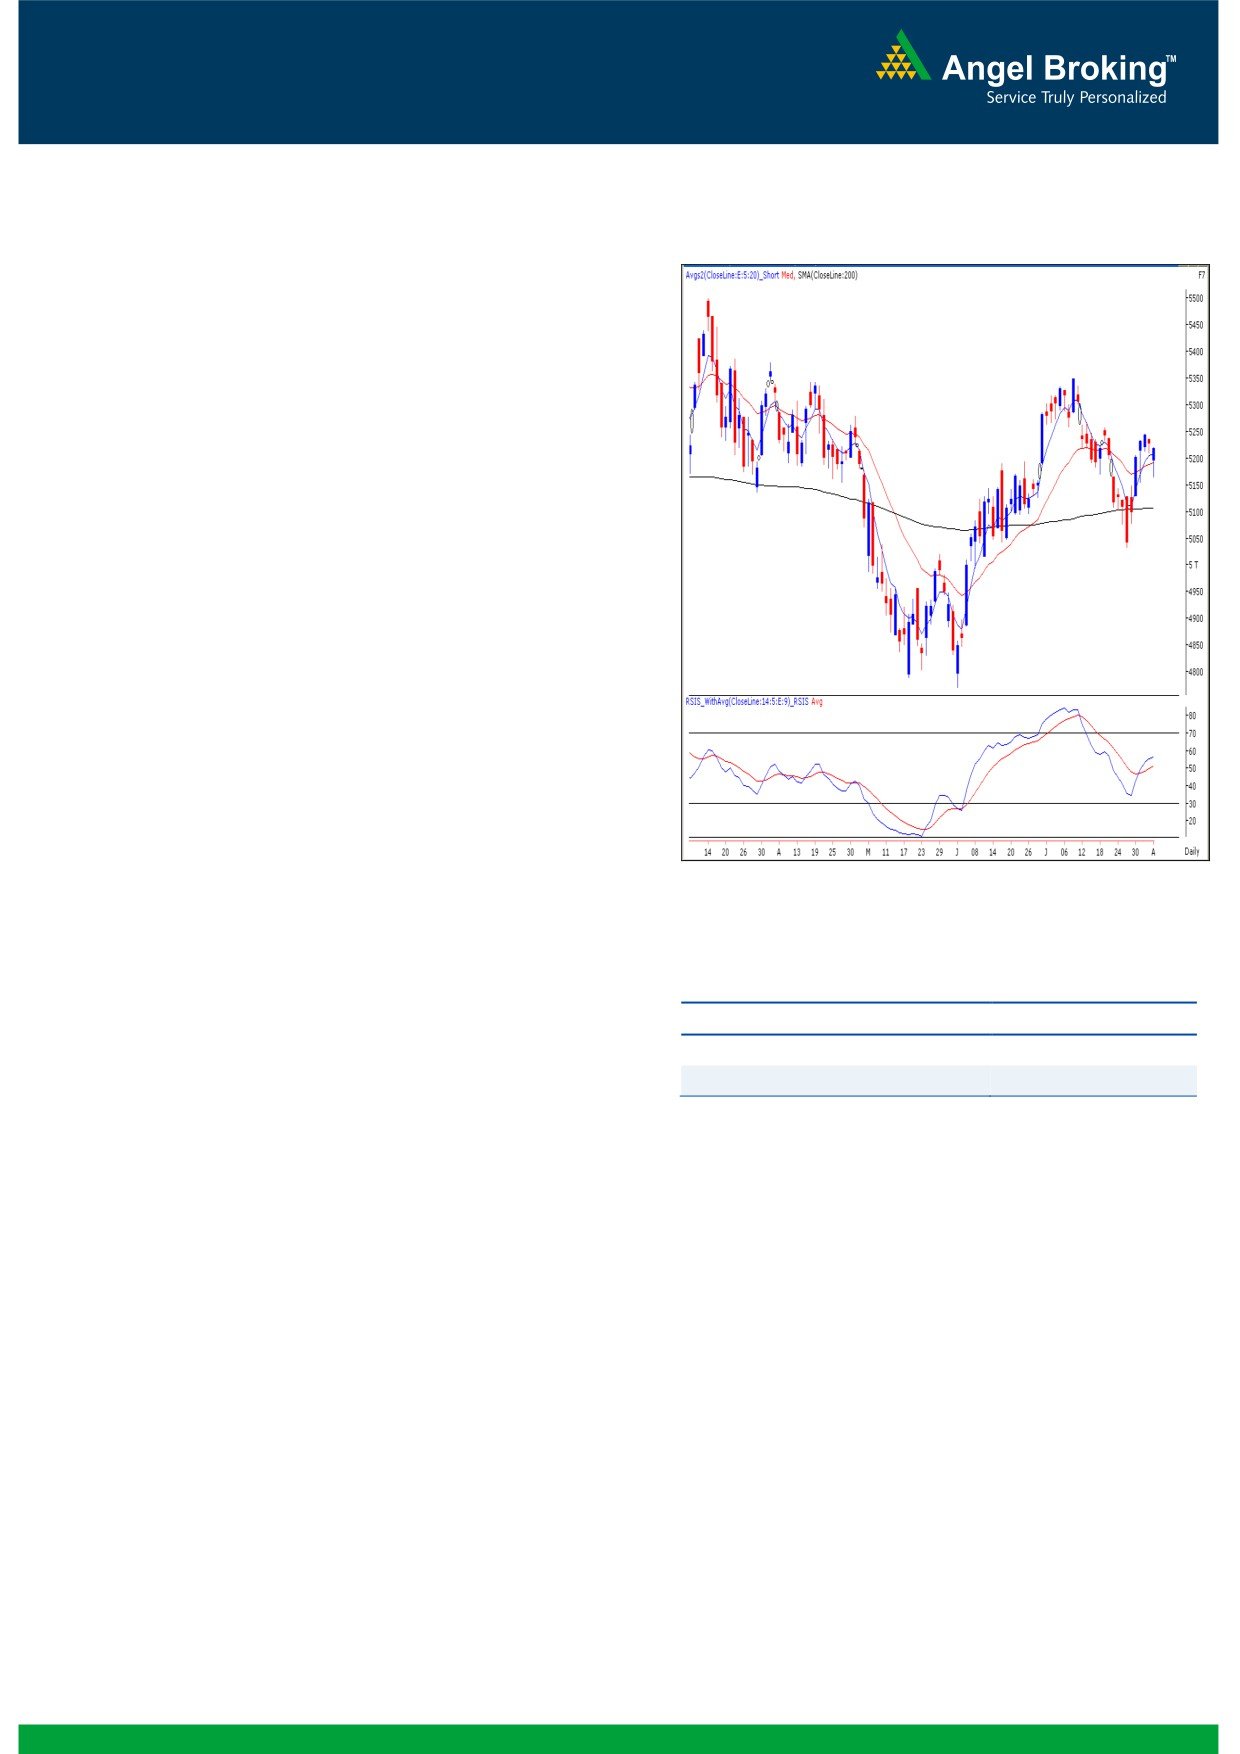
Exhibit 1: Nifty Daily Chart
Sensex (17198) / NIFTY (5216)
After opening with a downward gap on Friday, our
benchmark indices traded in a range during the first
half of the trading session. However, indices pared
losses in second half of trade from the mentioned
support level of 17004 / 5154 to close above the
5200 mark. On the sectoral front, Oil & Gas,
Healthcare and IT sectors closed in the positive
territory; whereas Metal, Auto and Banking counters
remained under pressure. The advance to decline
ratio was in favor of declining counters (A=1263
Formation
The weekly
50% and
61.8% Fibonacci
retracement levels of the rise from 15748 /
4770 (June 08, 2012) to 17631 / 5349 (July 13,
2012) are seen at 16690 / 5059 and 16467 /
4991 levels, respectively.
On the weekly chart, we are witnessing a
“Downward Sloping Trend Line” resistance near
Source: Falcon
17500 / 5325 formed by joining the highs of
21109 / 6339 (November 5, 2010) - 18524 /
Actionable points:
5630 (February 24, 2012).
The ’20-day EMA’ and
’200-day SMA’ are
View
Neutral
placed at 17110 / 5190 and 16879 / 5100
Resistance Levels
5267 - 5300
levels, respectively.
Support Levels
5194 - 5154
The positive crossover in daily ‘RSI
-
Smoothened’ oscillator and ‘5 & 20 EMA’ is still
intact.
At this juncture, few technical tools such as, ‘RSI -
Smoothened’ oscillator and ‘5 & 20 Day EMA’ are
positively poised. Hence, a move beyond 17292 /
Trading strategy:
5247 level may push indices higher to test 17466 -
As expected, indices rallied sharply during the first
17631 / 5300 - 5349 levels. These levels almost
half of the week. Comments from ECB chief Mario
coincide with the “Downward Sloping Trend Line”
Draghi were initially considered as negative as there
resistance near 17500 / 5325 formed by joining the
were no signs of immediate liquidity boost to equity
highs of 21109 / 6339 (November 5, 2010) -
markets. However the fact that the ECB stressed on
18524 /
5630 (February
24,
2012. Conversely,
Governments across Europe to take policy measures
markets have a decent support around 17004 /
was later seen as a silver lining. Domestically, after
5154 level. A breach of this level would augment
opening with a downward gap on Friday our markets
pessimism and indices are then likely to test 16598 -
found support around Tuesday’s low of 17004 /
16467 / 5032 - 4991 levels. Range bound activity
5154 level and bounced back sharply to close above
between 16598 / 5032 and 17631 / 5349 is likely to
5200 mark. Going forward, the weekly high of
continue for the coming 2 weeks.
17292 / 5247 would act an important resistance for
the markets.
1
Daily Technical Report
August 06, 2012
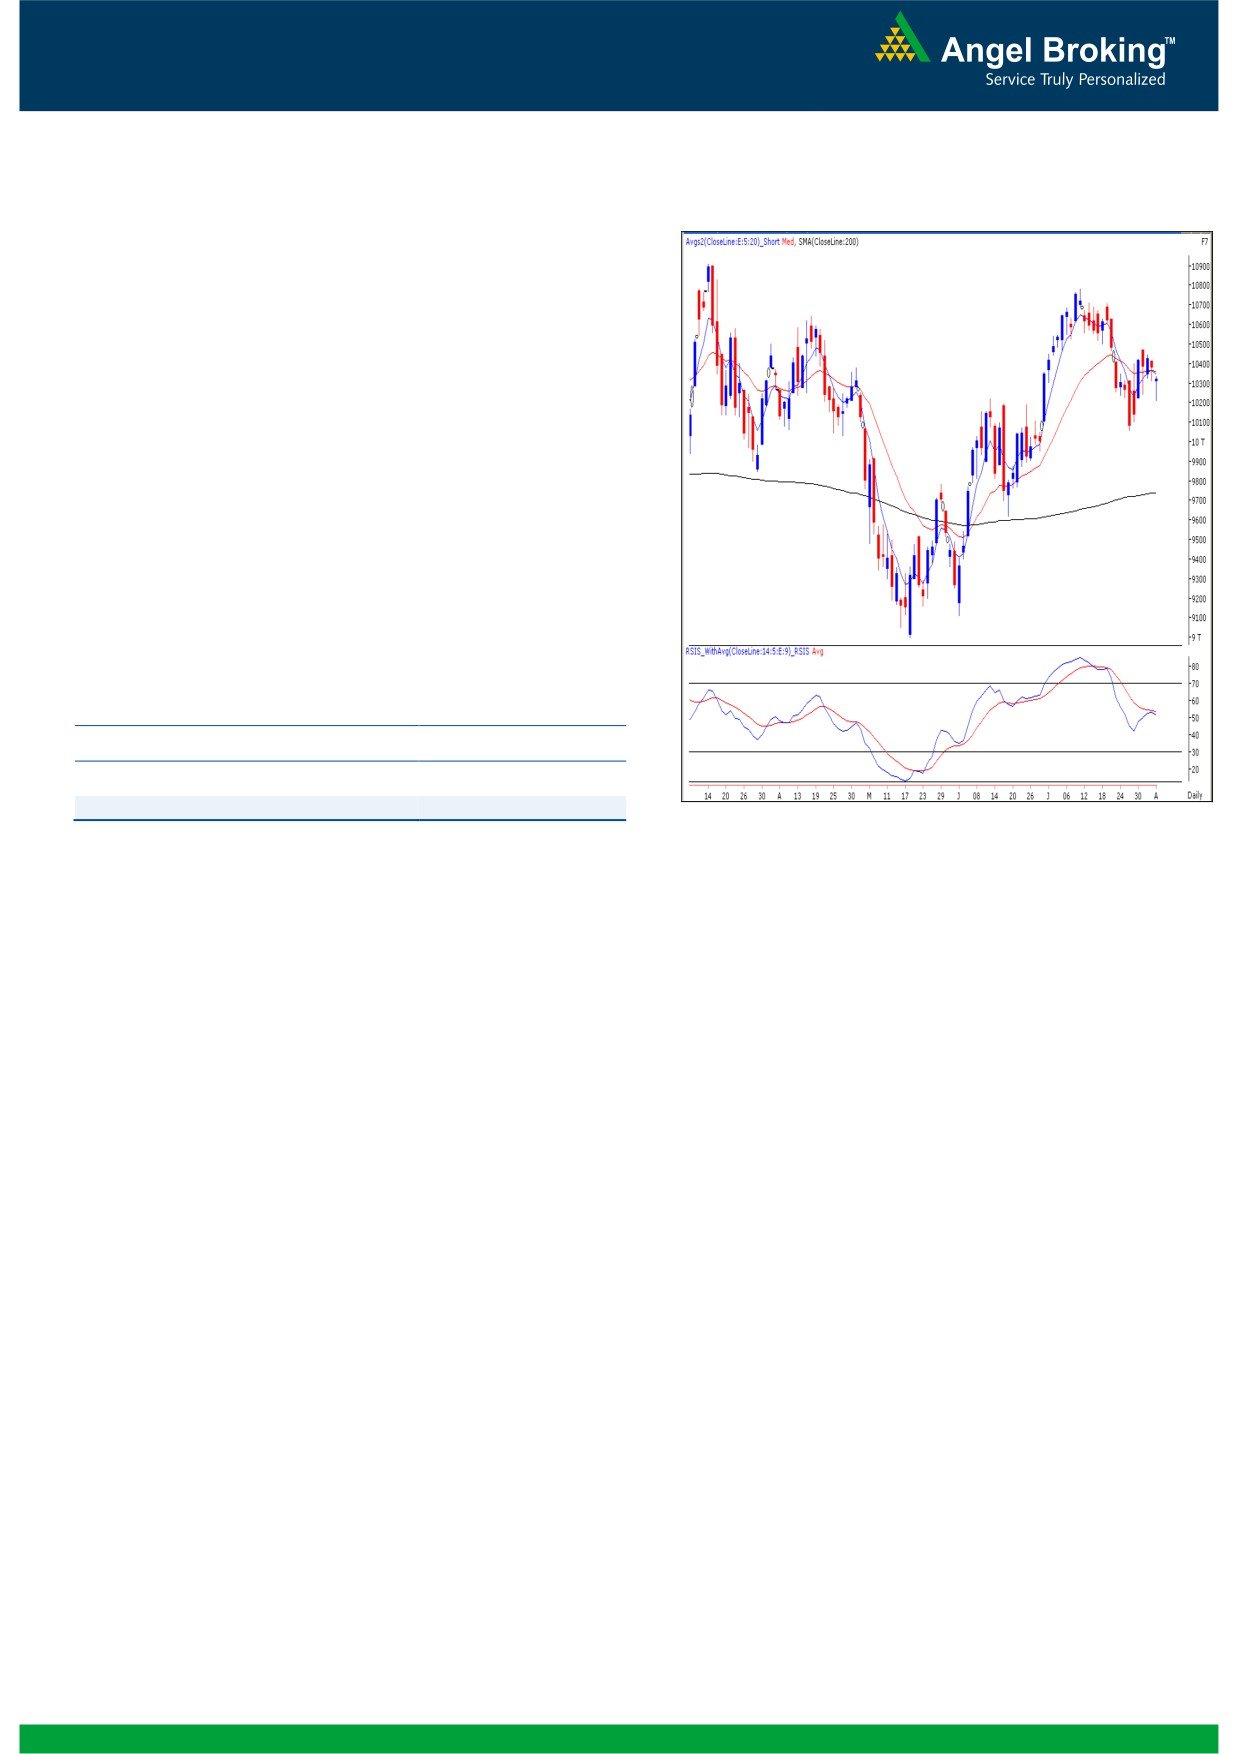
Bank Nifty Outlook - (10316)
Exhibit 2: Bank Nifty Daily Chart
On Friday, similar to the Nifty, the Bank Nifty too
opened with a downside gap and drifted lower
towards the mentioned range of 10500 - 10150
during first half of the session. However, buying
emerged near the lower end of the range during
second half of the session which led the index to close
near the initial opening level. We reiterate our view
that the index is likely to be in the range of 10500 -
10150. Only a break outside the said range will
dictate a clear direction of the trend. In the mentioned
range the 10468 mark is likely to act as immediate
resistance in coming trading session and on the
downside 10200 may act as support for the day
Actionable points:
View
Neutral
Resistance Levels
10392- 10445
Support Level
10290 - 10235
Source: Falcon
2
Daily Technical Report
August 06, 2012
Daily Pivot Levels for Nifty 50 Stocks
SCRIPS
S2
S1
PIVOT
R1
R2
SENSEX
16,963
17,080
17,144
17,262
17,326
NIFTY
5,145
5,180
5,200
5,236
5,256
BANKNIFTY
10,160
10,238
10,287
10,365
10,414
ACC
1,300
1,304
1,310
1,314
1,320
AMBUJACEM
179
181
183
185
187
ASIANPAINT
3,573
3,665
3,717
3,809
3,861
AXISBANK
1,022
1,032
1,041
1,051
1,060
BAJAJ-AUTO
1,585
1,598
1,608
1,621
1,632
BANKBARODA
640
645
650
655
660
BHARTIARTL
291
294
297
299
302
BHEL
215
220
223
228
231
BPCL
340
346
352
358
364
CAIRN
322
328
332
338
342
CIPLA
341
345
350
354
358
COALINDIA
331
338
341
348
351
DLF
200
204
206
210
212
DRREDDY
1,632
1,653
1,665
1,686
1,699
GAIL
345
351
355
361
366
GRASIM
2,869
2,890
2,907
2,928
2,946
HCLTECH
515
519
521
525
527
HDFC
684
692
696
704
708
HDFCBANK
576
582
586
592
595
HEROMOTOCO
1,937
1,948
1,961
1,972
1,984
HINDALCO
114
115
117
118
120
HINDUNILVR
463
465
467
469
472
ICICIBANK
922
931
941
950
961
IDFC
128
129
131
132
133
INFY
2,171
2,190
2,204
2,222
2,236
ITC
256
258
259
261
263
JINDALSTEL
387
392
397
402
408
JPASSOCIAT
71
72
73
75
76
KOTAKBANK
538
542
549
553
560
LT
1,335
1,359
1,377
1,400
1,419
M&M
675
680
686
690
696
MARUTI
1,102
1,112
1,118
1,127
1,134
NTPC
159
163
166
169
172
ONGC
273
277
279
283
285
PNB
705
723
733
751
761
POWERGRID
116
117
118
119
120
RANBAXY
486
498
507
518
527
RELIANCE
723
733
740
750
758
RELINFRA
487
495
502
510
516
SAIL
82
84
85
86
87
SBIN
1,959
1,982
1,998
2,022
2,038
SESAGOA
178
180
182
184
186
SIEMENS
652
662
669
678
685
STER
100
101
102
103
104
SUNPHARMA
642
651
657
666
672
TATAMOTORS
214
217
220
223
226
TATAPOWER
95
96
97
98
99
TATASTEEL
387
392
397
402
407
TCS
1,210
1,223
1,232
1,245
1,254
WIPRO
332
339
344
352
356
3
Daily Technical Report
August 06, 2012
Research Team Tel: 022 - 39357800
DISCLAIMER
This document is solely for the personal information of the recipient, and must not be singularly used as the basis of any investment
decision. Nothing in this document should be construed as investment or financial advice. Each recipient of this document should make
such investigations as they deem necessary to arrive at an independent evaluation of an investment in the securities of the companies
referred to in this document (including the merits and risks involved), and should consult their own advisors to determine the merits and
risks of such an investment.
Angel Broking Limited, its affiliates, directors, its proprietary trading and investment businesses may, from time to time, make
investment decisions that are inconsistent with or contradictory to the recommendations expressed herein. The views contained in this
document are those of the analyst, and the company may or may not subscribe to all the views expressed within.
Reports based on technical and derivative analysis center on studying charts of a stock's price movement, outstanding positions and
trading volume, as opposed to focusing on a company's fundamentals and, as such, may not match with a report on a company's
fundamentals.
The information in this document has been printed on the basis of publicly available information, internal data and other reliable
sources believed to be true, but we do not represent that it is accurate or complete and it should not be relied on as such, as this
document is for general guidance only. Angel Broking Limited or any of its affiliates/ group companies shall not be in any way
responsible for any loss or damage that may arise to any person from any inadvertent error in the information contained in this report.
Angel Broking Limited has not independently verified all the information contained within this document. Accordingly, we cannot testify,
nor make any representation or warranty, express or implied, to the accuracy, contents or data contained within this document. While
Angel Broking Limited endeavours to update on a reasonable basis the information discussed in this material, there may be regulatory,
compliance, or other reasons that prevent us from doing so.
This document is being supplied to you solely for your information, and its contents, information or data may not be reproduced,
redistributed or passed on, directly or indirectly.
Angel Broking Limited and its affiliates may seek to provide or have engaged in providing corporate finance, investment banking or
other advisory services in a merger or specific transaction to the companies referred to in this report, as on the date of this report or in
the past.
Neither Angel Broking Limited, nor its directors, employees or affiliates shall be liable for any loss or damage that may arise from or in
connection with the use of this information.
Note: Please refer to the important `Stock Holding Disclosure' report on the Angel website (Research Section). Also, please refer to the
latest update on respective stocks for the disclosure status in respect of those stocks. Angel Broking Limited and its affiliates may have
investment positions in the stocks recommended in this report.
Research Team
Shardul Kulkarni
-
Head - Technicals
Sameet Chavan
-
Technical Analyst
Sacchitanand Uttekar
-
Technical Analyst
Mehul Kothari
-
Technical Analyst
Ankur Lakhotia
-
Technical Analyst
Angel Broking Pvt. Ltd.
Registered Office: G-1, Ackruti Trade Centre, Rd. No. 7, MIDC, Andheri (E), Mumbai - 400 093.
Corporate Office: 6th Floor, Ackruti Star, MIDC, Andheri (E), Mumbai - 400 093. Tel: (022) 3952 6600
Sebi Registration No: INB 010996539
4