Technical Research | March 06, 2012
Daily Technical Report
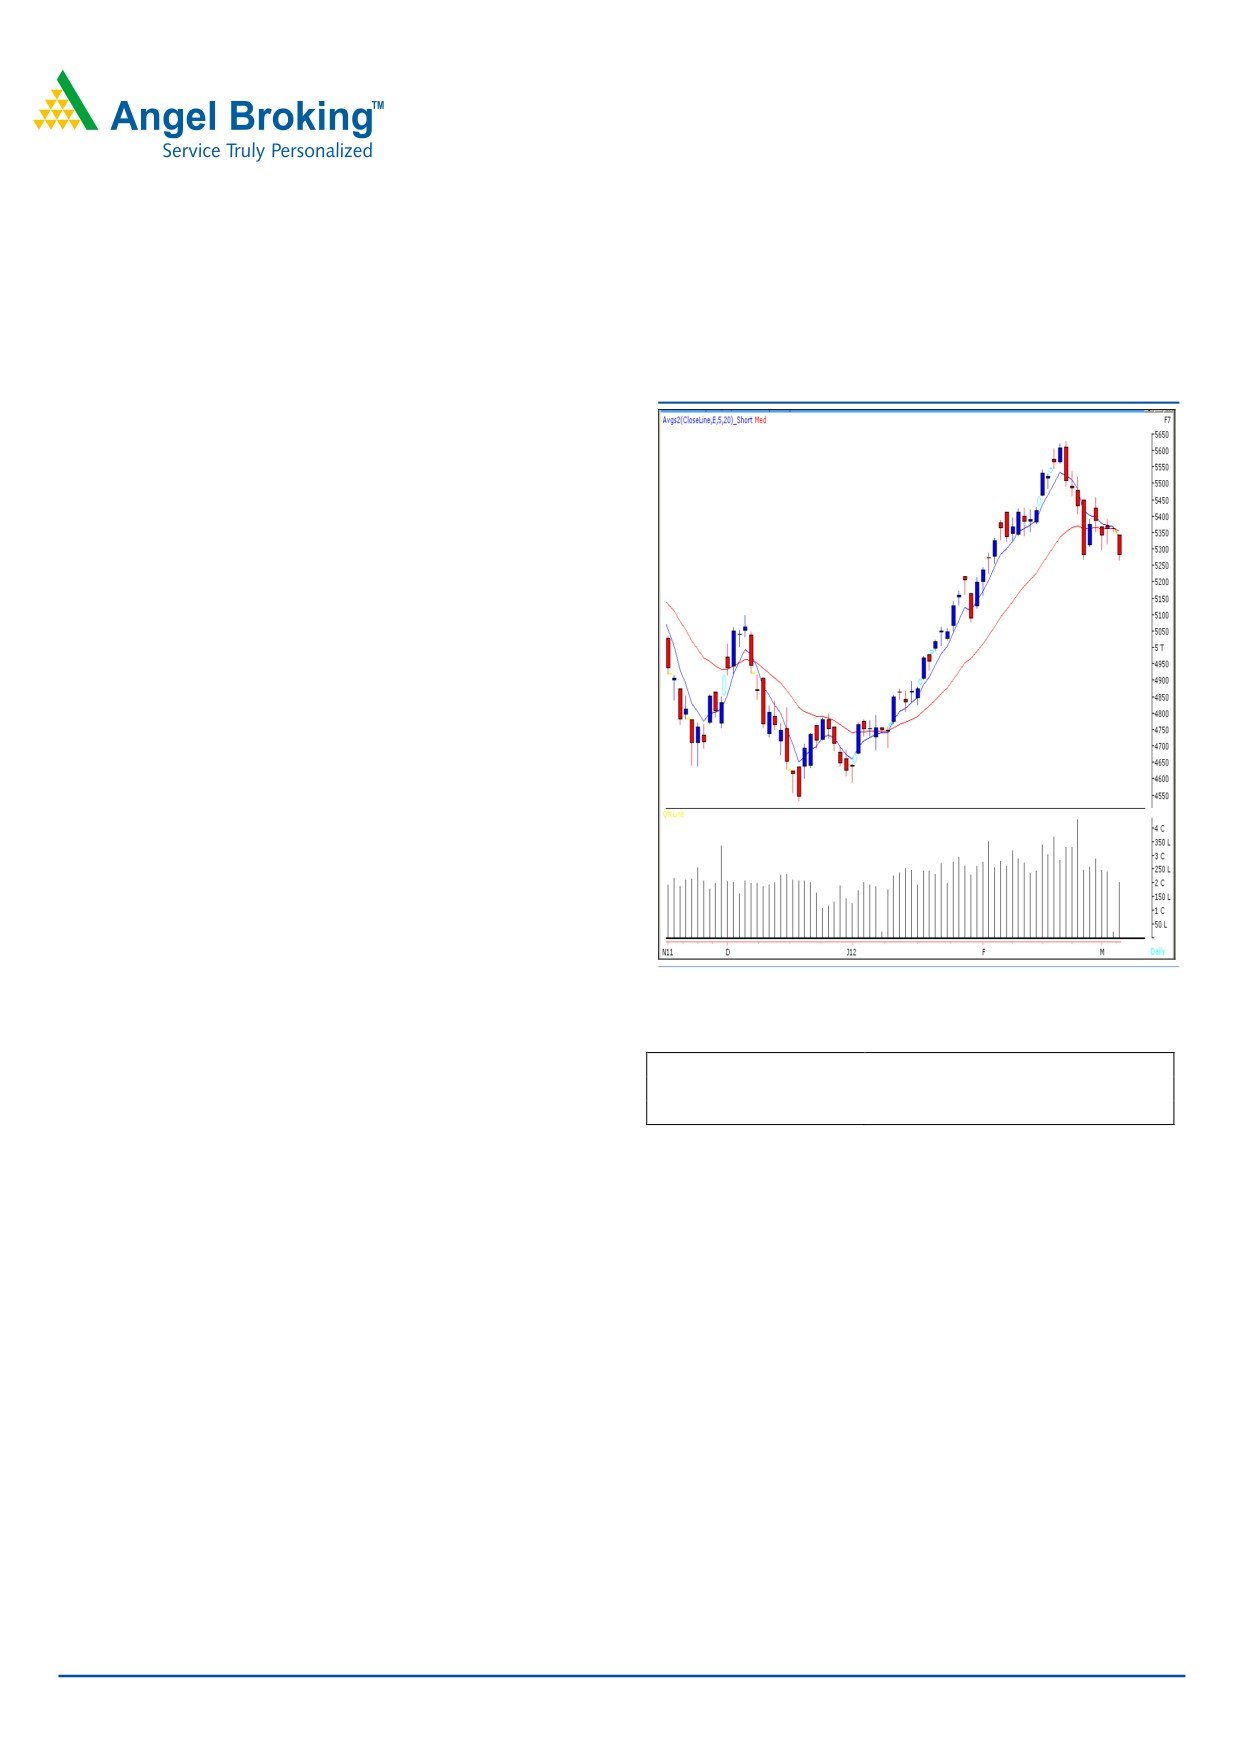
Sensex (17363) / NIFTY (5280)
Exhibit 1: Nifty Daily Chart
The week has begun on a pessimistic note, as markets
opened with a downside gap and continued to trade with
negative bias throughout the session. The anxiety amongst
market participants with regards to the political
developments in Uttar Pradesh was clearly visible and
volumes remained subdued in comparison to average. On
the sectoral front, Realty, Metal and Banking counters were
among the major losers, whereas FMCG sector ended with
a nominal gain. The advance to decline ratio was strongly
in favor of declining counters. (A=981 D=1851) (Source -
Formation:
• The 200-day SMA and 20-day EMA have now shifted to
17180 / 5167 and 17682 / 5362, respectively.
• The weekly “Stochastic” oscillator is still negatively
poised.
Source: Falcon
Actionable points:
Trading strategy:
View
Negative Below 5265
After a weak opening, indices continued to drift further
Expected Targets
5210 - 5167
down as the day progressed on the back of negative global
Resistance levels
5297 - 5345
cues and rupee appreciation. Volumes remained lower as
participants are awaiting clarity on the election results in
On the upside, 17463 - 17600 / 5297 - 5345 levels may
Uttar Pradesh. As mentioned in our previous report, 17381
act as strong resistance in coming trading session. Traders
/ 5268 level provided decent support for the markets during
should take a note that the coming trading session is
yesterday’s session. Considering the global clues it is likely
likely to witness extreme volatility on account of the
that our markets will open with a negative bias. Going
results from the UP elections.
forward, if indices manage to sustain below yesterday’s low
of 13312 / 5265, then they are likely to slide further
towards the 200-day SMA” support zone of 17230 -
17180 / 5210 - 5167.
For Private Circulation Only |
1
Technical Research | March 06, 2012
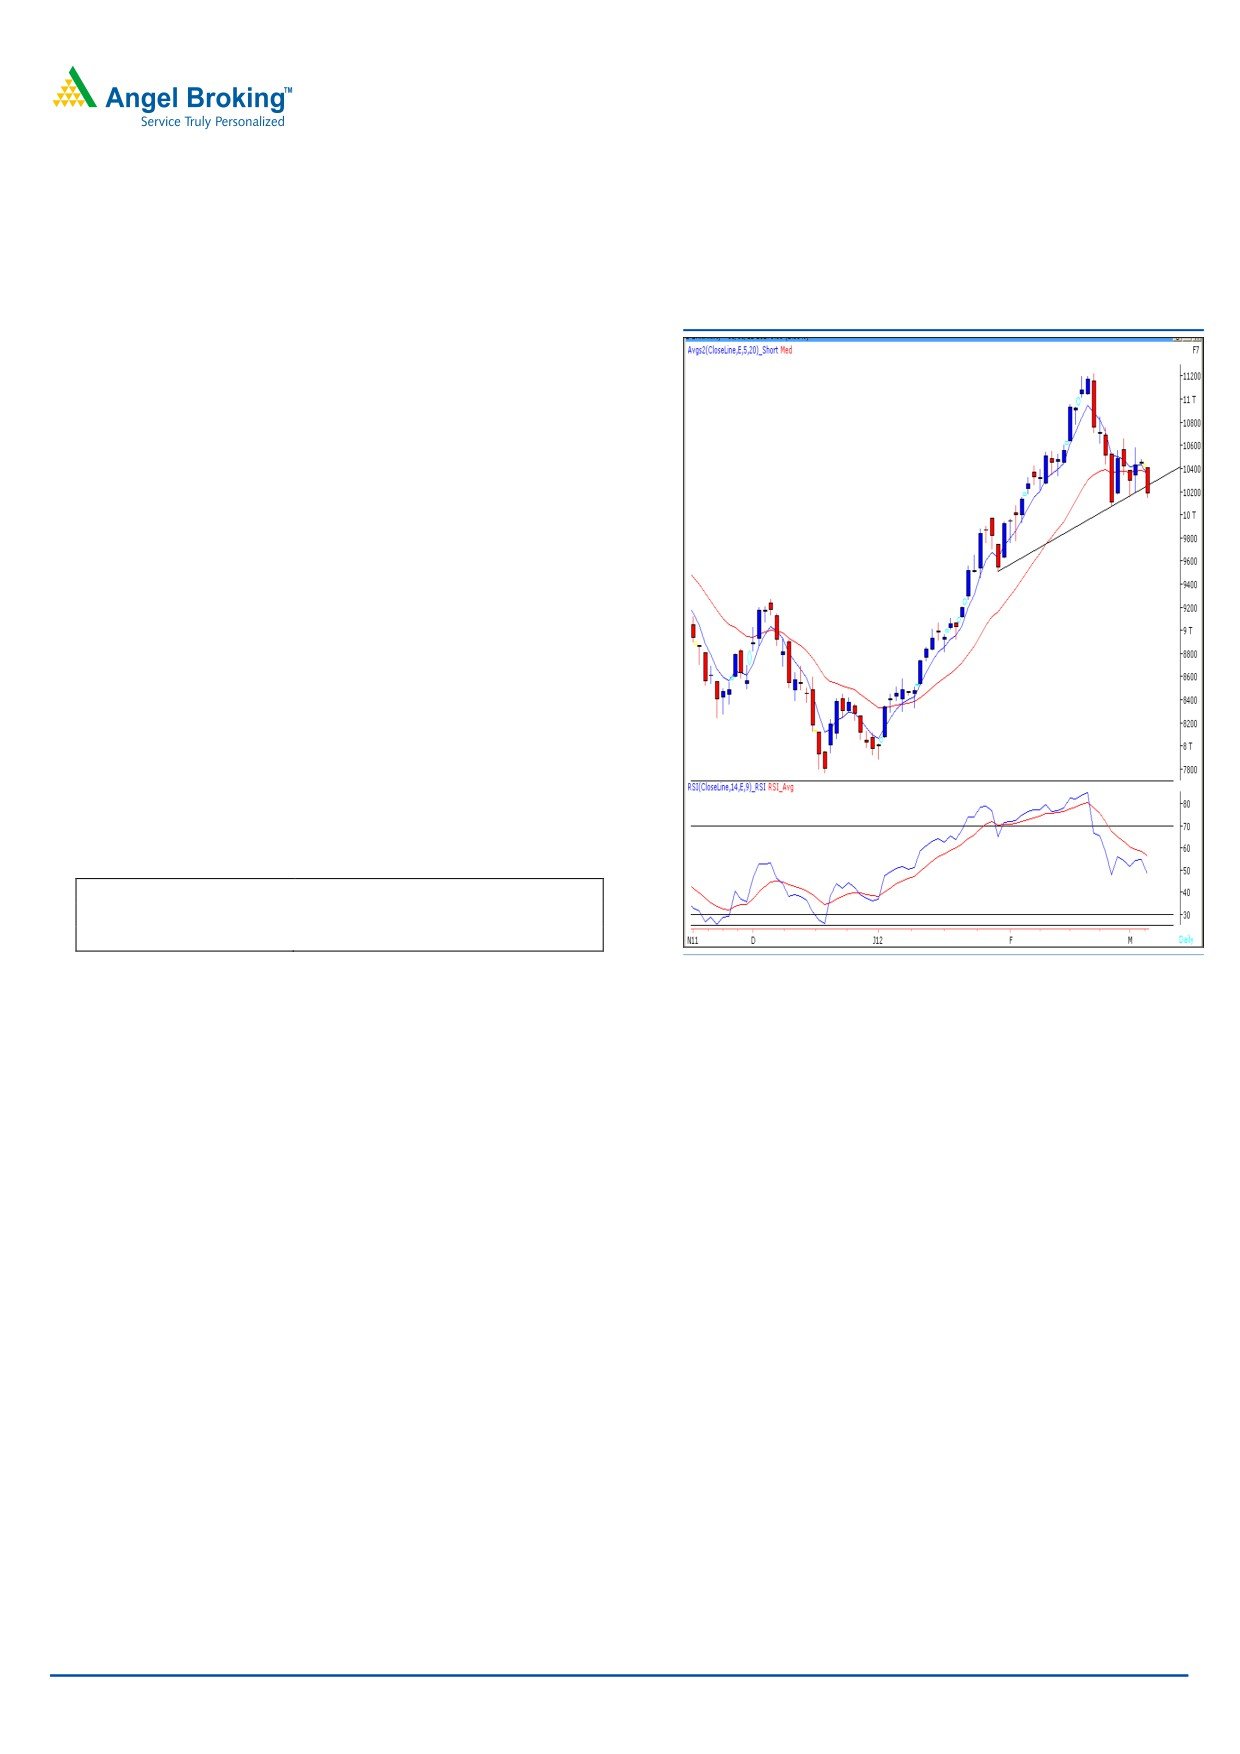
Bank Nifty Outlook - (10179)
Exhibit 2: Bank Nifty Daily Chart
Yesterday, Bank Nifty opened with a minor downside gap
and selling pressure dominated throughout the session.
This led the index to close marginally below the lower end
of the mentioned range of 10800 - 10200. We are now
witnessing a trend line breakdown formed by joining the
lows of January 30, 2012 - February 27, 2012 coupled
with negative crossover in “5 & 20 EMA”. The “RSI”
momentum oscillator has dropped below
50 which
suggest weakness in the index. The effect of these
technical tools will come into force if Bank Nifty sustains
below yesterday’s low of 10152. In such a scenario index
is likely to drift towards 10073 - 9900 levels. On the
upside
10368
-
10407 levels are likely to act as
resistance in coming trading session.
Actionable points:
View
Negative Below 10150
Expected Target
10073 - 9900 - 9838
Resistance Levels
10368 - 10407
Source: Falcon
For Private Circulation Only |
2
Technical Research | March 06, 2012
Positive Bias:
Positive
Expected
Stock Name
CMP
5 Day EMA
20 Day EMA
Remarks
Above
Target
Asian Paints
3234.7
3170.8
3080.8
3250
3365
View will change below
3184
Negative Bias:
Negative
Expected
Stock Name
CMP
5 Day EMA
20 Day EMA
Remarks
Below
Target
Tata Steel
450.7
461
462.7
448.6
432
View will change above
465
Educomp
200.7
208.1
218.8
198.9
186
View will change above
204.5
For Private Circulation Only |
3
Technical Research | March 06, 2012
Daily Pivot Levels for Nifty 50 Stocks
SCRIPS
S2
S1
PIVOT
R1
R2
SENSEX
17,144
17,254
17,422
17,531
17,699
NIFTY
5,218
5,249
5,297
5,328
5,376
BANKNIFTY
9,991
10,085
10,246
10,340
10,501
ACC
1,262
1,281
1,305
1,324
1,349
AMBUJACEM
157
160
164
166
171
AXISBANK
1,128
1,139
1,154
1,165
1,180
BAJAJ-AUTO
1,672
1,687
1,708
1,724
1,745
BHARTIARTL
340
345
350
354
359
BHEL
278
281
287
291
296
BPCL
652
659
670
678
689
CAIRN
365
367
371
374
378
CIPLA
308
310
313
315
318
COALINDIA
322
325
328
331
334
DLF
183
187
195
200
208
DRREDDY
1,655
1,665
1,680
1,690
1,705
GAIL
340
346
359
366
379
HCLTECH
464
472
478
487
493
HDFC
646
652
660
665
673
HDFCBANK
497
504
512
519
528
HEROMOTOCO
1,828
1,857
1,903
1,932
1,978
HINDALCO
135
137
142
145
149
HINDUNILVR
375
379
381
385
387
ICICIBANK
850
860
879
889
907
IDFC
135
137
140
143
146
INFY
2,756
2,783
2,823
2,850
2,891
ITC
202
204
206
209
210
JINDALSTEL
544
556
572
584
600
JPASSOCIAT
67
69
71
73
76
KOTAKBANK
551
555
559
563
568
LT
1,241
1,254
1,272
1,285
1,302
M&M
661
668
676
683
691
MARUTI
1,295
1,305
1,319
1,330
1,344
NTPC
172
174
176
178
180
ONGC
273
278
282
288
292
PNB
906
923
943
961
980
POWERGRID
107
109
111
112
114
RANBAXY
409
413
421
425
432
RCOM
92
94
97
99
102
RELIANCE
782
790
802
810
822
RELINFRA
599
628
653
682
707
RPOWER
128
132
135
139
142
SAIL
84
90
96
102
107
SBIN
2,122
2,149
2,192
2,219
2,262
SESAGOA
201
204
207
209
212
SIEMENS
715
741
768
794
822
STER
117
119
121
122
124
SUNPHARMA
546
552
562
568
579
SUZLON
26
27
28
29
30
TATAMOTORS
263
268
272
278
281
TATAPOWER
110
112
114
116
118
TATASTEEL
438
445
455
461
471
TCS
1,189
1,198
1,210
1,220
1,232
WIPRO
417
424
429
437
442
Technical Research Team
For Private Circulation Only |
4
Technical Report
RESEARCH TEAM
Shardul Kulkarni
Head - Technicals
Sameet Chavan
Technical Analyst
Sacchitanand Uttekar
Technical Analyst
Mehul Kothari
Technical Analyst
Ankur Lakhotia
Technical Analyst
Research Team: 022-3952 6600
DISCLAIMER: This document is not for public distribution and has been furnished to you solely for your information and must not
be reproduced or redistributed to any other person. Persons into whose possession this document may come are required to observe
these restrictions.
Opinion expressed is our current opinion as of the date appearing on this material only. While we endeavor to update on a
reasonable basis the information discussed in this material, there may be regulatory, compliance, or other reasons that prevent us
from doing so. Prospective investors and others are cautioned that any forward-looking statements are not predictions and may be
subject to change without notice. Our proprietary trading and investment businesses may make investment decisions that are
inconsistent with the recommendations expressed herein.
The information in this document has been printed on the basis of publicly available information, internal data and other reliable
sources believed to be true and are for general guidance only. While every effort is made to ensure the accuracy and completeness of
information contained, the company takes no guarantee and assumes no liability for any errors or omissions of the information. No
one can use the information as the basis for any claim, demand or cause of action.
Recipients of this material should rely on their own investigations and take their own professional advice. Each recipient of this
document should make such investigations as it deems necessary to arrive at an independent evaluation of an investment in the
securities of companies referred to in this document (including the merits and risks involved), and should consult their own advisors to
determine the merits and risks of such an investment. Price and value of the investments referred to in this material may go up or
down. Past performance is not a guide for future performance. Certain transactions - futures, options and other derivatives as well as
non-investment grade securities - involve substantial risks and are not suitable for all investors. Reports based on technical analysis
centers on studying charts of a stock's price movement and trading volume, as opposed to focusing on a company's fundamentals
and as such, may not match with a report on a company's fundamentals.
We do not undertake to advise you as to any change of our views expressed in this document. While we would endeavor to update
the information herein on a reasonable basis, Angel Broking, its subsidiaries and associated companies, their directors and
employees are under no obligation to update or keep the information current. Also there may be regulatory, compliance, or other
reasons that may prevent Angel Broking and affiliates from doing so. Prospective investors and others are cautioned that any
forward-looking statements are not predictions and may be subject to change without notice.
Angel Broking Limited and affiliates, including the analyst who has issued this report, may, on the date of this report, and from time
to time, have long or short positions in, and buy or sell the securities of the companies mentioned herein or engage in any other
transaction involving such securities and earn brokerage or compensation or act as advisor or have other potential conflict of interest
with respect to company/ies mentioned herein or inconsistent with any recommendation and related information and opinions.
Angel Broking Limited and affiliates may seek to provide or have engaged in providing corporate finance, investment banking or
other advisory services in a merger or specific transaction to the companies referred to in this report, as on the date of this report or
in the past.
Sebi Registration No : INB 010996539
For Private Circulation Only |