Technical Research | February 06, 2012
Daily Technical Report
Sensex (17605) / NIFTY (5326)
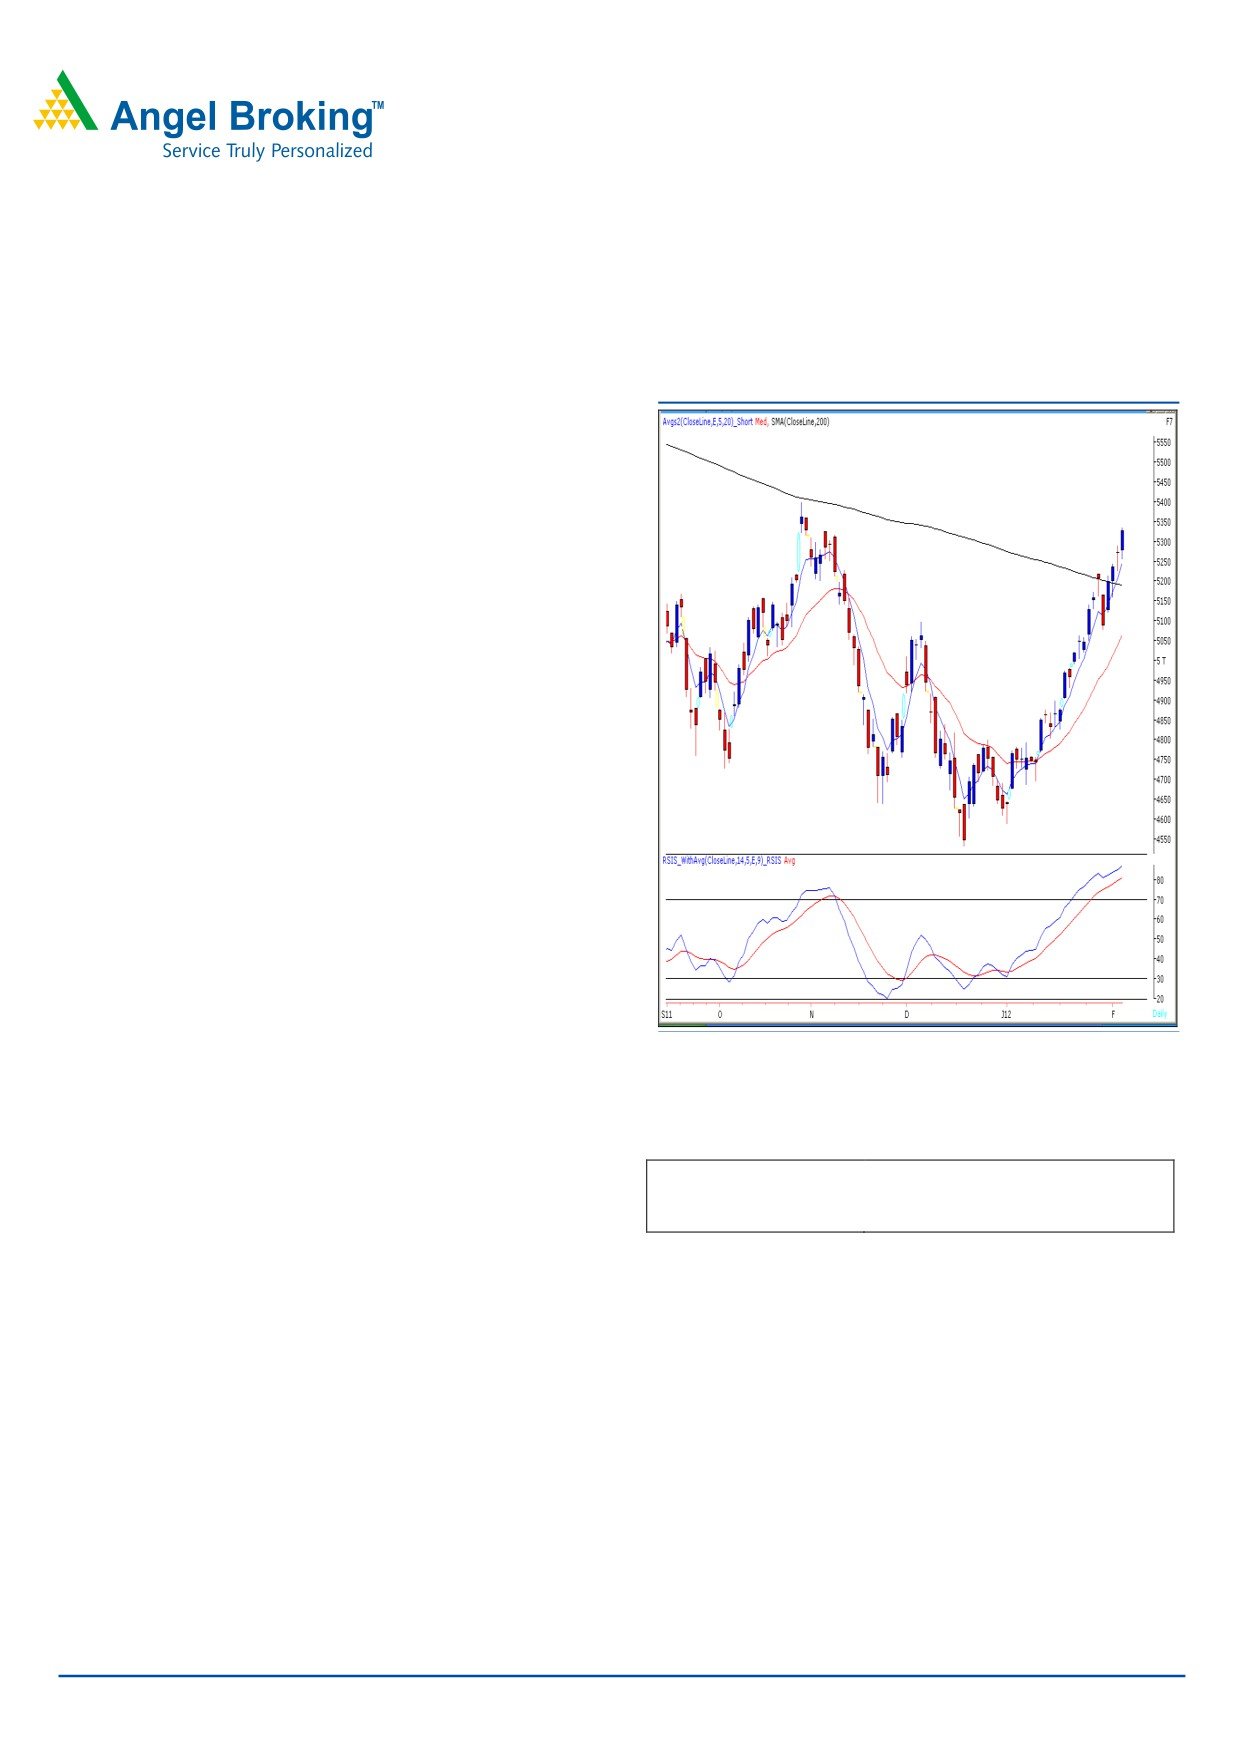
Exhibit 1: Nifty Daily Chart
On Friday, markets opened on a flat note and traded in a
narrow range during the first half of the session. However,
in the later half, strong buying emerged which led indices to
close near the highest point of the day. On the sectoral
front, Realty, Health Care and power counters were among
the major gainers, whereas Metal counters ended on a
losing side. The advance to decline ratio was in favor of
advancing counters. (A=1717 D=1166) (Source
-
Formation:
• We are now observing a positive crossover in “ADX
(14)” indicator.
• Indices have convincingly closed above the “Downward
Sloping Trend Line” drawn by joining November 12,
2010, weekly high of 21076 / 6336 and July 29,
2011, weekly high of 18945 / 5702.
• The 200-day SMA level has now shifted to 17200 /
5200.
Source: Falcon
• The “RSI-Smoothened” oscillator on daily chart is
placed in extreme overbought territory.
Actionable points:
Trading strategy:
View
Neutral
After a weak opening, indices managed to find decent
Resistance levels
5400
support around
16757
/
5055 level. As the week
Support levels
5225 - 5159
progressed, markets continued to cross all resistances and a
rally on Friday’s session led indices to close at the highest
A minor correction or a consolidation before crossing
point of the week. It is now confirmed that indices have
this resistance would be the ideal scenario for a
broken out from the mentioned “Downward Sloping Trend
breakout. The possibility of this minor correction cannot
Line” drawn by joining November 12, 2010, weekly high of
be ruled out as the daily “RSI-Smoothened” is placed
21076 / 6336 and July 29, 2011, weekly high of 18945 /
well within the extreme overbought territory. A
5702 and have closed well above it. Further, on the weekly
sustainable move beyond 17908 / 5400 level may push
chart, we are now observing a positive crossover in “ADX
indices to test next resistance levels of 18440 - 18932 /
(14)” indicator coupled with positively poised “RSI-
5552 - 5702. Conversely, 17308 - 17061 - 16965 /
Smoothened” oscillator. Hence, we may witness a strong
5225 - 5159 - 5120 levels are expected to act as
up move if indices sustain above strong and important
supports in coming trading sessions.
resistance level of 17908 / 5400.
For Private Circulation Only |
1
Technical Research | February 06, 2012
Bank Nifty Outlook - (10134)
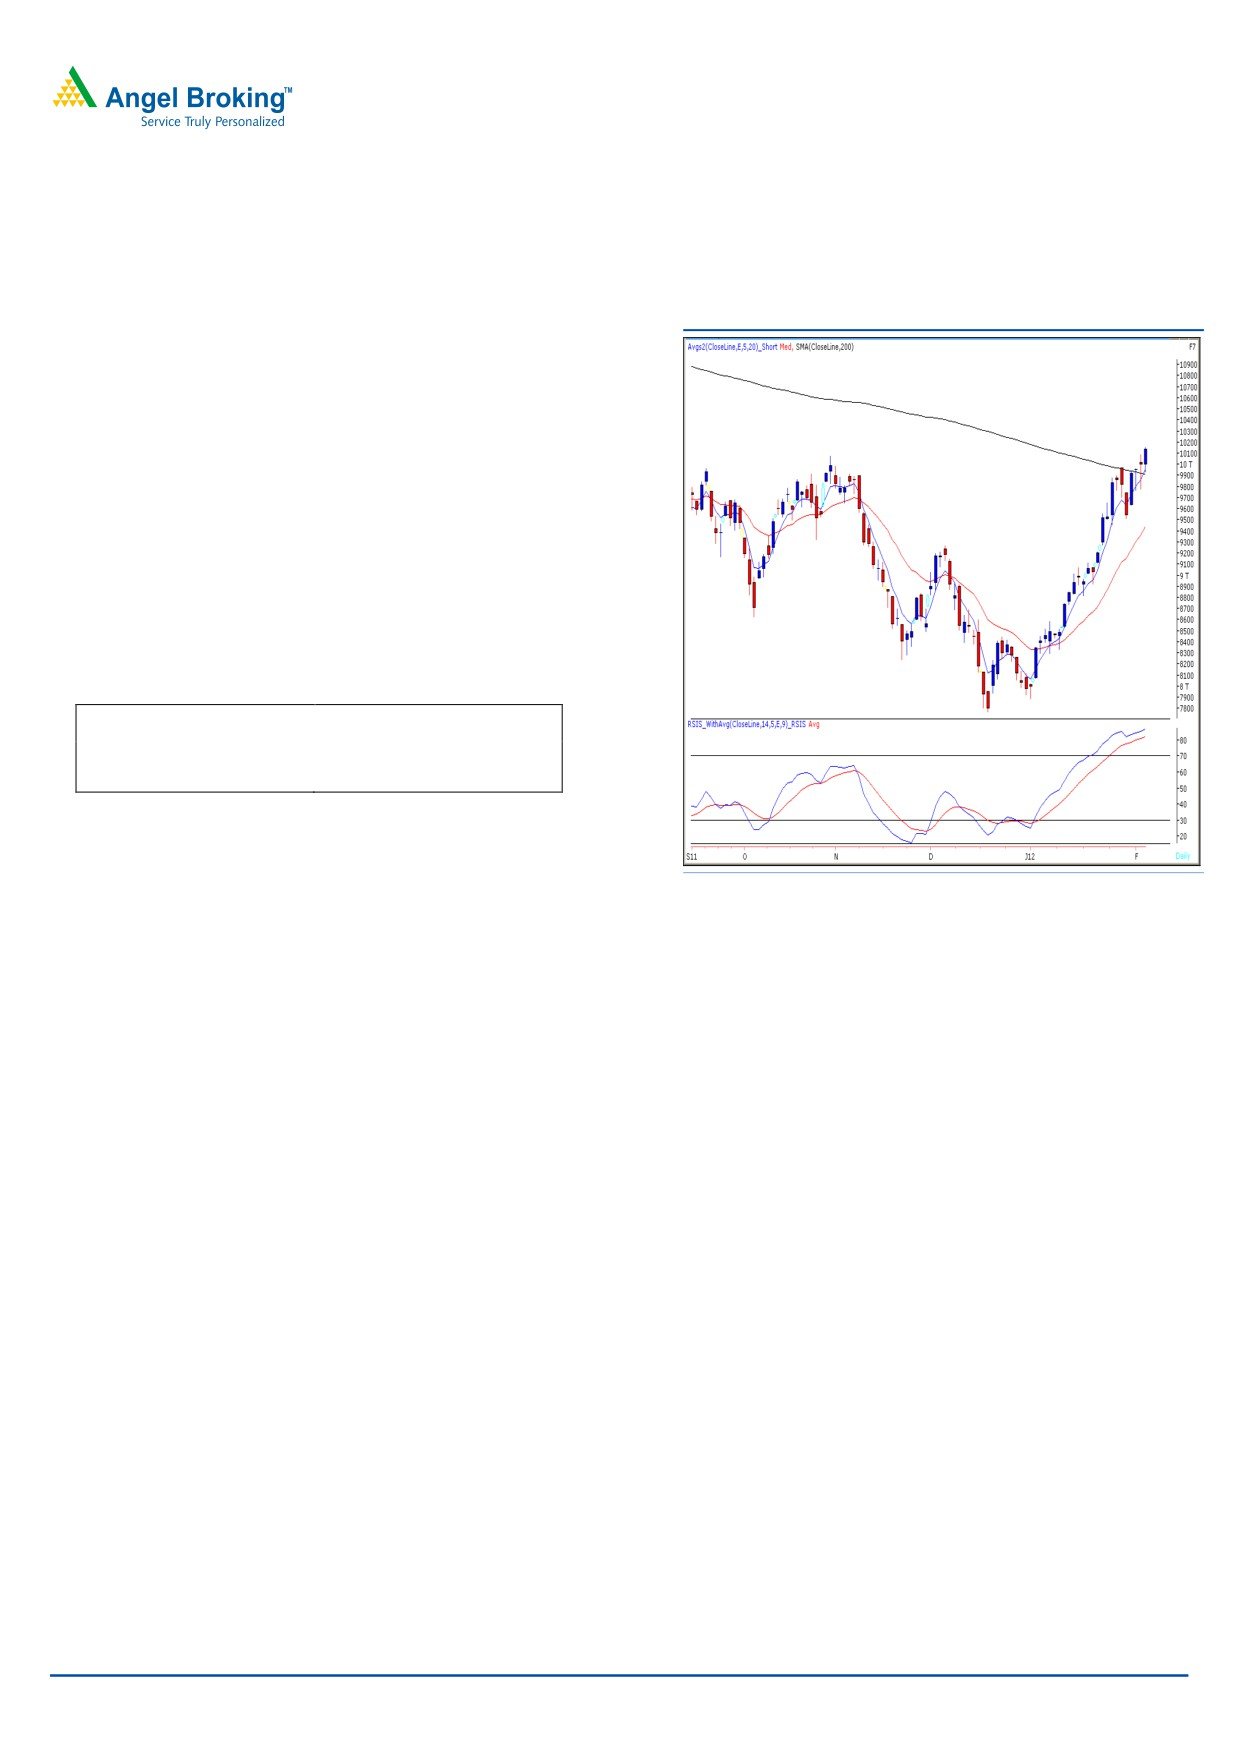
Exhibit 2: Bank Nifty Daily Chart
On Friday, after a long consolidation throughout the day,
finally Bank Nifty broke out of the resistance zone of 9970 -
10080 and closed above 10100 mark. Hence, the cluster of
candlestick pattern indicating indecisiveness since past few
trading sessions has been negated. Since this is the highest
close of Bank Nifty after August 2011, the momentum could
lead index to test the higher levels of 10170 - 10350. On
the downside, 9928 - 9762 levels would now act as a
support for coming trading sessions.
Actionable points:
View
Neutral
Resistance Levels
10170 - 10350
Support Levels
9928 - 9762
Source: Falcon
For Private Circulation Only |
2
Technical Research | February 06, 2012
Positive Bias:
Expected
Stock Name
CMP
5 Day EMA
20 Day EMA
Remarks
Target
ONGC
281.6
277.1
270.7
300
View will change below 275
For Private Circulation Only |
3
Technical Research | February 06, 2012
Daily Pivot Levels for Nifty 50 Stocks
SCRIPS
S2
S1
PIVOT
R1
R2
SENSEX
17,292
17,448
17,539
17,696
17,787
NIFTY
5,226
5,276
5,305
5,355
5,385
BANKNIFTY
9,843
9,988
10,074
10,219
10,304
ACC
1,242
1,255
1,265
1,278
1,288
AMBUJACEM
168
170
172
174
176
AXISBANK
1,042
1,071
1,090
1,119
1,138
BAJAJ-AUTO
1,583
1,597
1,617
1,631
1,651
BHARTIARTL
376
382
391
397
407
BHEL
256
261
263
267
270
BPCL
563
569
579
585
595
CAIRN
329
337
343
350
356
CIPLA
337
341
344
349
352
COALINDIA
321
324
327
330
333
DLF
221
226
229
234
237
DRREDDY
1,616
1,643
1,663
1,690
1,709
GAIL
387
389
392
394
396
HCLTECH
441
448
456
462
470
HDFC
680
688
694
702
708
HDFCBANK
490
498
503
511
516
HEROMOTOCO
1,912
1,932
1,961
1,981
2,010
HINDALCO
147
150
154
157
161
HINDUNILVR
386
394
399
407
412
ICICIBANK
882
899
909
926
936
IDFC
125
132
135
142
146
INFY
2,720
2,752
2,772
2,803
2,824
ITC
195
198
200
202
204
JINDALSTEL
537
546
562
572
588
JPASSOCIAT
71
74
75
78
80
KOTAKBANK
493
506
513
526
533
LT
1,323
1,339
1,352
1,368
1,381
M&M
687
699
708
720
730
MARUTI
1,184
1,213
1,233
1,262
1,282
NTPC
169
173
175
179
181
ONGC
270
276
280
286
290
PNB
930
946
956
973
983
POWERGRID
104
105
107
108
110
RANBAXY
441
448
458
465
476
RCOM
89
91
94
97
100
RELIANCE
807
823
831
847
856
RELINFRA
538
547
556
566
574
RPOWER
96
98
100
102
103
SAIL
103
104
106
107
108
SBIN
2,005
2,054
2,086
2,135
2,167
SESAGOA
224
227
232
235
240
SIEMENS
723
737
744
758
765
STER
119
121
122
124
126
SUNPHARMA
533
545
551
563
569
SUZLON
28
29
29
30
30
TATAMOTORS
237
242
246
252
255
TATAPOWER
110
111
112
114
115
TATASTEEL
453
460
467
474
481
TCS
1,128
1,150
1,163
1,185
1,198
WIPRO
419
423
426
430
433
Technical Research Team
For Private Circulation Only |
4
Technical Report
RESEARCH TEAM
Shardul Kulkarni
Head - Technicals
Sameet Chavan
Technical Analyst
Sacchitanand Uttekar
Technical Analyst
Mehul Kothari
Technical Analyst
Ankur Lakhotia
Technical Analyst
Research Team: 022-3952 6600
DISCLAIMER: This document is not for public distribution and has been furnished to you solely for your information and must not
be reproduced or redistributed to any other person. Persons into whose possession this document may come are required to observe
these restrictions.
Opinion expressed is our current opinion as of the date appearing on this material only. While we endeavor to update on a
reasonable basis the information discussed in this material, there may be regulatory, compliance, or other reasons that prevent us
from doing so. Prospective investors and others are cautioned that any forward-looking statements are not predictions and may be
subject to change without notice. Our proprietary trading and investment businesses may make investment decisions that are
inconsistent with the recommendations expressed herein.
The information in this document has been printed on the basis of publicly available information, internal data and other reliable
sources believed to be true and are for general guidance only. While every effort is made to ensure the accuracy and completeness of
information contained, the company takes no guarantee and assumes no liability for any errors or omissions of the information. No
one can use the information as the basis for any claim, demand or cause of action.
Recipients of this material should rely on their own investigations and take their own professional advice. Each recipient of this
document should make such investigations as it deems necessary to arrive at an independent evaluation of an investment in the
securities of companies referred to in this document (including the merits and risks involved), and should consult their own advisors to
determine the merits and risks of such an investment. Price and value of the investments referred to in this material may go up or
down. Past performance is not a guide for future performance. Certain transactions - futures, options and other derivatives as well as
non-investment grade securities - involve substantial risks and are not suitable for all investors. Reports based on technical analysis
centers on studying charts of a stock's price movement and trading volume, as opposed to focusing on a company's fundamentals
and as such, may not match with a report on a company's fundamentals.
We do not undertake to advise you as to any change of our views expressed in this document. While we would endeavor to update
the information herein on a reasonable basis, Angel Broking, its subsidiaries and associated companies, their directors and
employees are under no obligation to update or keep the information current. Also there may be regulatory, compliance, or other
reasons that may prevent Angel Broking and affiliates from doing so. Prospective investors and others are cautioned that any
forward-looking statements are not predictions and may be subject to change without notice.
Angel Broking Limited and affiliates, including the analyst who has issued this report, may, on the date of this report, and from time
to time, have long or short positions in, and buy or sell the securities of the companies mentioned herein or engage in any other
transaction involving such securities and earn brokerage or compensation or act as advisor or have other potential conflict of interest
with respect to company/ies mentioned herein or inconsistent with any recommendation and related information and opinions.
Angel Broking Limited and affiliates may seek to provide or have engaged in providing corporate finance, investment banking or
other advisory services in a merger or specific transaction to the companies referred to in this report, as on the date of this report or
in the past.
Sebi Registration No : INB 010996539
For Private Circulation Only |