Daily Technical Report
July 05, 2012
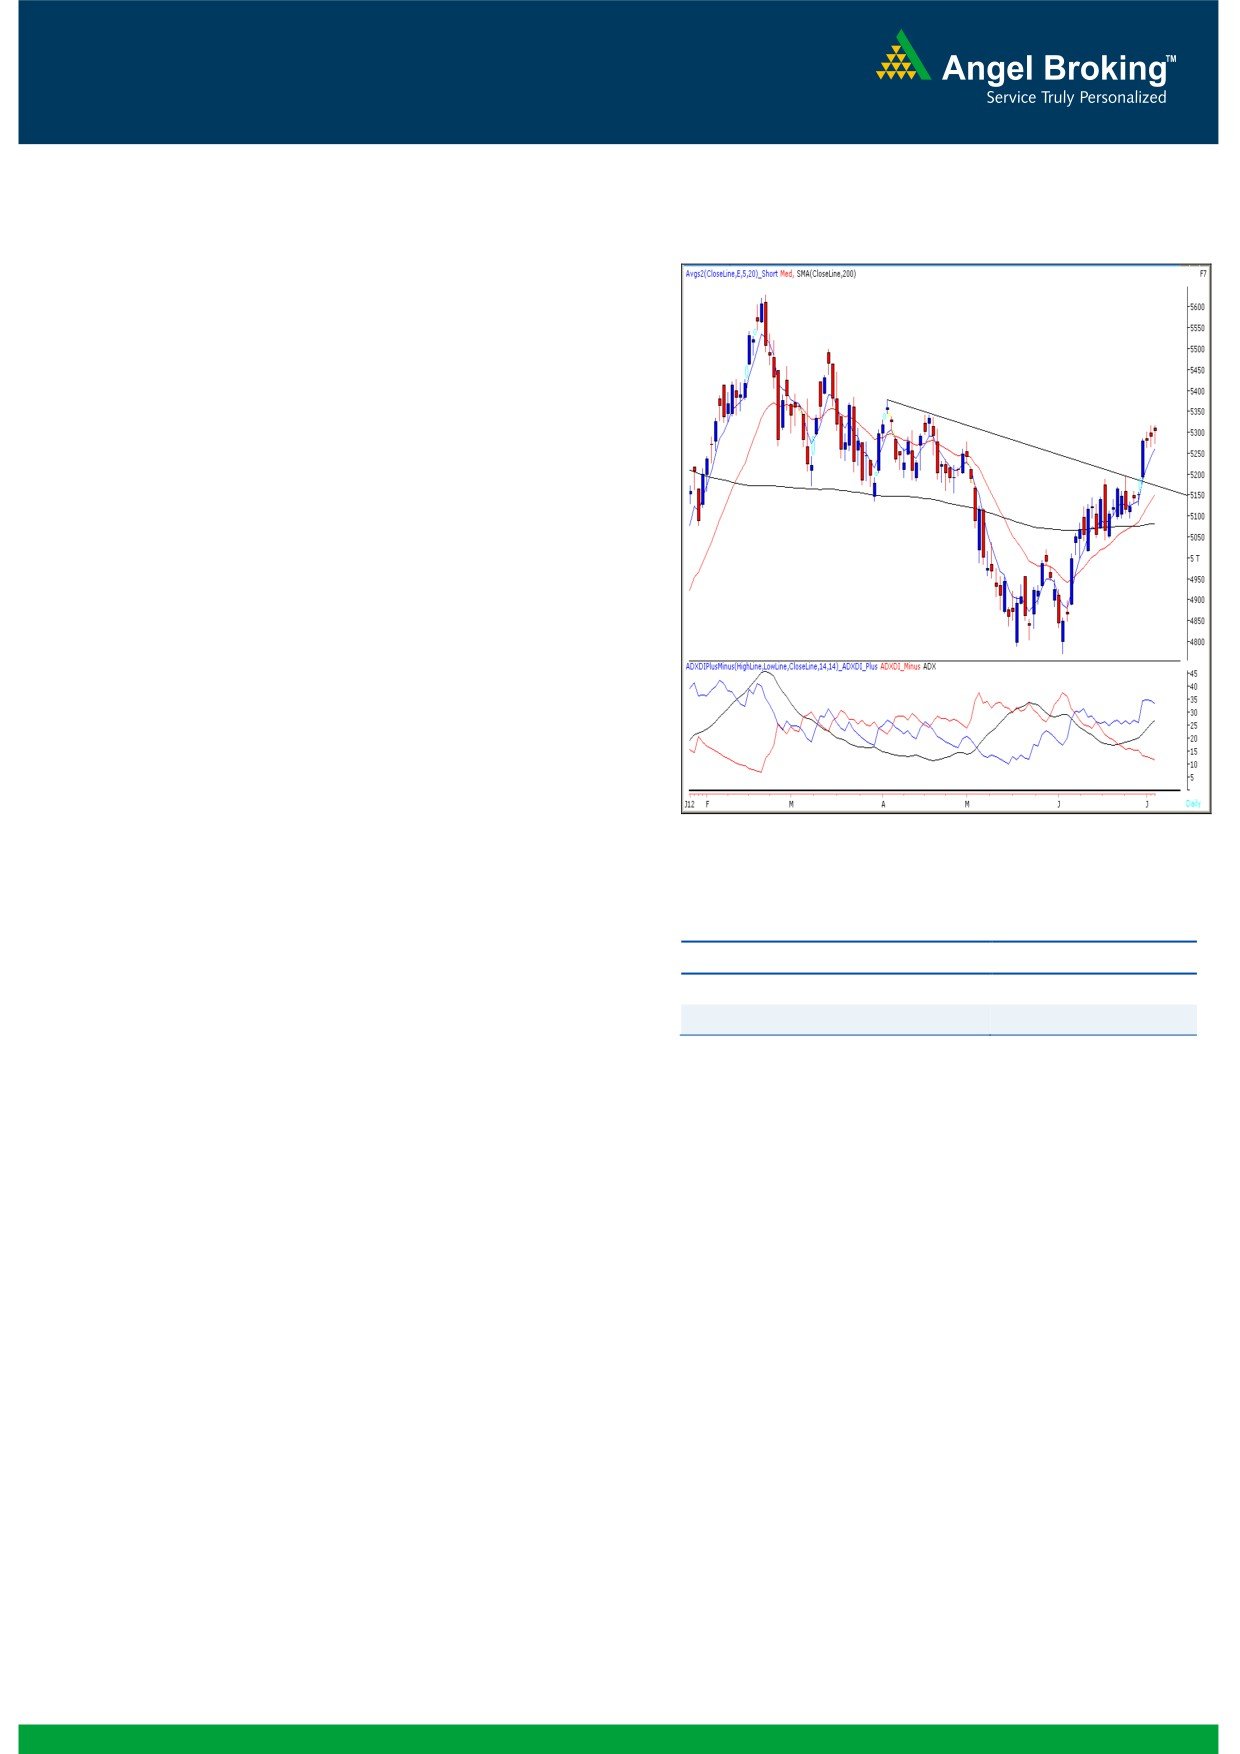
Exhibit 1: Nifty Daily Chart
Sensex (17463) / NIFTY (5303)
We witnessed yet another lackluster trading session
yesterday where our benchmark indices traded in a
narrow range to close marginally above 5300 mark.
On sectoral front, Metal, Realty and Consumer
Durable counters were among the major gainers
whereas; Oil & Gas, FMCG and IT sector remained
under pressure. The advance to decline ratio was
strongly in favor of advancing counters (A=1770
Formation
The 200-day SMA (Simple Moving Average) is
placed at 16810/ 5078 level.
The weekly ‘RSI-Smoothened’ oscillator and ‘5 &
20 EMA’ are now signaling a positive crossover.
Markets have taken support at the Monthly
‘Upward Sloping Trend Line’ and have formed a
‘Bullish Engulfing’ Pattern.
Source: Falcon
Actionable points:
Trading strategy:
Yesterday, once again for the third consecutive
View
Bullish Above 5318
session we witnessed a lackluster activity, and the
Expected Target
5340 - 5386
index closed marginally above the 5300 mark. The
Support Levels
5263 - 5240 - 5215
candlestick pattern formed on the chart is another
narrow range body ( Doji ) indicating indecisiveness
at current levels. Therefore, there are no major
changes in the chart structure and we reiterate our
view that recent low of
17363 /
5263 remains
intermediate intraday support for the markets. At
present indices are testing the
61.8% Fibonacci
retracement of the fall from February 22, 2012 - June
4,
2012. In addition the “ADX (14)” indicator has
moved above 25 indicating that the undertone is
positive and is gradually gaining strength. Thus on the
upside, once indices sustain above 17527 / 5318
level then are likely to rally further towards 17530 -
17687 / 5340 - 5386.
1
Daily Technical Report
July 05, 2012
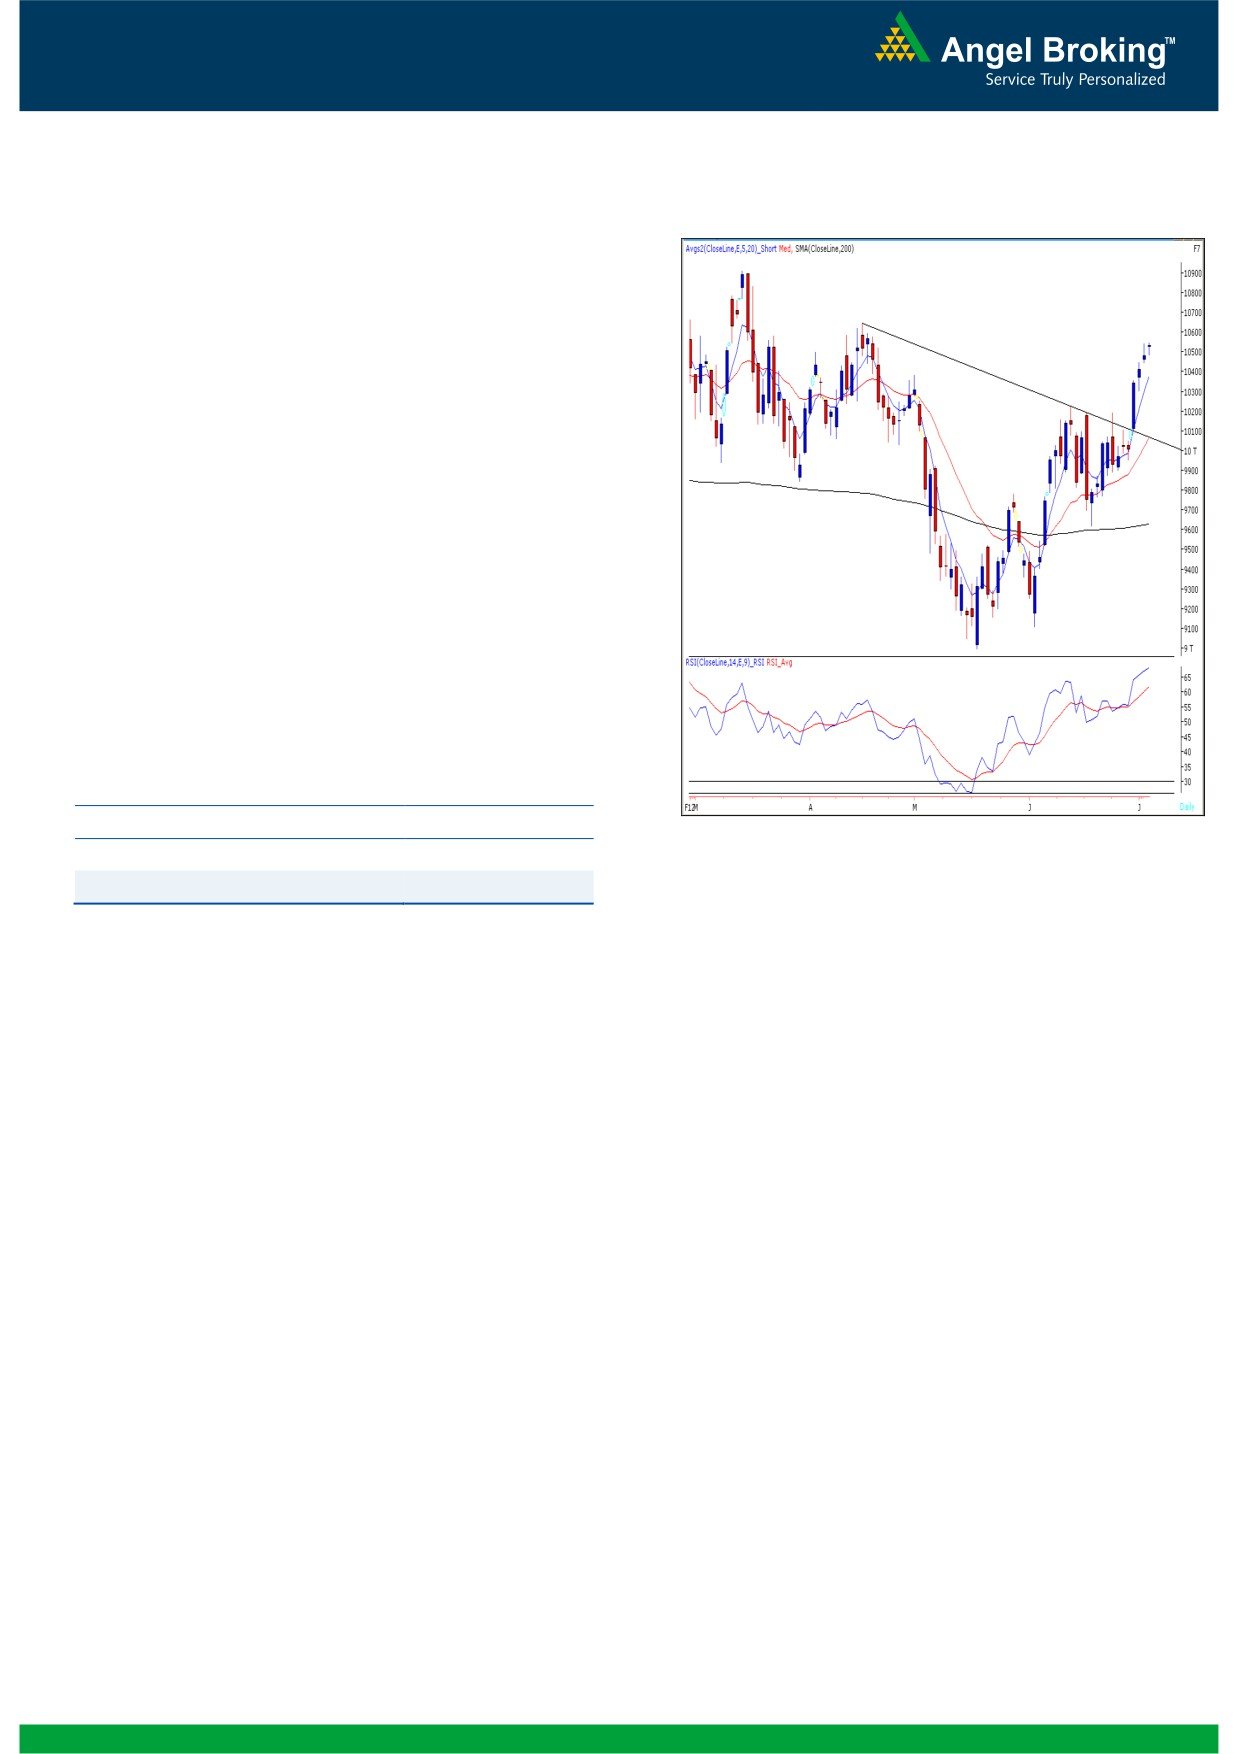
Bank Nifty Outlook - (10529)
Exhibit 2: Bank Nifty Daily Chart
Yesterday, for the third consecutive session we
witnessed a positive opening, followed by lackluster
movement throughout the session. We are witnessing
a narrow “Doji” candlestick pattern after two
consecutive narrow range body formations, indicating
a lack of clarity of trend. We reiterate our view that
the zone of 10501 - 10555 levels is likely to act as
immediate resistance zone. A sustainable move above
10555 levels would trigger a fresh up move and the
index is then likely to test 10645 - 10700 levels. On
the downside 10480 - 10440 levels may act as
support in coming trading session. Considering the
broader picture on the weekly chart and as there is
hardly any significant change on the daily chart we
continue to remain optimistic on the index. Positional
traders holding long positions can hold with stop loss
of 10050 level (Closing basis) on Bank Nifty spot.
Actionable points:
View
Neutral
Source: Falcon
Resistance Levels
10501 - 10555
Support Levels
10480 - 10440
2
Daily Technical Report
July 05, 2012
Research Team Tel: 022 - 39357800
DISCLAIMER
This document is solely for the personal information of the recipient, and must not be singularly used as the basis of any investment
decision. Nothing in this document should be construed as investment or financial advice. Each recipient of this document should make
such investigations as they deem necessary to arrive at an independent evaluation of an investment in the securities of the companies
referred to in this document (including the merits and risks involved), and should consult their own advisors to determine the merits and
risks of such an investment.
Angel Broking Limited, its affiliates, directors, its proprietary trading and investment businesses may, from time to time, make
investment decisions that are inconsistent with or contradictory to the recommendations expressed herein. The views contained in this
document are those of the analyst, and the company may or may not subscribe to all the views expressed within.
Reports based on technical and derivative analysis center on studying charts of a stock's price movement, outstanding positions and
trading volume, as opposed to focusing on a company's fundamentals and, as such, may not match with a report on a company's
fundamentals.
The information in this document has been printed on the basis of publicly available information, internal data and other reliable
sources believed to be true, but we do not represent that it is accurate or complete and it should not be relied on as such, as this
document is for general guidance only. Angel Broking Limited or any of its affiliates/ group companies shall not be in any way
responsible for any loss or damage that may arise to any person from any inadvertent error in the information contained in this report.
Angel Broking Limited has not independently verified all the information contained within this document. Accordingly, we cannot testify,
nor make any representation or warranty, express or implied, to the accuracy, contents or data contained within this document. While
Angel Broking Limited endeavours to update on a reasonable basis the information discussed in this material, there may be regulatory,
compliance, or other reasons that prevent us from doing so.
This document is being supplied to you solely for your information, and its contents, information or data may not be reproduced,
redistributed or passed on, directly or indirectly.
Angel Broking Limited and its affiliates may seek to provide or have engaged in providing corporate finance, investment banking or
other advisory services in a merger or specific transaction to the companies referred to in this report, as on the date of this report or in
the past.
Neither Angel Broking Limited, nor its directors, employees or affiliates shall be liable for any loss or damage that may arise from or in
connection with the use of this information.
Note: Please refer to the important `Stock Holding Disclosure' report on the Angel website (Research Section). Also, please refer to the
latest update on respective stocks for the disclosure status in respect of those stocks. Angel Broking Limited and its affiliates may have
investment positions in the stocks recommended in this report.
Research Team
Shardul Kulkarni
-
Head - Technicals
Sameet Chavan
-
Technical Analyst
Sacchitanand Uttekar
-
Technical Analyst
Mehul Kothari
-
Technical Analyst
Ankur Lakhotia
-
Technical Analyst
Angel Broking Pvt. Ltd.
Registered Office: G-1, Ackruti Trade Centre, Rd. No. 7, MIDC, Andheri (E), Mumbai - 400 093.
Corporate Office: 6th Floor, Ackruti Star, MIDC, Andheri (E), Mumbai - 400 093. Tel: (022) 3952 6600
Sebi Registration No: INB 010996539
4