Daily Technical Report
June 05, 2012
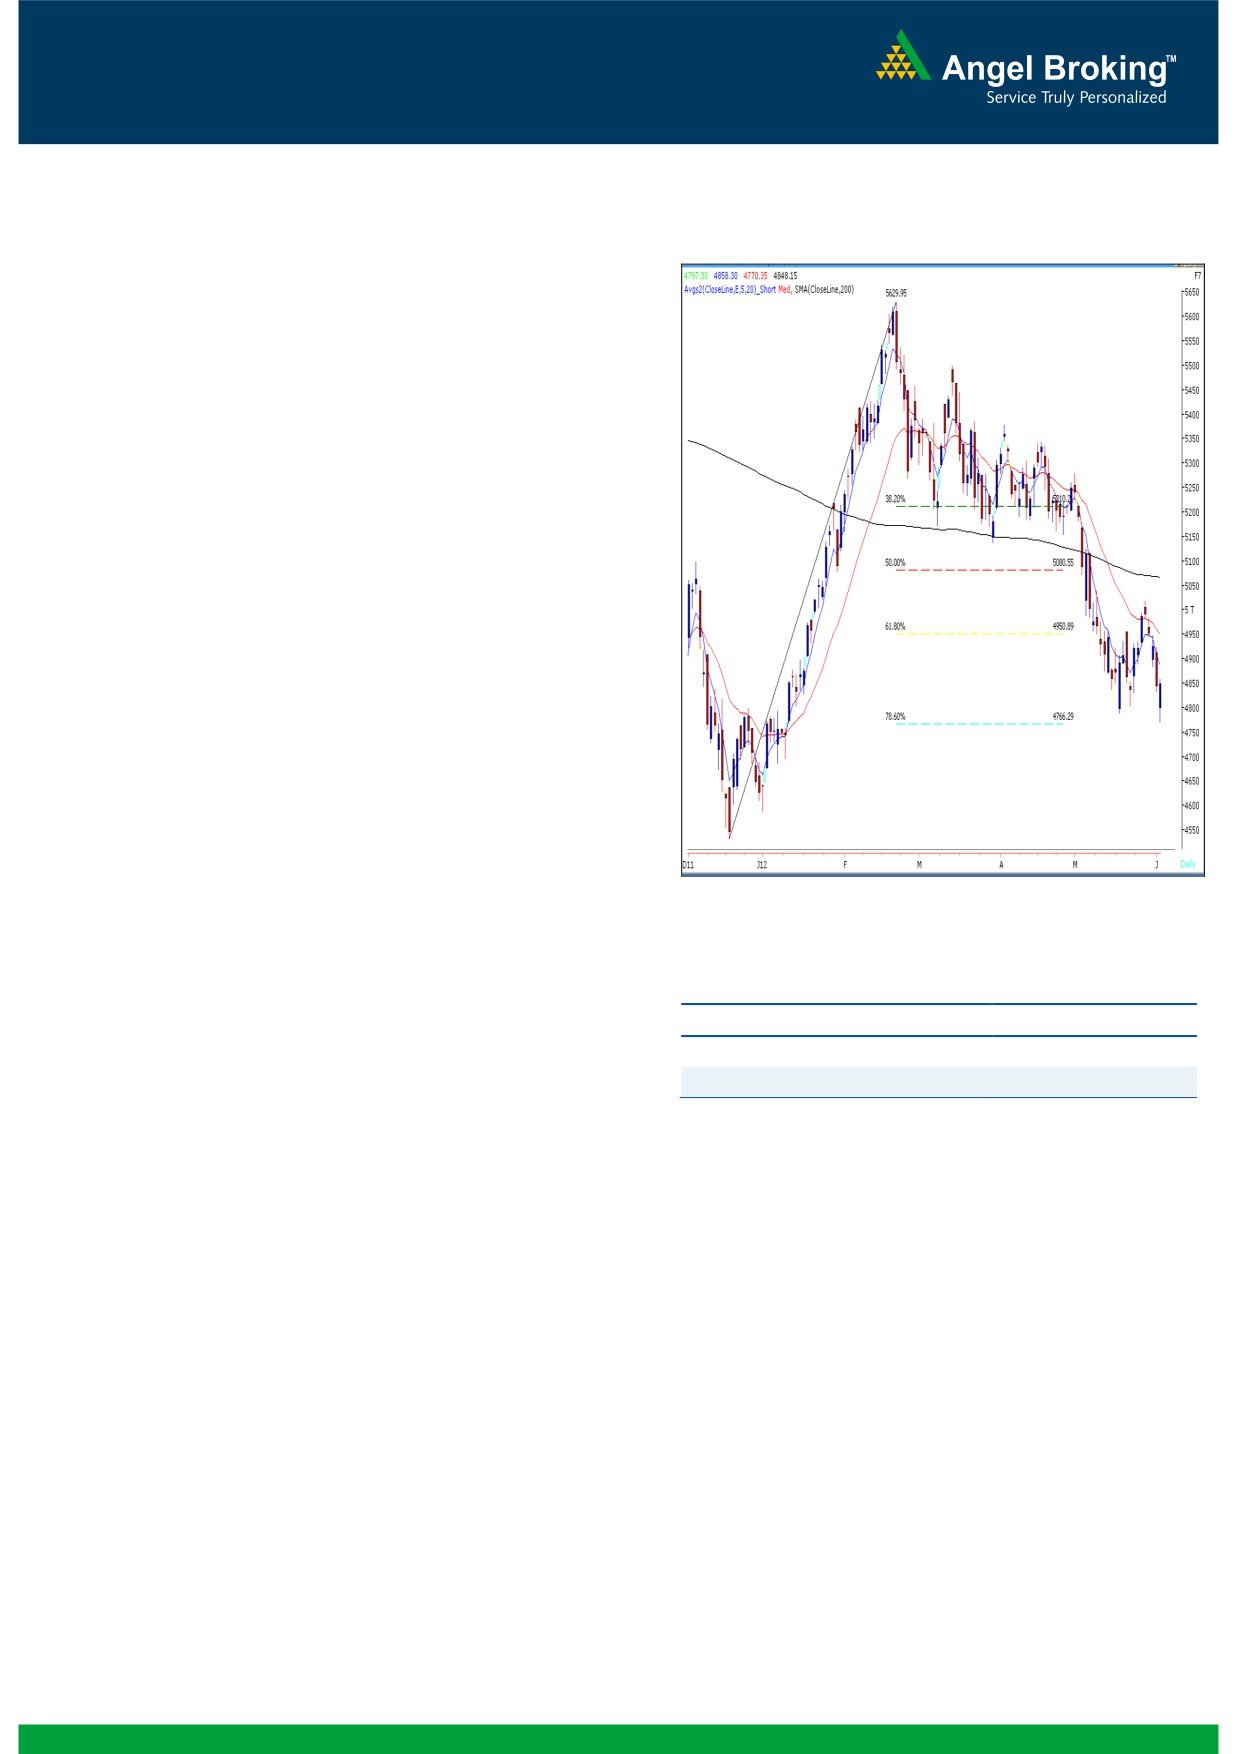
Exhibit 1: Nifty Daily Chart
Sensex (15988) / NIFTY (4848)
Yesterday, we witnessed a weak opening on the back
of extremely negative clues from European and US
bourses. Further, markets remained under pressure
for the initial hour of the session. However, indices
bounced back sharply from the lows to close at the
highest point of the day. On sectoral front, Capital
Goods, Realty, Oil & Gas and Banking counters
bounced back sharply; whereas Consumer Durable
and FMCG ended on a losing side. The advance to
decline ratio was strongly in favor of declining
counters
(A=1204 D=1449) (Source
-
Formation
The 200-day SMA (Simple Moving Average) and
20-day EMA (Exponential Moving Average) have
now shifted to 16800 / 5070 and 16360 /
4960, respectively.
The ‘20-Week EMA’ is placed at 16840 / 5100
level.
Source: Falcon
Indices have taken a support near 15860 /
4766 level, which is the
78.6% Fibonacci
Retracement level of the rise from 15135 / 4531
Actionable points:
(Low on December 23, 2011) to 18524 / 5630
View
Bullish above 4861
(High on February 22, 2012).
Expected target
4895 - 4925
The hourly ‘RSI-Smoothened’ oscillator is
Support Levels
4814 - 4770
signaling a positive crossover.
Conversely, yesterday's low of 15748 / 4770 holds
Trading strategy:
as a key support level for the market. A violation of
Indices opened significantly lower during yesterday's
this level may result in a fall towards 15678 / 4695
session to test the 78.6% Fibonacci retracement level
levels.
as mentioned above. Markets found decent support
near this level and bounced back sharply to close at
the highest point of the day. Going forward, hourly
20 EMA placed at 16026 / 4861 would act as an
important resistance level. A sustainable move
beyond this level would further augment the bullish
momentum. In this case, indices are likely to rally
towards 16147 - 4895 / 16240 - 4925 levels.
1
Daily Technical Report
June 05, 2012
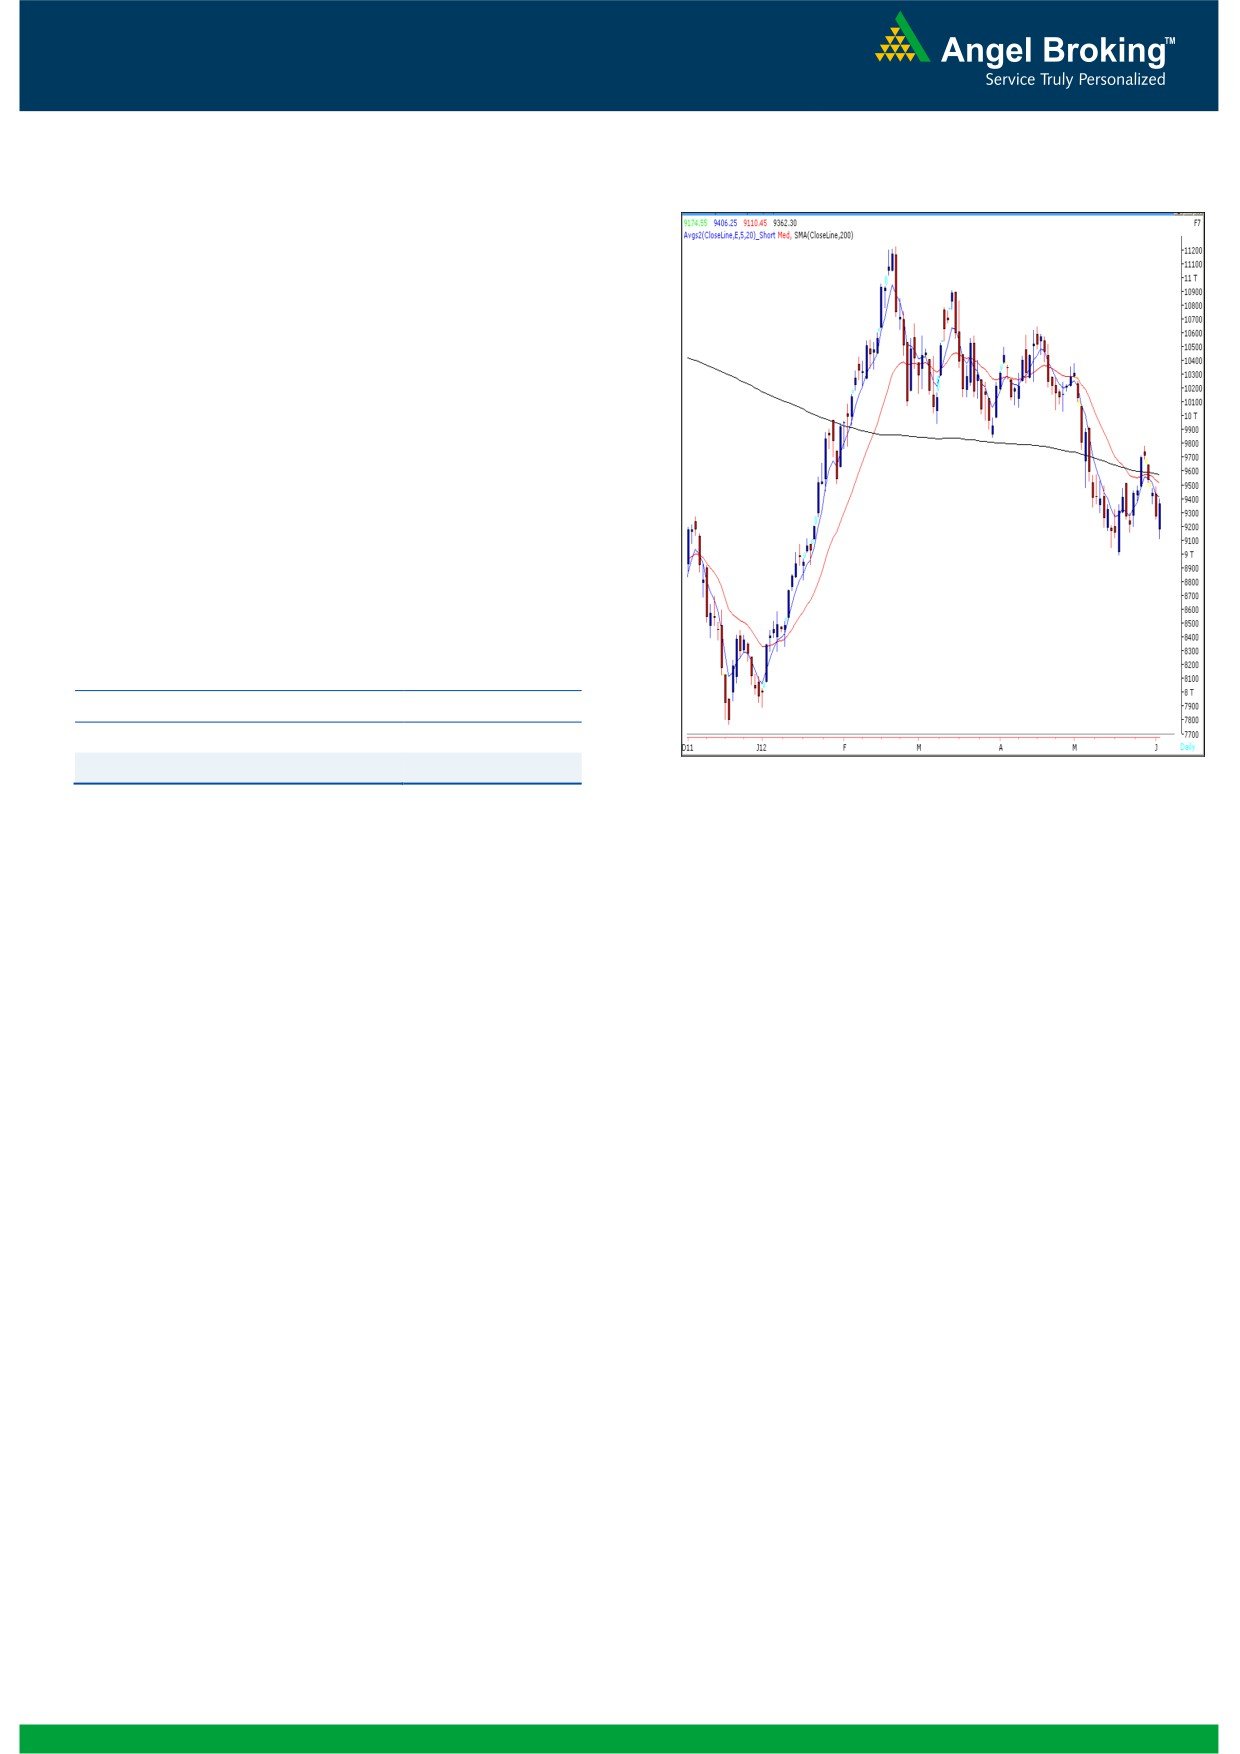
Exhibit 2: Bank Nifty Daily Chart
Bank Nifty Outlook - (9362)
Yesterday, Bank Nifty opened with a downside gap
but buying interest near support levels led the index to
close in the positive territory. We had mentioned in
our previous that momentum oscillators on the hourly
chart are in an oversold condition and possibility of a
bounce back cannot be ruled out. Looking at the
current chart structure and “Piercing Line” candlestick
pattern on the daily chart we expect volatility in
coming trading session. If the index manages to
sustain above yesterday’s high of 9406 then it is likely
to rally further towards 9493 - 9526 levels. On the
downside 9245 - 9157 levels may act as support in
coming trading session.
Actionable points:
View
Neutral
Resistance Levels
9406 - 9493 - 9526
Support Levels
9245 - 9157
Source: Falcon
2
Daily Technical Report
June 05, 2012
Research Team Tel: 022 - 39357800
DISCLAIMER
This document is solely for the personal information of the recipient, and must not be singularly used as the basis of any investment
decision. Nothing in this document should be construed as investment or financial advice. Each recipient of this document should make
such investigations as they deem necessary to arrive at an independent evaluation of an investment in the securities of the companies
referred to in this document (including the merits and risks involved), and should consult their own advisors to determine the merits and
risks of such an investment.
Angel Broking Limited, its affiliates, directors, its proprietary trading and investment businesses may, from time to time, make
investment decisions that are inconsistent with or contradictory to the recommendations expressed herein. The views contained in this
document are those of the analyst, and the company may or may not subscribe to all the views expressed within.
Reports based on technical and derivative analysis center on studying charts of a stock's price movement, outstanding positions and
trading volume, as opposed to focusing on a company's fundamentals and, as such, may not match with a report on a company's
fundamentals.
The information in this document has been printed on the basis of publicly available information, internal data and other reliable
sources believed to be true, but we do not represent that it is accurate or complete and it should not be relied on as such, as this
document is for general guidance only. Angel Broking Limited or any of its affiliates/ group companies shall not be in any way
responsible for any loss or damage that may arise to any person from any inadvertent error in the information contained in this report.
Angel Broking Limited has not independently verified all the information contained within this document. Accordingly, we cannot testify,
nor make any representation or warranty, express or implied, to the accuracy, contents or data contained within this document. While
Angel Broking Limited endeavours to update on a reasonable basis the information discussed in this material, there may be regulatory,
compliance, or other reasons that prevent us from doing so.
This document is being supplied to you solely for your information, and its contents, information or data may not be reproduced,
redistributed or passed on, directly or indirectly.
Angel Broking Limited and its affiliates may seek to provide or have engaged in providing corporate finance, investment banking or
other advisory services in a merger or specific transaction to the companies referred to in this report, as on the date of this report or in
the past.
Neither Angel Broking Limited, nor its directors, employees or affiliates shall be liable for any loss or damage that may arise from or in
connection with the use of this information.
Note: Please refer to the important `Stock Holding Disclosure' report on the Angel website (Research Section). Also, please refer to the
latest update on respective stocks for the disclosure status in respect of those stocks. Angel Broking Limited and its affiliates may have
investment positions in the stocks recommended in this report.
Research Team
Shardul Kulkarni
-
Head - Technicals
Sameet Chavan
-
Technical Analyst
Sacchitanand Uttekar
-
Technical Analyst
Mehul Kothari
-
Technical Analyst
Ankur Lakhotia
-
Technical Analyst
Angel Broking Pvt. Ltd.
Registered Office: G-1, Ackruti Trade Centre, Rd. No. 7, MIDC, Andheri (E), Mumbai - 400 093.
Corporate Office: 6th Floor, Ackruti Star, MIDC, Andheri (E), Mumbai - 400 093. Tel: (022) 3952 6600
Sebi Registration No: INB 010996539
4