Technical Research | March 05, 2012
Daily Technical Report
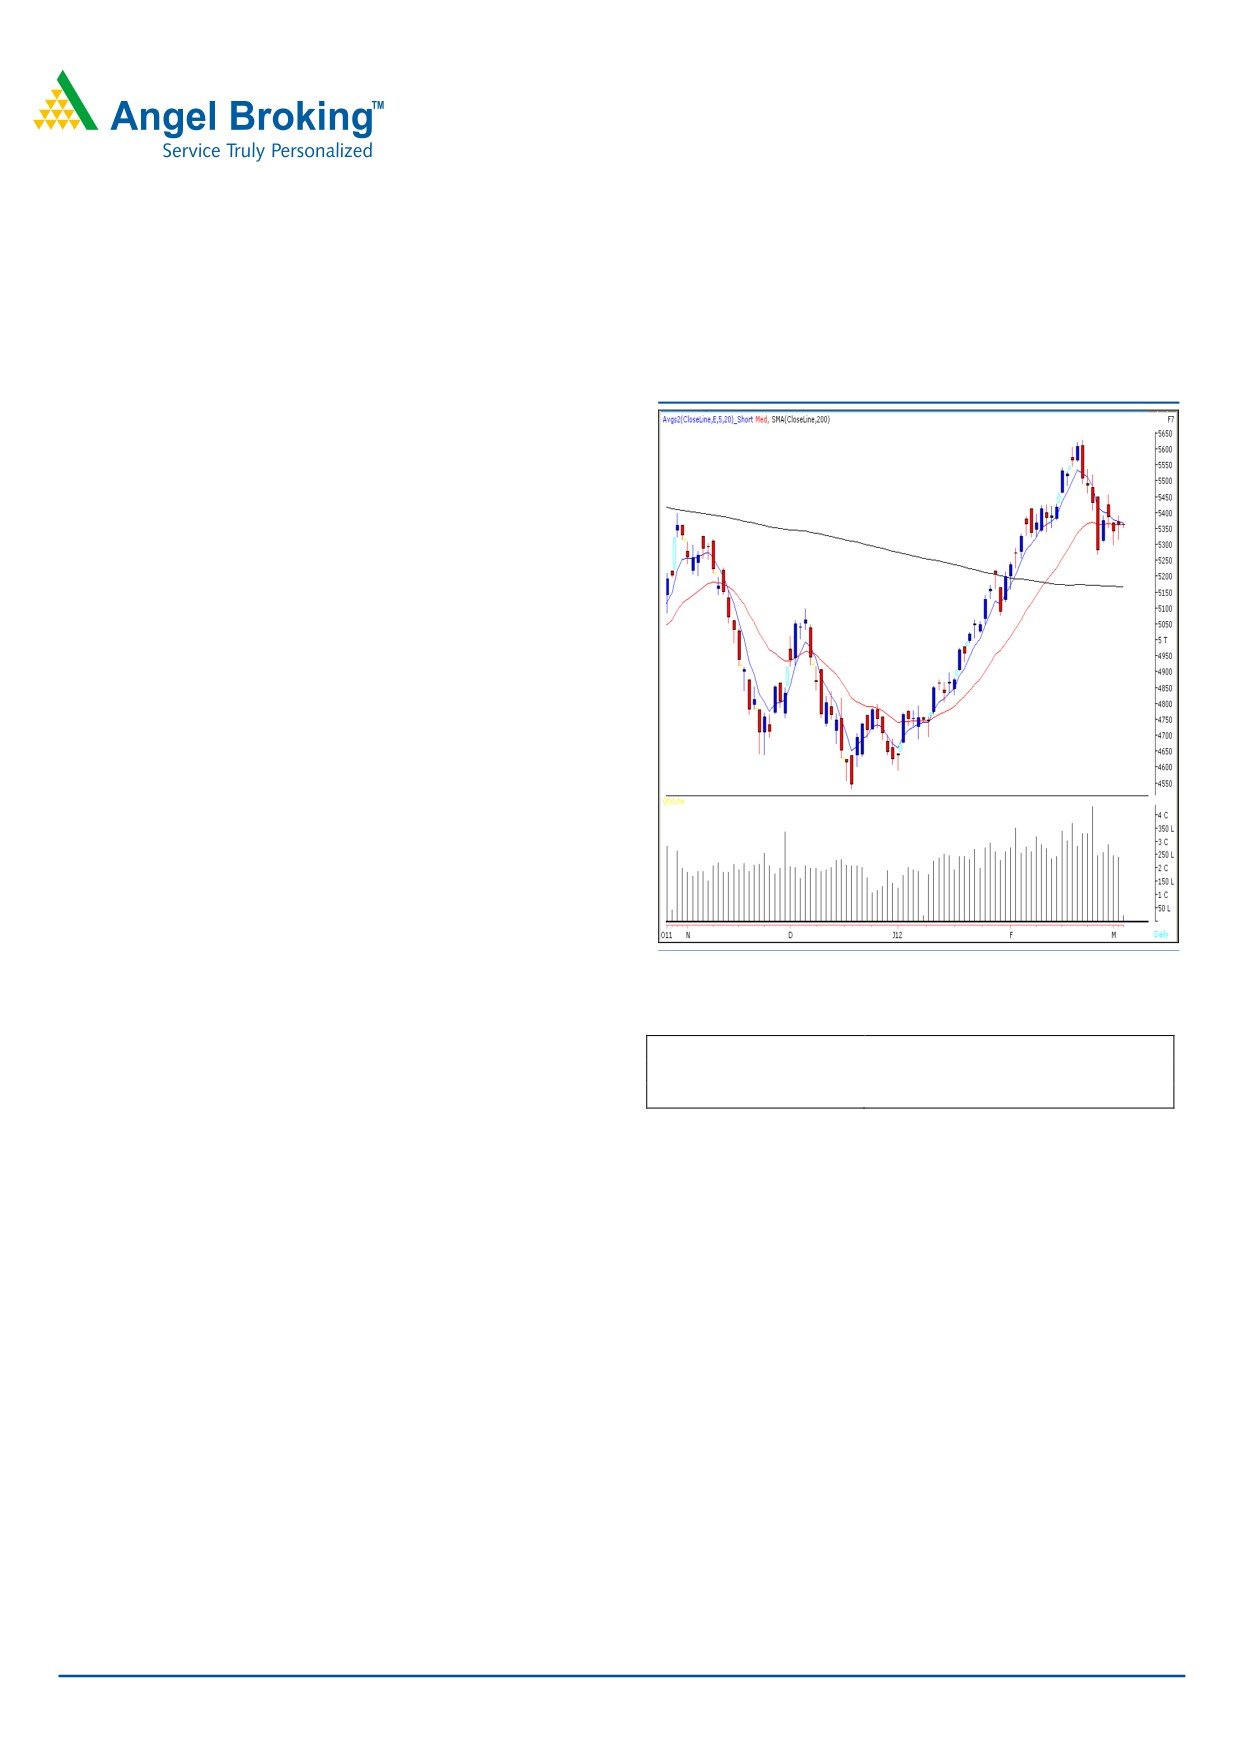
Sensex (17637) / NIFTY (5359)
Exhibit 1: Nifty Daily Chart
On Friday, our Benchmark indices opened on a flat note
and traded in a narrow range throughout the day. As
expected and mentioned, 17795 / 5397 levels acted as a
resistance for the day. On the sectoral front, most of the
sectors ended flat with minor changes. The advance to
decline ratio was strongly in favor of advancing counters.
Formation:
• The 200-day SMA and 20-day EMA have now shifted to
17180 / 5167 and 17682 / 5362, respectively.
• The weekly “Stochastic” oscillator is still negatively
poised.
• The
61.8% Fibonacci retracement level of the fall
21109 / 6339 (November 5, 2010) to 15135 / 4531
(December 23, 2011) is around 18827 / 5645.
Source: Falcon
Trading strategy:
Actionable points:
View
Neutral
Broadly speaking, markets are trading in a range of 18001
Resistance Levels
5397
to 17381 / 5459 to 5268. A breakout from the mentioned
Support levels
5297 - 5268
trading range, on either side, is likely to dictate a clear
direction in coming weeks. Therefore, if indices manage to
Traders should take a note that the coming week is likely
sustain above the weekly high of 18001 / 5459, then we
to witness volatility on account of the results from the UP
may witness a positive momentum, which would push
elections and markets may take clues from the same.
indices higher to retest recent swing high of 18524 / 5630.
On the downside, 17381 / 5268 level may provide decent
support for the markets. A word of caution, the weekly
“Stochastic” oscillator is still negatively poised. The impact
of this technical tool may come into action on the
violation of this week’s low of 17381 / 5268 level. In
this scenario, selling pressure is likely to intensify further
and may drag indices to test “200-day SMA” support
zone of 17230 - 17180 / 5210 - 5167 level.
For Private Circulation Only |
1
Technical Research | March 05, 2012
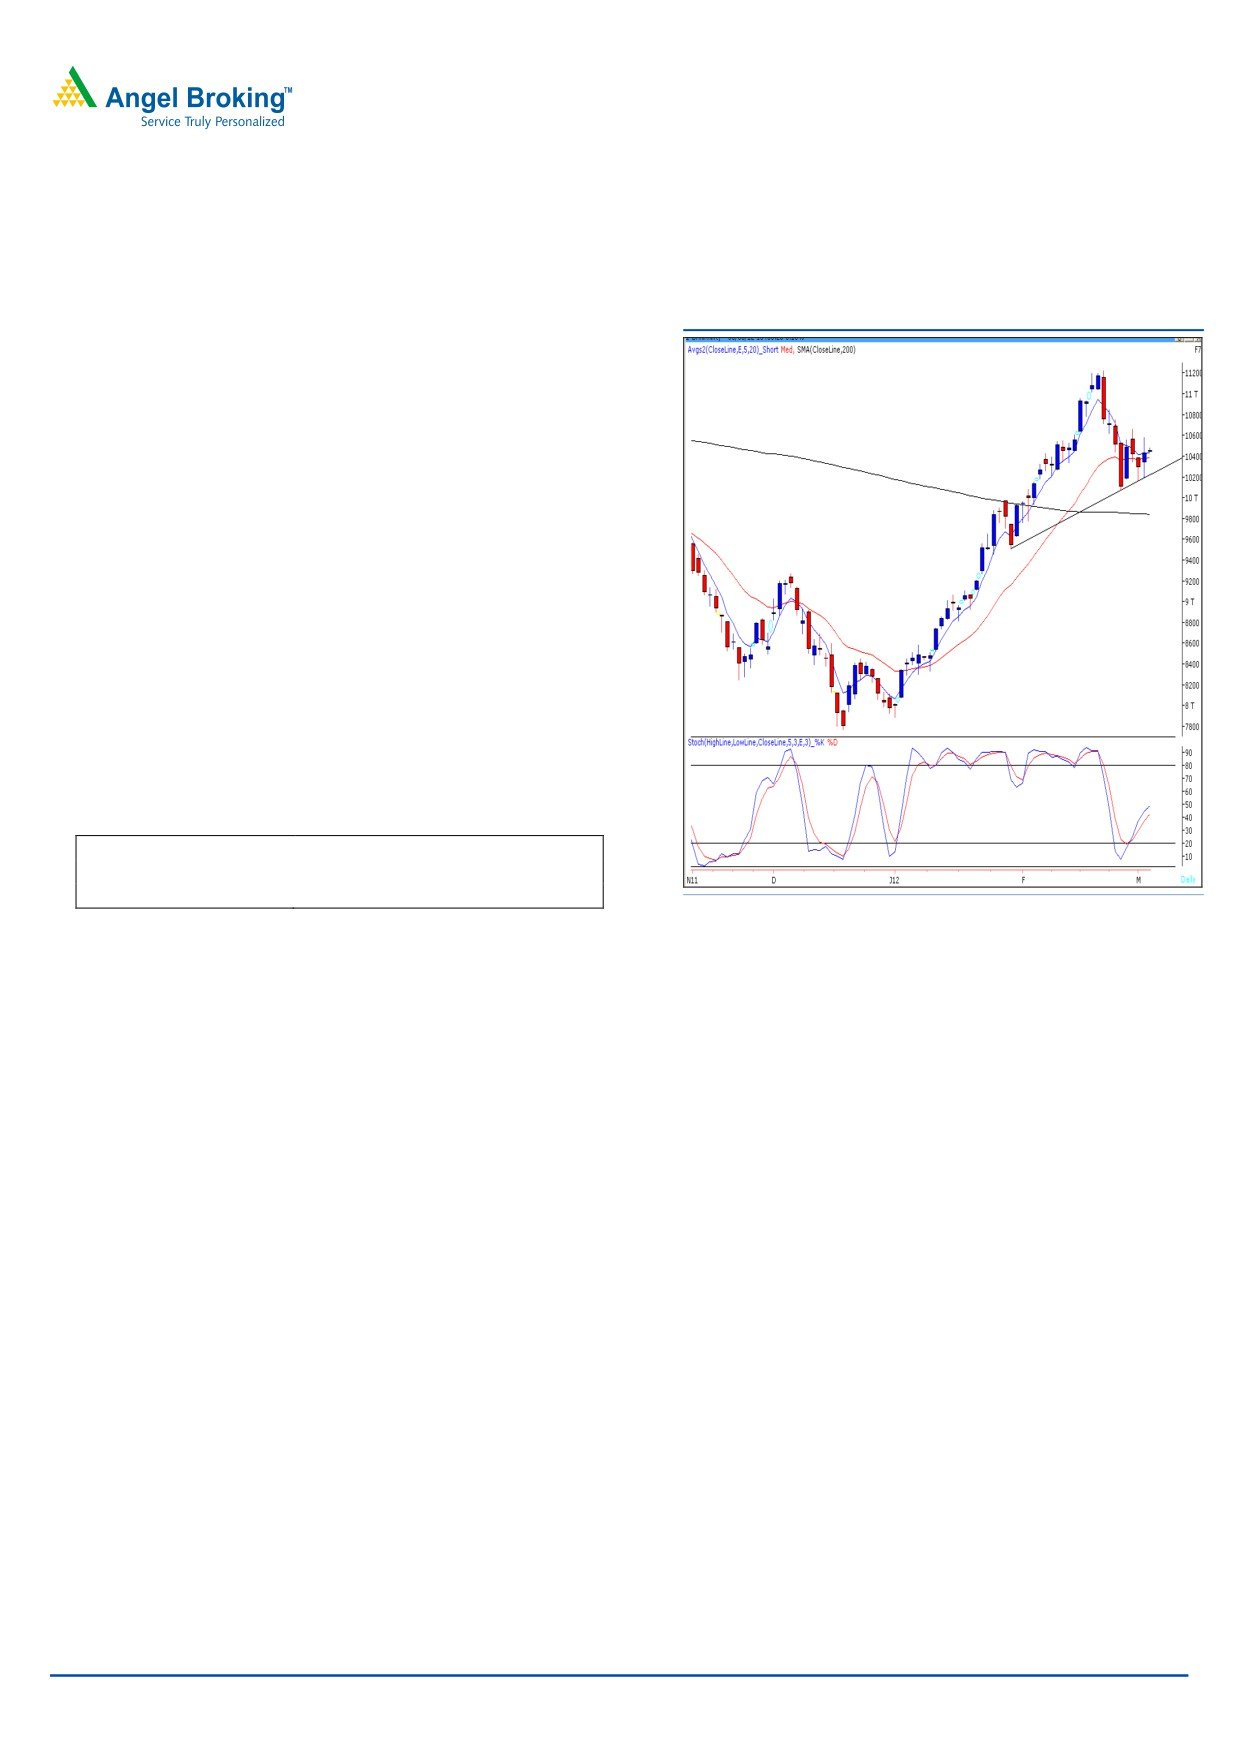
Bank Nifty Outlook - (10434)
Exhibit 2: Bank Nifty Daily Chart
On Friday, Bank Nifty opened on a flat note and traded
with extreme volatility throughout the day. The index for
the second day traded in our mentioned range of 10800
- 10200. The positive crossover mentioned in “stochastic”
momentum oscillator in our previous report is still intact.
The index has taken support on the trend line joining the
lows of January 30, 2012 - February 27, 2012. We
reiterate our view that the index is likely to be in the range
of 10800 - 10200. Only a sustainable move outside the
said range will dictate a clear direction of the trend.
Within the mentioned range index is likely to face
temporary resistance at 10585 - 10667 - 10800. On the
downside move below 10200 level is likely to attract
selling pressure and the index may test 10073 level.
Actionable points:
View
Neutral
Resistance Levels
10585 - 10667
Support Levels
10200
Source: Falcon
For Private Circulation Only |
2
Technical Research | March 05, 2012
Positive Bias:
Positive
Expected
Stock Name
CMP
5 Day EMA
20 Day EMA
Remarks
Above
Target
View will change below
Hind Copper
303
290.2
284.5
309
335
293
Negative Bias:
Negative
Expected
Stock Name
CMP
5 Day EMA
20 Day EMA
Remarks
Below
Target
View will change above
OFSS
2601.6
2592
2354
2585
2500 - 2470
2700
For Private Circulation Only |
3
Technical Research | March 05, 2012
Daily Pivot Levels for Nifty 50 Stocks
SCRIPS
S2
S1
PIVOT
R1
R2
SENSEX
17,397
17,517
17,624
17,744
17,852
NIFTY
5,278
5,319
5,356
5,396
5,433
BANKNIFTY
10,012
10,223
10,404
10,615
10,795
ACC
1,309
1,324
1,339
1,354
1,369
AMBUJACEM
162
165
168
171
173
AXISBANK
1,109
1,138
1,173
1,202
1,238
BAJAJ-AUTO
1,698
1,724
1,761
1,787
1,824
BHARTIARTL
341
346
349
354
357
BHEL
285
291
297
303
309
BPCL
653
658
664
669
674
CAIRN
361
365
373
378
385
CIPLA
311
313
316
318
321
COALINDIA
326
329
332
335
339
DLF
194
199
205
209
215
DRREDDY
1,634
1,655
1,692
1,713
1,750
GAIL
366
369
373
375
379
HCLTECH
471
476
482
487
493
HDFC
657
665
670
678
684
HDFCBANK
500
509
517
527
534
HEROMOTOCO
1,898
1,920
1,948
1,969
1,997
HINDALCO
141
144
150
154
159
HINDUNILVR
374
378
381
386
388
ICICIBANK
858
880
897
920
937
IDFC
134
137
139
143
145
INFY
2,789
2,818
2,841
2,869
2,893
ITC
201
203
205
207
210
JINDALSTEL
567
578
586
597
606
JPASSOCIAT
72
74
75
76
78
KOTAKBANK
535
550
563
578
591
LT
1,247
1,274
1,297
1,323
1,347
M&M
666
673
681
688
696
MARUTI
1,295
1,313
1,325
1,343
1,355
NTPC
174
177
179
181
183
ONGC
272
277
281
286
290
PNB
917
936
955
973
992
POWERGRID
110
111
112
113
114
RANBAXY
419
424
428
432
436
RCOM
92
93
95
96
98
RELIANCE
800
807
813
819
825
RELINFRA
585
600
613
628
640
RPOWER
119
121
123
125
127
SAIL
99
100
102
103
104
SBIN
2,142
2,194
2,238
2,290
2,334
SESAGOA
206
209
212
216
219
SIEMENS
770
783
803
816
836
STER
120
122
124
126
128
SUNPHARMA
541
554
563
575
584
SUZLON
28
28
30
30
31
TATAMOTORS
261
264
268
272
275
TATAPOWER
112
113
115
116
118
TATASTEEL
454
460
466
472
478
TCS
1,197
1,207
1,217
1,227
1,237
WIPRO
408
419
431
441
454
Technical Research Team
For Private Circulation Only |
4
Technical Report
RESEARCH TEAM
Shardul Kulkarni
Head - Technicals
Sameet Chavan
Technical Analyst
Sacchitanand Uttekar
Technical Analyst
Mehul Kothari
Technical Analyst
Ankur Lakhotia
Technical Analyst
Research Team: 022-3952 6600
DISCLAIMER: This document is not for public distribution and has been furnished to you solely for your information and must not
be reproduced or redistributed to any other person. Persons into whose possession this document may come are required to observe
these restrictions.
Opinion expressed is our current opinion as of the date appearing on this material only. While we endeavor to update on a
reasonable basis the information discussed in this material, there may be regulatory, compliance, or other reasons that prevent us
from doing so. Prospective investors and others are cautioned that any forward-looking statements are not predictions and may be
subject to change without notice. Our proprietary trading and investment businesses may make investment decisions that are
inconsistent with the recommendations expressed herein.
The information in this document has been printed on the basis of publicly available information, internal data and other reliable
sources believed to be true and are for general guidance only. While every effort is made to ensure the accuracy and completeness of
information contained, the company takes no guarantee and assumes no liability for any errors or omissions of the information. No
one can use the information as the basis for any claim, demand or cause of action.
Recipients of this material should rely on their own investigations and take their own professional advice. Each recipient of this
document should make such investigations as it deems necessary to arrive at an independent evaluation of an investment in the
securities of companies referred to in this document (including the merits and risks involved), and should consult their own advisors to
determine the merits and risks of such an investment. Price and value of the investments referred to in this material may go up or
down. Past performance is not a guide for future performance. Certain transactions - futures, options and other derivatives as well as
non-investment grade securities - involve substantial risks and are not suitable for all investors. Reports based on technical analysis
centers on studying charts of a stock's price movement and trading volume, as opposed to focusing on a company's fundamentals
and as such, may not match with a report on a company's fundamentals.
We do not undertake to advise you as to any change of our views expressed in this document. While we would endeavor to update
the information herein on a reasonable basis, Angel Broking, its subsidiaries and associated companies, their directors and
employees are under no obligation to update or keep the information current. Also there may be regulatory, compliance, or other
reasons that may prevent Angel Broking and affiliates from doing so. Prospective investors and others are cautioned that any
forward-looking statements are not predictions and may be subject to change without notice.
Angel Broking Limited and affiliates, including the analyst who has issued this report, may, on the date of this report, and from time
to time, have long or short positions in, and buy or sell the securities of the companies mentioned herein or engage in any other
transaction involving such securities and earn brokerage or compensation or act as advisor or have other potential conflict of interest
with respect to company/ies mentioned herein or inconsistent with any recommendation and related information and opinions.
Angel Broking Limited and affiliates may seek to provide or have engaged in providing corporate finance, investment banking or
other advisory services in a merger or specific transaction to the companies referred to in this report, as on the date of this report or
in the past.
Sebi Registration No : INB 010996539
For Private Circulation Only |