Technical Research | April 04, 2012
Daily Technical Report
Sensex (17597) / NIFTY (5359)
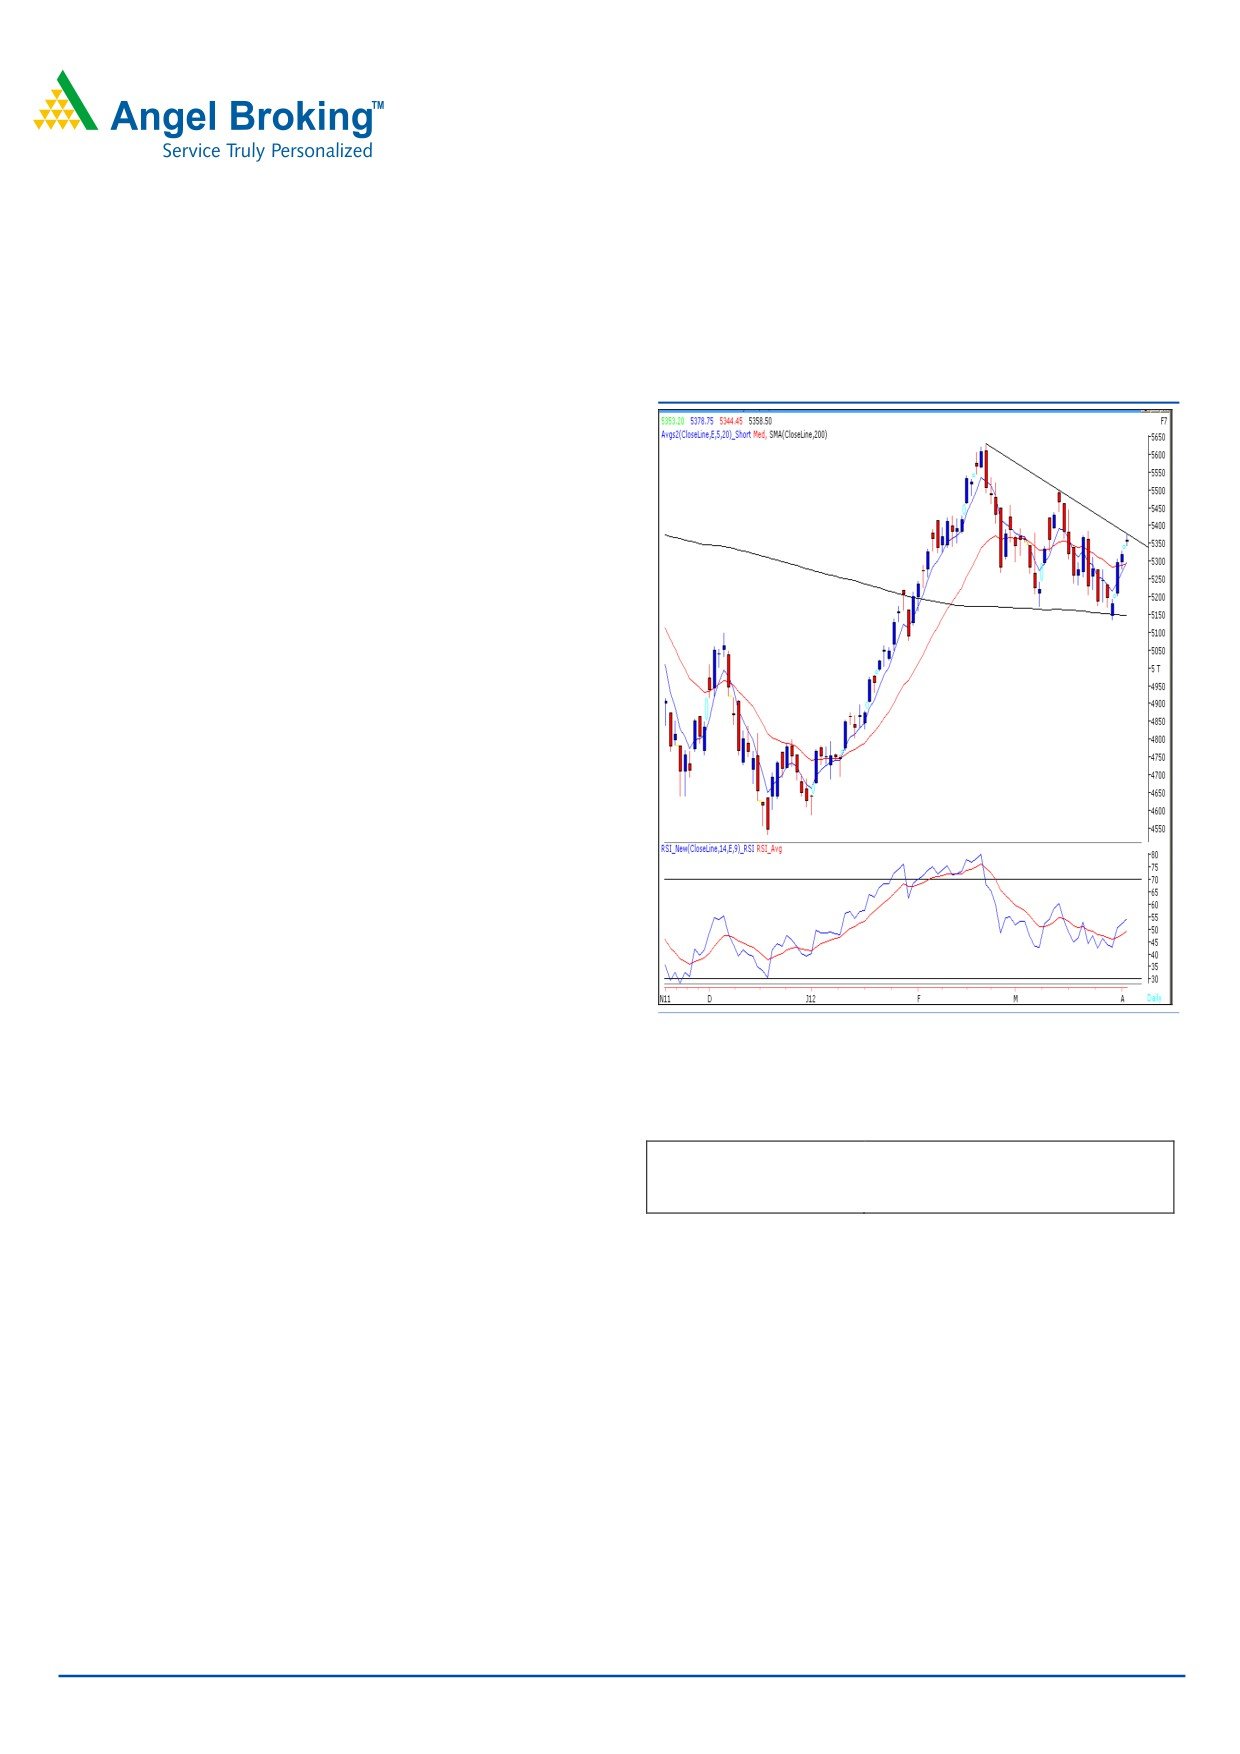
Exhibit 1: Nifty Daily Chart
Yesterday, we witnessed a gap up opening in-line with other
global bourses and subsequently managed to hold their
early gains throughout the session. Eventually, indices
closed marginally above 5350 mark. On sectoral front,
Consumer Durables, Capital Goods and Oil & Gas
counters were among the major gainers, whereas Health
Care and Auto sectors ended with a nominal loss. The
advance to decline ratio was strongly in favor of advancing
Formation:
• The 200-day SMA (Simple Moving Average) and 20-
day EMA (Exponential Moving Average) have now shifted to
17100 / 5150 and 17380 / 5284, respectively.
• The ‘20-Week EMA’ is placed at 17200 / 5200 level.
• We are witnessing a ‘Downward Sloping Trend Line’
resistance around 17630 / 5380 level.
• The daily ‘RSI-Smoothened’ momentum oscillator has
Source: Falcon
given a positive crossover.
Actionable points:
Trading strategy:
View
Neutral
Yesterday, after a gap up opening our indices traded with
Resistance Levels
5380 - 5430
positive bias in the first half of the trading session. As
Support Levels
5325 - 5300
expected, the Indices faced resistance near the ‘Downward
Sloping Trend Line’ mentioned in our previous reports near
5380 level. At this juncture, the placement of “5 & 20
EMA” on the Daily chart suggests that positive momentum is
likely to continue once indices trade convincingly above the
‘Downward Sloping Trend Line” which coincides with
Yesterday’s high of 17664 / 5379. In such scenario, indices
are likely to rally further towards 17700 - 17836 / 5400 -
5430 levels. Since the momentum oscillators on the hourly
chart are in overbought zone, a consolidation or a minor
pullback cannot be ruled out. On the downside, 17500 -
17420 / 5325 - 5300 levels can act as a decent support
for the markets in coming trading session.
For Private Circulation Only |
1
Technical Research | April 04, 2012
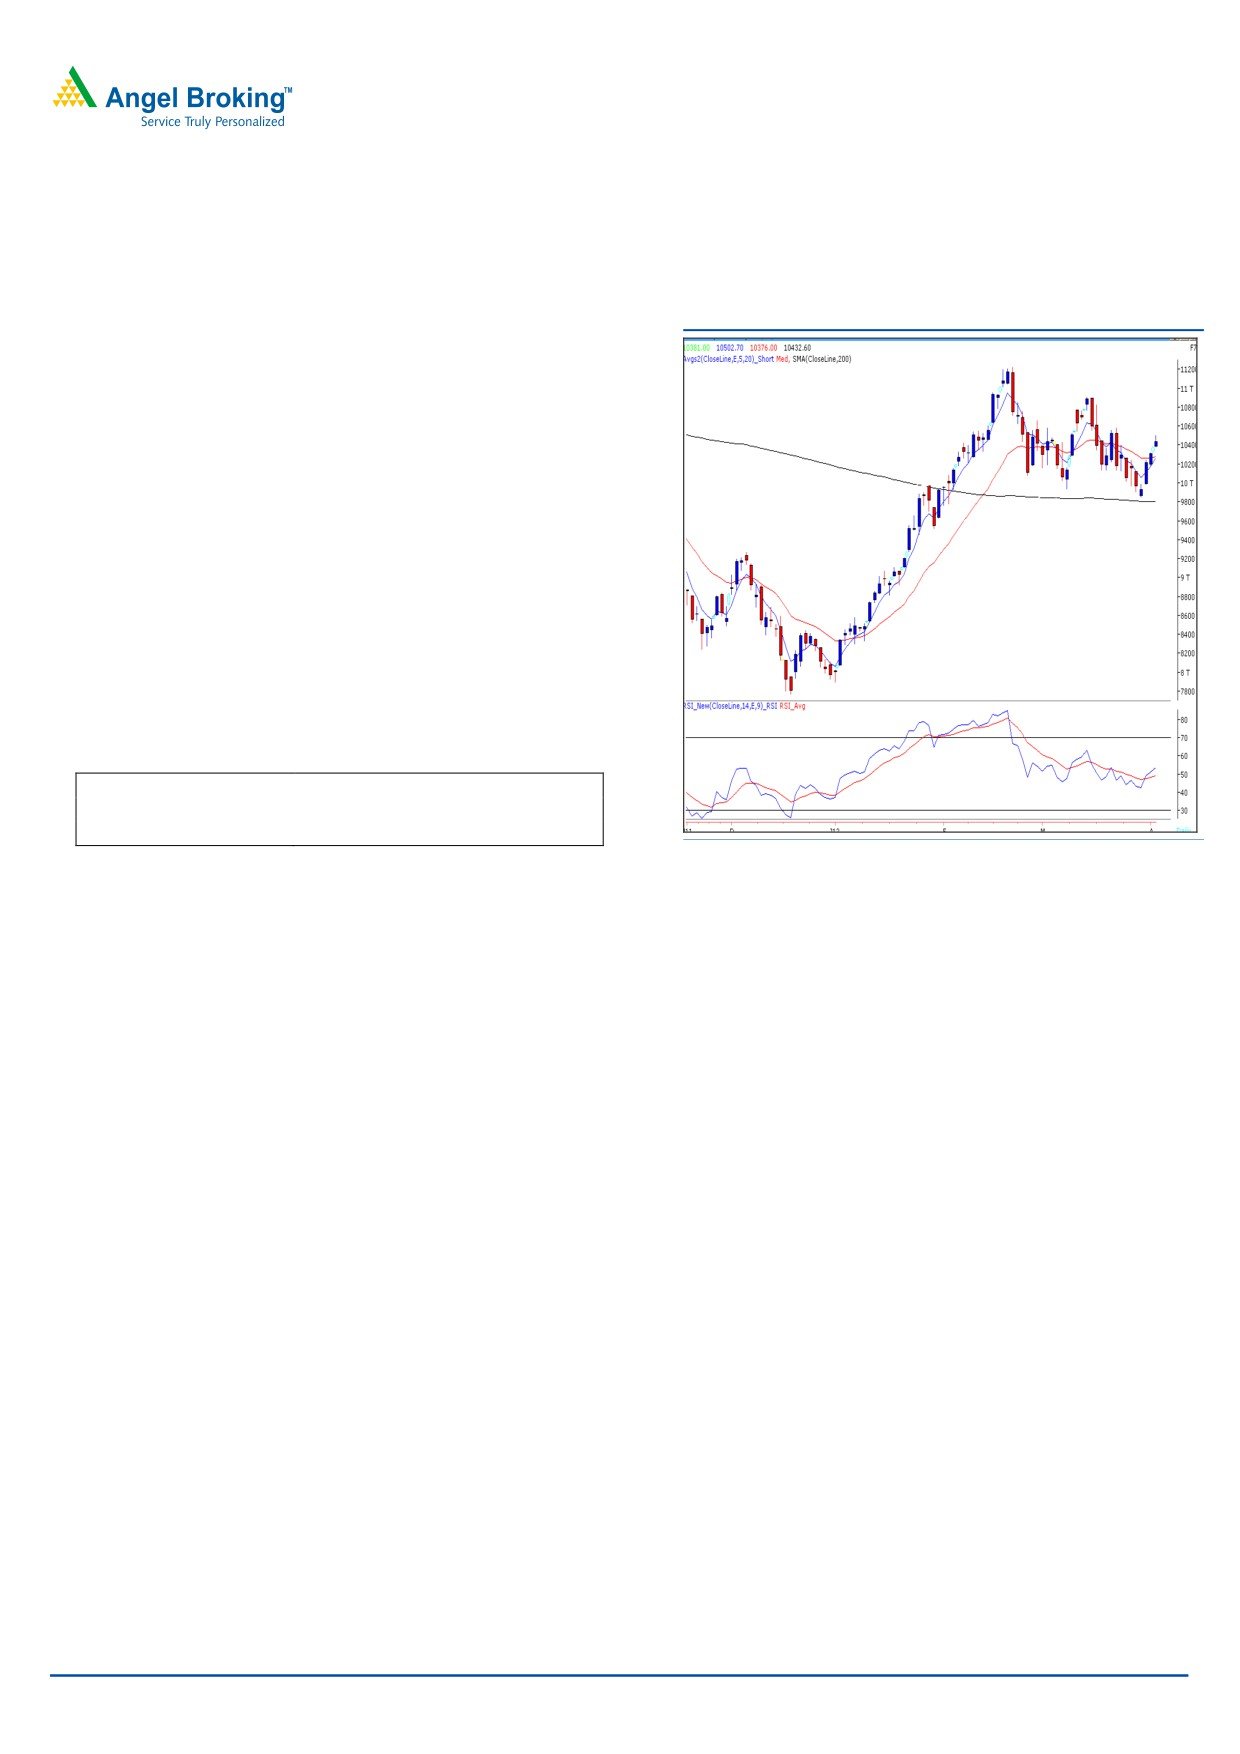
Bank Nifty Outlook - (10433)
Exhibit 2: Bank Nifty Daily Chart
Yesterday, Bank Nifty opened with an upside gap in line
with our benchmark indices and traded in a narrow
range throughput the session. The positive crossover in
“RSI and Stochastic” momentum oscillator on the daily
chart mentioned in our previous report is still intact.
However, the momentum oscillators on the hourly chart
are negatively poised hence possibility of a minor
pullback cannot be ruled out. On the downside, a fall
below 10376 will confirm the pullback and index may
drift towards 10251 - 10174. On the upside, 10503 -
10580 are likely to act as resistance in coming trading
session.
Actionable points:
View
Neutral
Resistance Levels
10503 - 10580
Support Levels
10376 - 10251 - 10174
Source: Falcon
For Private Circulation Only |
2
Technical Research | April 04, 2012
Positive Bias:
Positive
Expected
Stock Name
CMP
5 Day EMA
20 Day EMA
Remarks
Above
Target
NCC
56.3
53.8
53.6
58
65
View will change below 53
Negative Bias:
Negative
Expected
Stock Name
CMP
5 Day EMA
20 Day EMA
Remarks
Below
Target
Havells
588.6
580.4
568
585
570
View will change above
606
For Private Circulation Only |
3
Technical Research | April 04, 2012
Daily Pivot Levels for Nifty 50 Stocks
SCRIPS
S2
S1
PIVOT
R1
R2
SENSEX
17,516
17,557
17,611
17,651
17,705
NIFTY
5,326
5,342
5,361
5,377
5,395
BANKNIFTY
10,310
10,372
10,437
10,498
10,564
ACC
1,341
1,353
1,363
1,375
1,385
AMBUJACEM
167
169
172
173
176
AXISBANK
1,147
1,162
1,173
1,188
1,199
BAJAJ-AUTO
1,621
1,634
1,652
1,665
1,683
BHARTIARTL
330
334
339
342
347
BHEL
256
260
265
269
274
BPCL
673
689
699
715
725
CAIRN
338
347
353
363
369
CIPLA
308
310
312
314
316
COALINDIA
337
340
344
347
350
DLF
203
205
208
210
213
DRREDDY
1,643
1,668
1,711
1,736
1,779
GAIL
376
380
383
386
389
HCLTECH
495
500
503
509
512
HDFC
679
683
686
690
693
HDFCBANK
523
527
532
535
540
HEROMOTOCO
1,965
1,987
2,027
2,049
2,089
HINDALCO
128
130
131
133
135
HINDUNILVR
398
401
405
408
412
ICICIBANK
888
898
908
919
929
IDFC
134
136
137
139
141
INFY
2,824
2,841
2,860
2,877
2,895
ITC
226
226
227
228
229
JINDALSTEL
533
538
544
549
555
JPASSOCIAT
85
87
88
90
91
KOTAKBANK
551
555
560
564
568
LT
1,332
1,347
1,357
1,372
1,382
M&M
696
701
708
714
721
MARUTI
1,275
1,292
1,321
1,338
1,367
NTPC
165
166
168
169
170
ONGC
268
271
273
276
278
PNB
918
925
932
939
947
POWERGRID
108
109
110
111
112
RANBAXY
453
460
464
470
474
RCOM
85
86
87
88
89
RELIANCE
735
744
753
762
772
RELINFRA
602
608
615
620
628
RPOWER
118
120
122
123
125
SAIL
96
97
98
100
101
SBIN
2,125
2,149
2,166
2,190
2,207
SESAGOA
192
195
197
201
203
SIEMENS
763
776
785
798
807
STER
109
111
112
114
115
SUNPHARMA
561
565
571
575
581
SUZLON
25
25
26
26
27
TATAMOTORS
273
277
280
284
286
TATAPOWER
100
101
101
102
103
TATASTEEL
470
474
478
482
486
TCS
1,155
1,166
1,187
1,198
1,219
WIPRO
438
442
446
450
453
Technical Research Team
For Private Circulation Only |
4
Technical Report
RESEARCH TEAM
Shardul Kulkarni
Head - Technicals
Sameet Chavan
Technical Analyst
Sacchitanand Uttekar
Technical Analyst
Mehul Kothari
Technical Analyst
Ankur Lakhotia
Technical Analyst
Research Team: 022-3952 6600
DISCLAIMER: This document is not for public distribution and has been furnished to you solely for your information and must not
be reproduced or redistributed to any other person. Persons into whose possession this document may come are required to observe
these restrictions.
Opinion expressed is our current opinion as of the date appearing on this material only. While we endeavor to update on a
reasonable basis the information discussed in this material, there may be regulatory, compliance, or other reasons that prevent us
from doing so. Prospective investors and others are cautioned that any forward-looking statements are not predictions and may be
subject to change without notice. Our proprietary trading and investment businesses may make investment decisions that are
inconsistent with the recommendations expressed herein.
The information in this document has been printed on the basis of publicly available information, internal data and other reliable
sources believed to be true and are for general guidance only. While every effort is made to ensure the accuracy and completeness of
information contained, the company takes no guarantee and assumes no liability for any errors or omissions of the information. No
one can use the information as the basis for any claim, demand or cause of action.
Recipients of this material should rely on their own investigations and take their own professional advice. Each recipient of this
document should make such investigations as it deems necessary to arrive at an independent evaluation of an investment in the
securities of companies referred to in this document (including the merits and risks involved), and should consult their own advisors to
determine the merits and risks of such an investment. Price and value of the investments referred to in this material may go up or
down. Past performance is not a guide for future performance. Certain transactions - futures, options and other derivatives as well as
non-investment grade securities - involve substantial risks and are not suitable for all investors. Reports based on technical analysis
centers on studying charts of a stock's price movement and trading volume, as opposed to focusing on a company's fundamentals
and as such, may not match with a report on a company's fundamentals.
We do not undertake to advise you as to any change of our views expressed in this document. While we would endeavor to update
the information herein on a reasonable basis, Angel Broking, its subsidiaries and associated companies, their directors and
employees are under no obligation to update or keep the information current. Also there may be regulatory, compliance, or other
reasons that may prevent Angel Broking and affiliates from doing so. Prospective investors and others are cautioned that any
forward-looking statements are not predictions and may be subject to change without notice.
Angel Broking Limited and affiliates, including the analyst who has issued this report, may, on the date of this report, and from time
to time, have long or short positions in, and buy or sell the securities of the companies mentioned herein or engage in any other
transaction involving such securities and earn brokerage or compensation or act as advisor or have other potential conflict of interest
with respect to company/ies mentioned herein or inconsistent with any recommendation and related information and opinions.
Angel Broking Limited and affiliates may seek to provide or have engaged in providing corporate finance, investment banking or
other advisory services in a merger or specific transaction to the companies referred to in this report, as on the date of this report or
in the past.
Sebi Registration No: INB 010996539
For Private Circulation Only |