Daily Technical Report
August 02, 2012
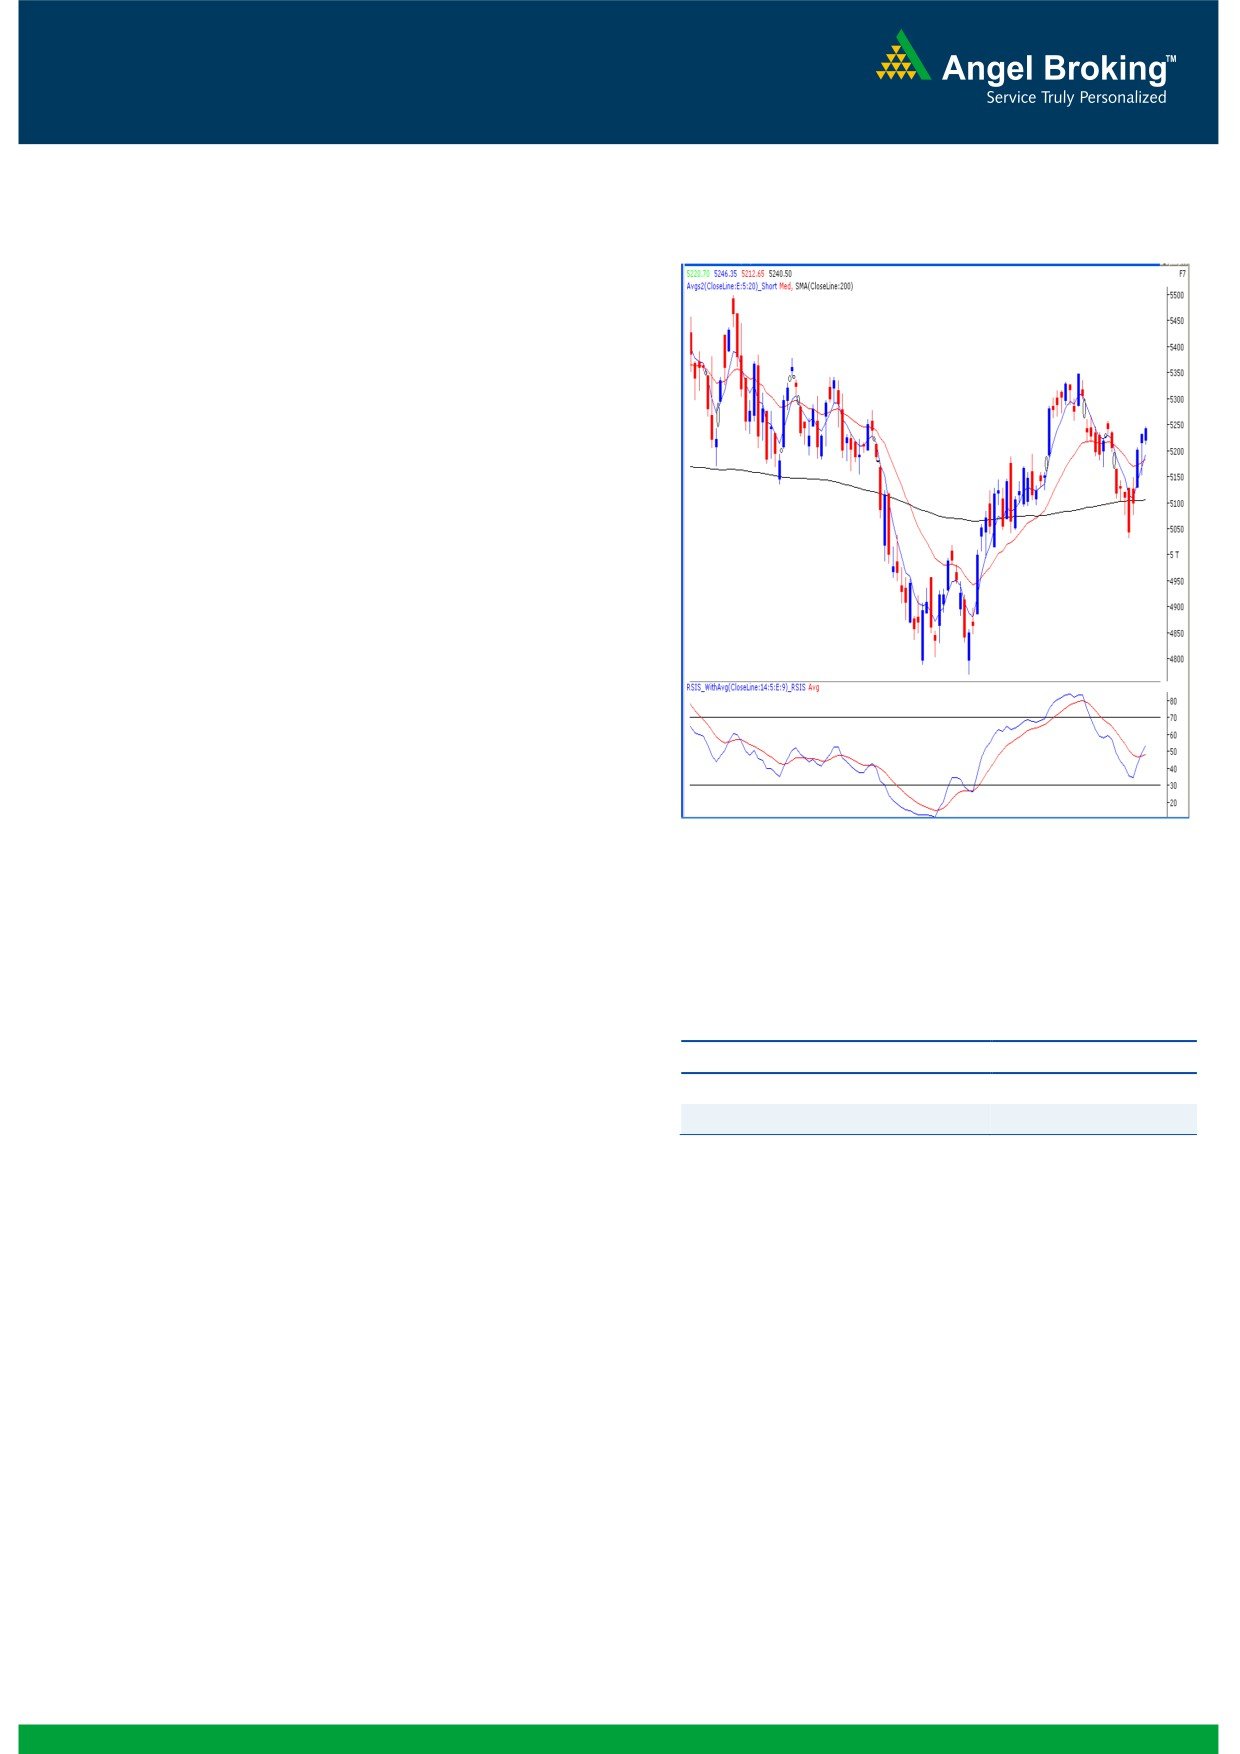
Exhibit 1: Nifty Daily Chart
Sensex (17257) / NIFTY (5241)
Yesterday, our benchmark indices opened flat in-line
with mixed global cues and subsequently traded with
choppiness throughout the session. However, the
underlying bias remained positive and we observed
lot of stock specific moves. Buying was seen mainly in
Healthcare, Capital Goods and Realty; whereas
Metal, Oil & Gas and IT counters ended with a
nominal loss. The advance to decline ratio was
strongly in favor of advancing counters (A=1723
Formation
On the weekly chart, we are witnessing a
“Downward Sloping Trend Line” resistance near
17500 / 5325 formed by joining the highs of
21109 / 6339 (November 5, 2010) - 18524 /
5630 (February 24, 2012).
The ’20-day EMA’ and
’200-day SMA’ are
placed at 17042 / 5169 and 16879 / 5100
Source: Falcon
levels, respectively.
We are now observing a positive crossover in
daily ‘RSI - Smoothened’.
Actionable points:
Trading strategy:
View
Bullish Above 5257
Broadly speaking, yesterday’s session was mainly
Expected Targets
5300
dominated by some individual stocks as indices
Support Level
5154 - 5129
maintained their positive undertone throughout the
day to close marginally in the positive territory. The
positive placement of momentum oscillators along
with moving averages is still intact. Therefore, the
outlook remains positive for coming trading session.
The immediate resistance is seen at 17318 / 5257
level. A move beyond this level may push indices
higher to test 17466 - 17575 / 5300 - 5335 levels.
On the downside, 17004 / 5154 level would act as
key support in coming trading sessions.
1
Daily Technical Report
August 02, 2012
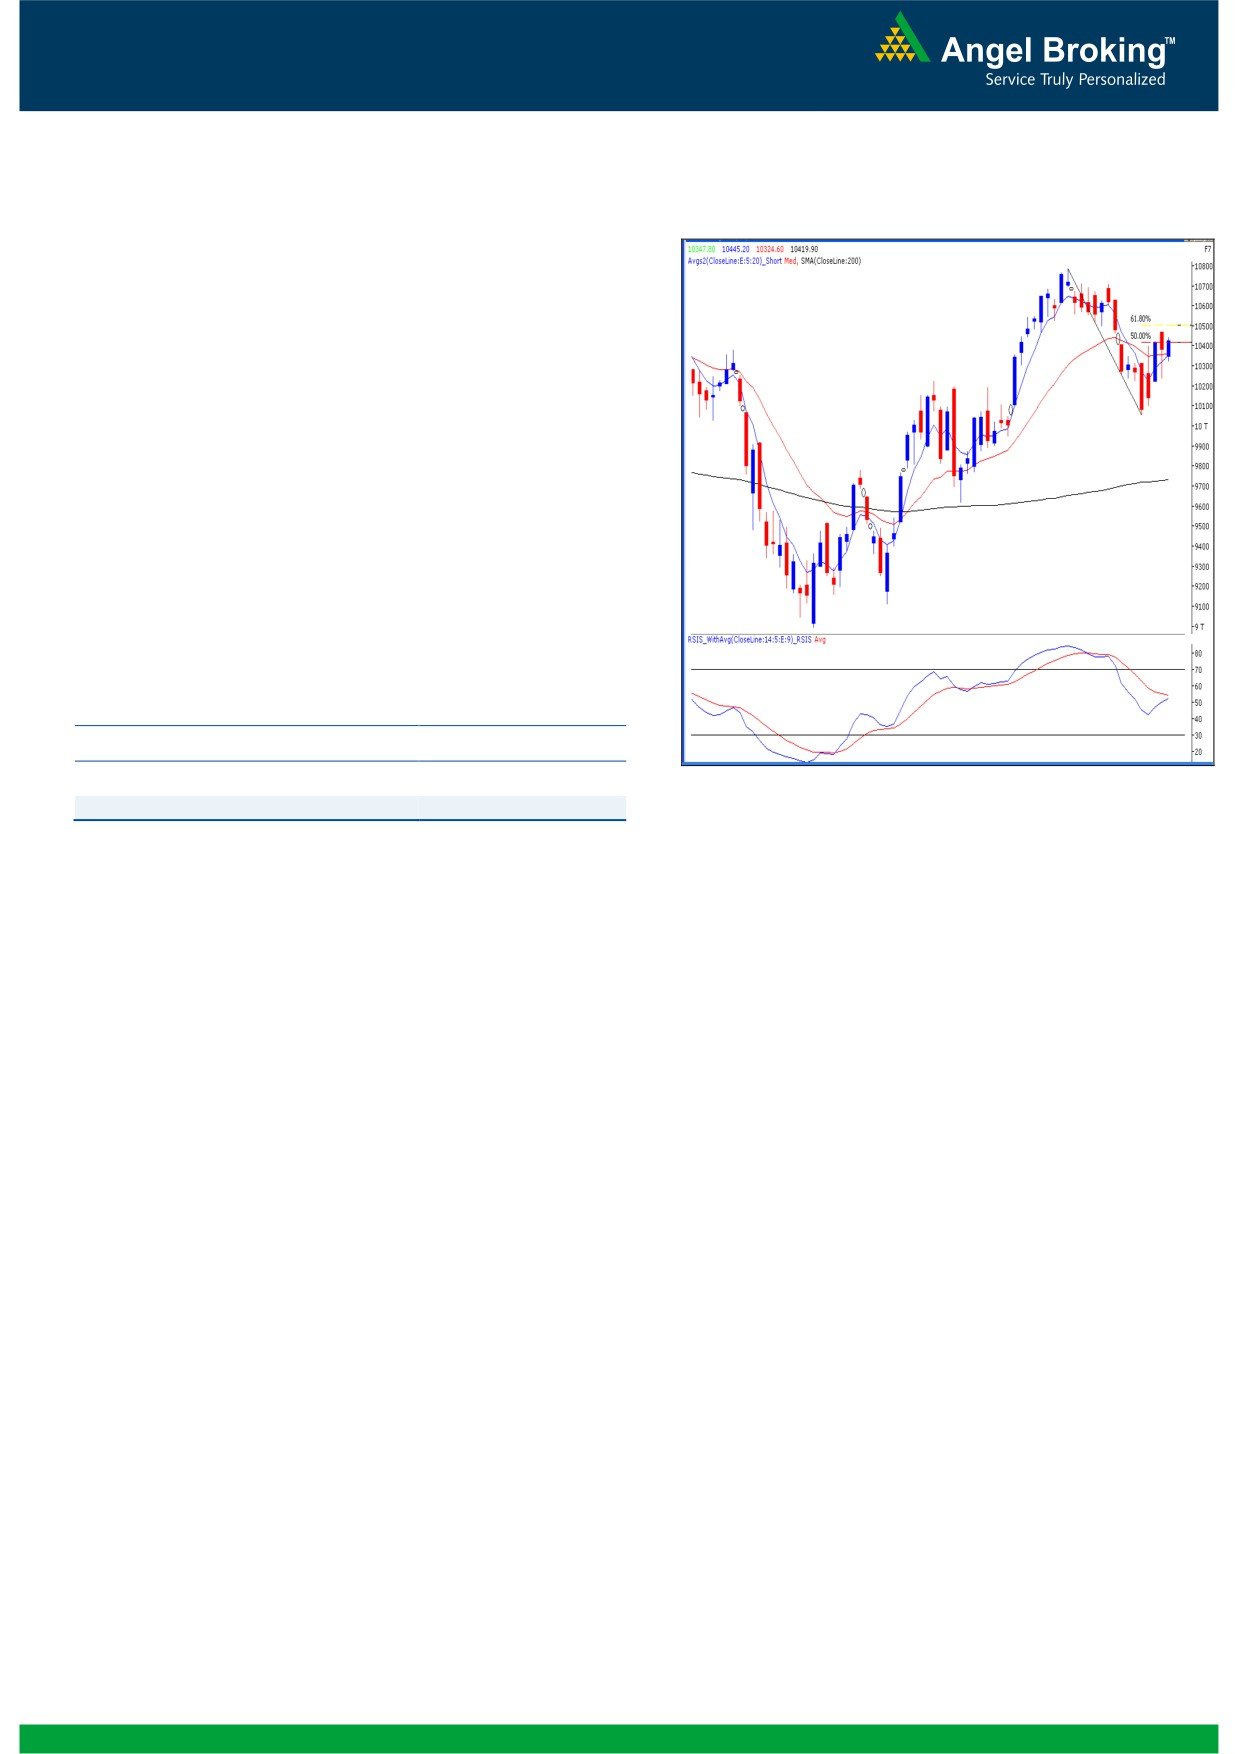
Exhibit 2: Bank Nifty Daily Chart
Bank Nifty Outlook - (10420)
Yesterday, Bank Nifty opened on a flat note and
traded in a narrow range throughout the session. The
momentum oscillators on the daily chart continue to
remain positive. However as mentioned in the
previous report the index is currently facing resistance
near 61.8% Fibonacci retracement level of the fall
from July 11, 2012 - July 26, 2012. Thus, we
reiterate our view that the index is likely to trade in the
range of 10500 - 10150. In the mentioned range
10468 level is likely to act as immediate resistance
and 10290 - 10235 levels are likely to act as support
in coming trading session.
Actionable points:
View
Neutral
Expected targets
10468 - 10500
Source: Falcon
Support Level
10290 - 10235
2
Daily Technical Report
August 02, 2012
Research Team Tel: 022 - 39357800
DISCLAIMER
This document is solely for the personal information of the recipient, and must not be singularly used as the basis of any investment
decision. Nothing in this document should be construed as investment or financial advice. Each recipient of this document should make
such investigations as they deem necessary to arrive at an independent evaluation of an investment in the securities of the companies
referred to in this document (including the merits and risks involved), and should consult their own advisors to determine the merits and
risks of such an investment.
Angel Broking Limited, its affiliates, directors, its proprietary trading and investment businesses may, from time to time, make
investment decisions that are inconsistent with or contradictory to the recommendations expressed herein. The views contained in this
document are those of the analyst, and the company may or may not subscribe to all the views expressed within.
Reports based on technical and derivative analysis center on studying charts of a stock's price movement, outstanding positions and
trading volume, as opposed to focusing on a company's fundamentals and, as such, may not match with a report on a company's
fundamentals.
The information in this document has been printed on the basis of publicly available information, internal data and other reliable
sources believed to be true, but we do not represent that it is accurate or complete and it should not be relied on as such, as this
document is for general guidance only. Angel Broking Limited or any of its affiliates/ group companies shall not be in any way
responsible for any loss or damage that may arise to any person from any inadvertent error in the information contained in this report.
Angel Broking Limited has not independently verified all the information contained within this document. Accordingly, we cannot testify,
nor make any representation or warranty, express or implied, to the accuracy, contents or data contained within this document. While
Angel Broking Limited endeavours to update on a reasonable basis the information discussed in this material, there may be regulatory,
compliance, or other reasons that prevent us from doing so.
This document is being supplied to you solely for your information, and its contents, information or data may not be reproduced,
redistributed or passed on, directly or indirectly.
Angel Broking Limited and its affiliates may seek to provide or have engaged in providing corporate finance, investment banking or
other advisory services in a merger or specific transaction to the companies referred to in this report, as on the date of this report or in
the past.
Neither Angel Broking Limited, nor its directors, employees or affiliates shall be liable for any loss or damage that may arise from or in
connection with the use of this information.
Note: Please refer to the important `Stock Holding Disclosure' report on the Angel website (Research Section). Also, please refer to the
latest update on respective stocks for the disclosure status in respect of those stocks. Angel Broking Limited and its affiliates may have
investment positions in the stocks recommended in this report.
Research Team
Shardul Kulkarni
-
Head - Technicals
Sameet Chavan
-
Technical Analyst
Sacchitanand Uttekar
-
Technical Analyst
Mehul Kothari
-
Technical Analyst
Ankur Lakhotia
-
Technical Analyst
Angel Broking Pvt. Ltd.
Registered Office: G-1, Ackruti Trade Centre, Rd. No. 7, MIDC, Andheri (E), Mumbai - 400 093.
Corporate Office: 6th Floor, Ackruti Star, MIDC, Andheri (E), Mumbai - 400 093. Tel: (022) 3952 6600
Sebi Registration No: INB 010996539
4