Daily Technical Report
July 02, 2012
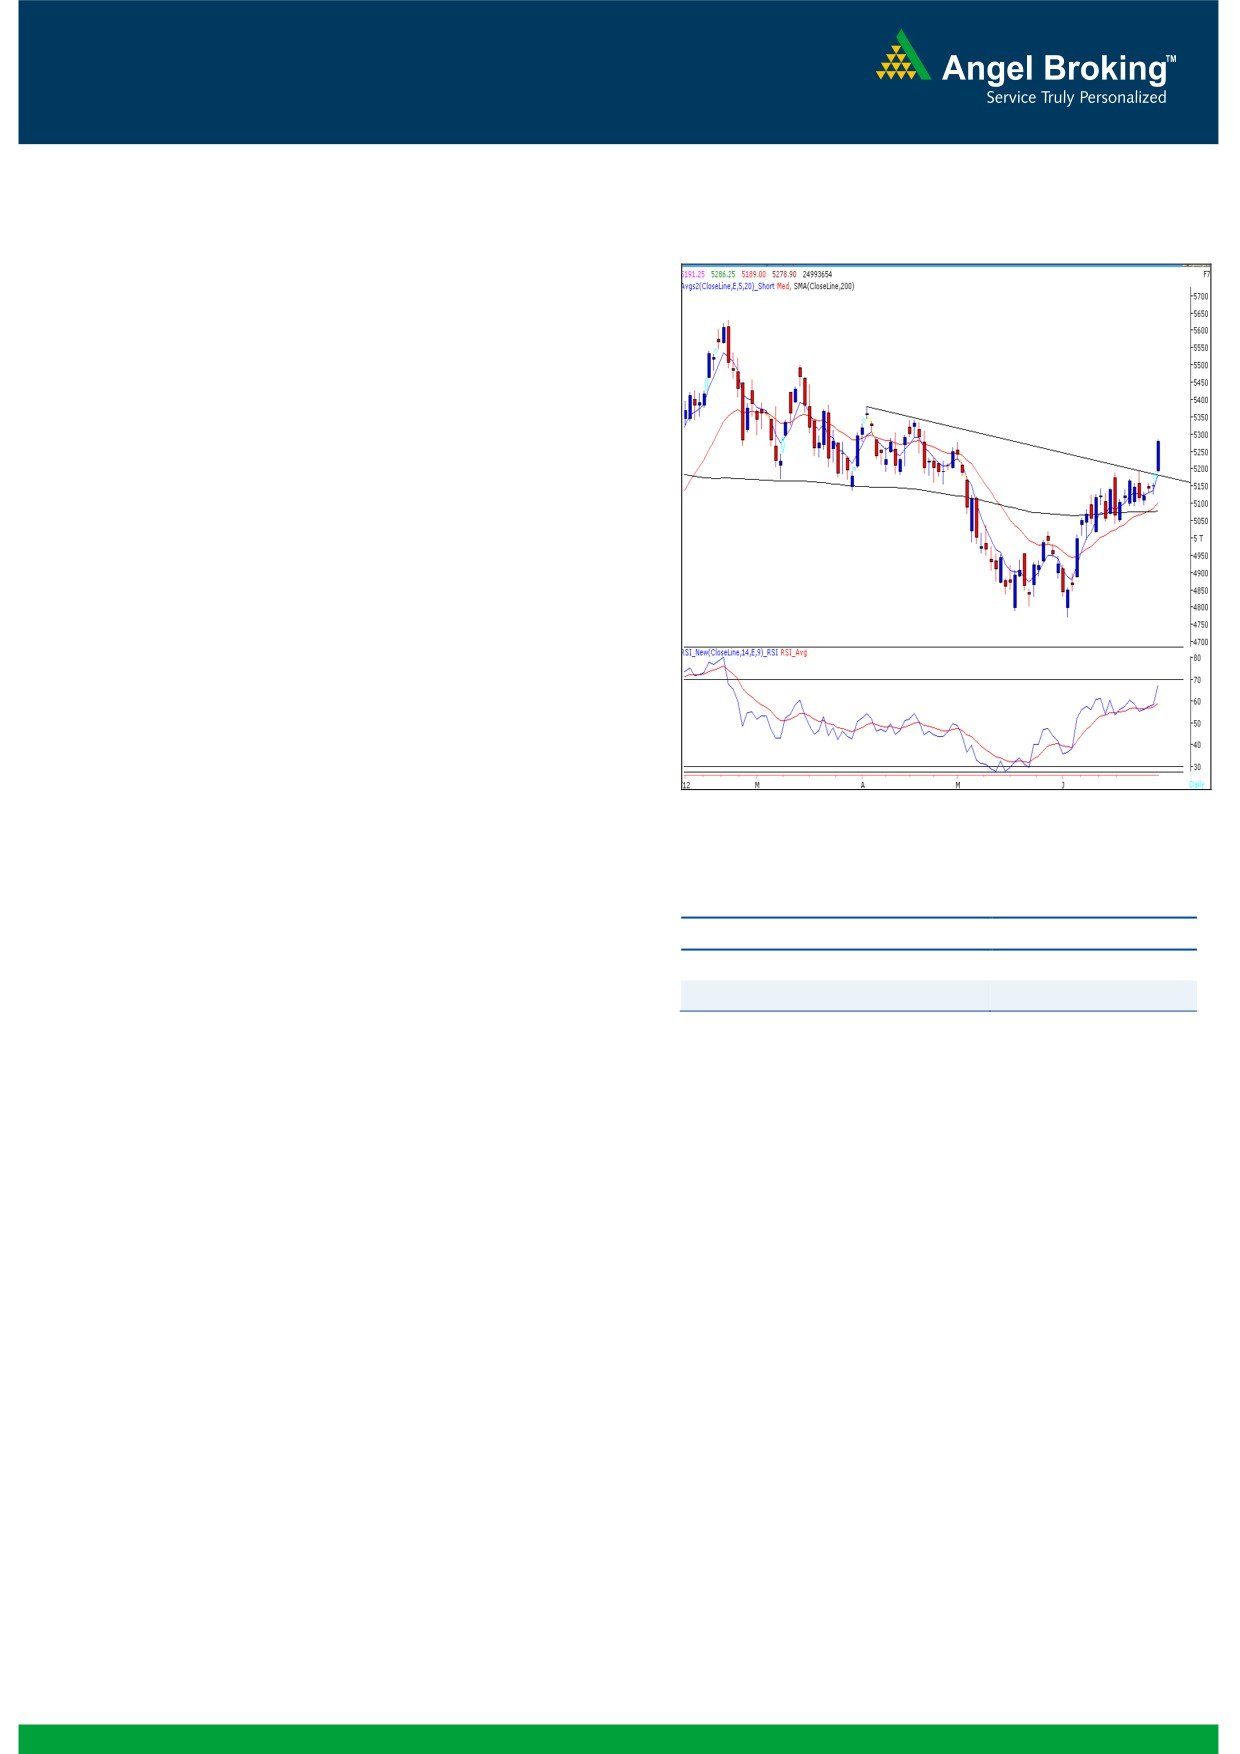
Exhibit 1: Nifty Daily Chart
Sensex (17430) / NIFTY (5279)
During Friday’s session, our benchmark indices closed
at a two-month high on the back of positive global
cues with gains of almost 2.5%. On sectoral front, all
the sectors contributed to the rally where Consumer
Goods, Power and Banking counters were among the
major gainers. The advance to decline ratio was
strongly in favor of advancing counters (A=1864
Formation
The 200-day SMA (Simple Moving Average) is
placed at 16810/ 5078 level.
Indices have taken support near 15860 / 4766
level, which is the 78.6% Fibonacci Retracement
level of the rise from 15135 / 4531 (Low on
December 23, 2011) to 18524 / 5630 (High on
February 22, 2012).
Source: Falcon
The weekly ‘RSI-Smoothened’ oscillator and ‘5 &
20 EMA’ are now signaling a positive crossover.
Actionable points:
Markets have taken support at the Monthly
‘Upward Sloping Trend Line’ and have formed a
View
Bullish Above 5290
‘Bullish Engulfing’ Pattern.
Expected Target
5340
Support Levels
5234 - 5189
Trading strategy:
The said pattern is a reversal pattern and will get
The much-awaited breakout above 5200 mark took
confirmed only if prices sustain above last month’s
place on Friday’s session, mainly on the back of
high of 17449 / 5287. Considering these technical
extremely positive news flow from global cues. As
evidences, we revise our targets for the previously
expected, the breakout resulted in enhanced buying
recommended long positions and expect higher
by market participants and indices rallied significantly
levels of 17687 - 18041 / 5386 - 5500 in the
after the gap-up opening to close marginally below
coming weeks. We continue to remain optimistic on
5300 mark. Although markets have reached our
the markets and advise traders to use every dip as a
immediate target of 17400 / 5270, we still expect
buying opportunity. Conversely, 17131 / 5195 will
higher levels mainly due to the following technical
now act as a strong support level for the markets.
evidences. The weekly ‘RSI-Smoothened’ oscillator
Only a breach of 16800 / 5090 level may result in
and ‘5 & 20 EMA’ are now signaling a positive
loss of this short-term positive momentum.
crossover, which signifies enormous strength in this
rally. We are also observing that markets have taken
support at the Monthly ‘Upward Sloping Trend Line’
drawn by joining two monthly lows of October 2008
and December 2011 and have formed the ‘Bullish
Engulfing’ Pattern. This pattern has more significance
as it is formed near the strong support zone of
Upward Sloping Trend Line as well as
78.6%
Fibonacci Retracement Level of 15860 / 4760.
1
Daily Technical Report
July 02, 2012
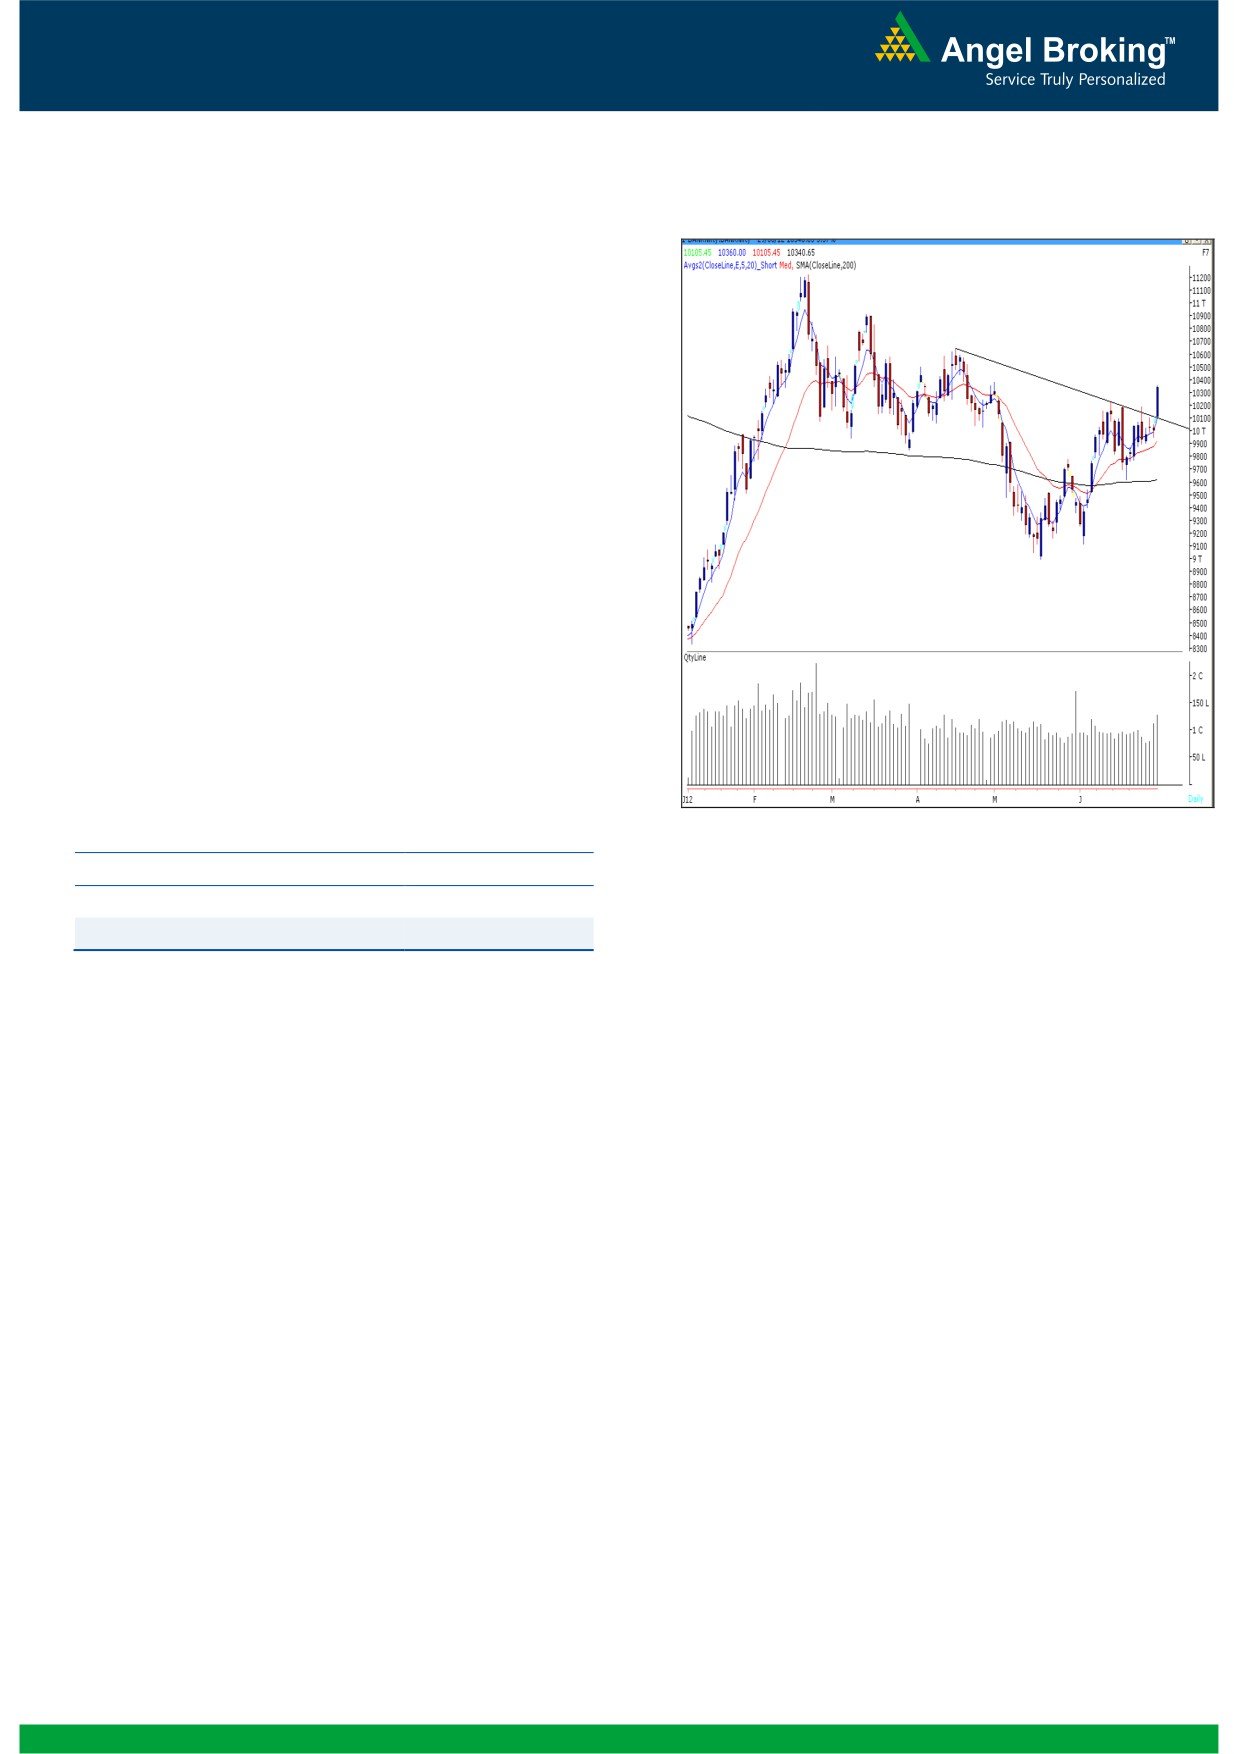
Exhibit 2: Bank Nifty Daily Chart
Bank Nifty Outlook - (10340)
On Friday, Bank Nifty opened with an upside gap
and gained strength as the day progressed to close
near the highest point of the day. The index managed
to breakout outside the trading range of 9760 -
10230. We are now witnessing a breakaway gap
which indicates bullishness in the short term time
frame. The positive crossover in “5 & 20 EMA” on the
weekly chart has been confirmed as the index
managed to close above the
10230 level. The
momentum oscillators on the daily and weekly chart
are positively poised. Thus if the index manages to
sustain above Friday’s high of 10360 then it is likely
to rally towards 10501 - 10555 levels. On the
downside the gap area of 10150 - 10050 is likely to
act as support in coming trading session. Positional
traders holding long positions can further trail their
stop loss to the 10050 mark (Closing basis) on Bank
Nifty spot.
Actionable points:
Source: Falcon
View
Bullish Above 10360
Resistance Levels
10055 - 10110
Support Levels
9900 - 9870
2
Daily Technical Report
July 02, 2012
Daily Pivot Levels for Nifty 50 Stocks
SCRIPS
S2
S1
PIVOT
R1
R2
SENSEX
17,024
17,227
17,338
17,541
17,652
NIFTY
5,154
5,217
5,251
5,314
5,349
BANKNIFTY
10,014
10,177
10,269
10,432
10,523
ACC
1,211
1,240
1,257
1,285
1,302
AMBUJACEM
170
172
174
176
177
ASIANPAINT
3,723
3,806
3,853
3,936
3,983
AXISBANK
976
996
1,007
1,027
1,038
BAJAJ-AUTO
1,546
1,560
1,569
1,583
1,592
BANKBARODA
718
725
730
737
742
BHARTIARTL
300
302
305
308
310
BHEL
220
226
230
236
239
BPCL
733
739
746
752
759
CAIRN
293
301
310
317
326
CIPLA
306
311
315
320
323
COALINDIA
337
342
348
353
359
DLF
195
197
198
200
202
DRREDDY
1,608
1,628
1,641
1,661
1,673
GAIL
341
347
351
356
361
GRASIM
2,540
2,590
2,626
2,677
2,713
HCLTECH
456
466
472
482
488
HDFC
645
649
652
656
659
HDFCBANK
547
555
560
568
573
HEROMOTOCO
2,068
2,109
2,134
2,175
2,200
HINDALCO
115
117
119
121
123
HINDUNILVR
447
451
457
461
467
ICICIBANK
857
878
891
913
926
IDFC
133
135
136
137
138
INFY
2,459
2,484
2,501
2,527
2,544
ITC
249
254
257
262
265
JINDALSTEL
419
445
460
485
500
JPASSOCIAT
72
73
73
74
75
KOTAKBANK
570
581
588
599
605
LT
1,341
1,370
1,385
1,414
1,429
M&M
693
700
706
714
720
MARUTI
1,126
1,148
1,162
1,184
1,198
NTPC
157
158
159
161
162
ONGC
276
280
283
288
290
PNB
789
799
804
814
819
POWERGRID
109
111
113
115
117
RANBAXY
482
486
492
496
502
RELIANCE
719
728
735
744
750
RELINFRA
539
549
555
564
570
SAIL
89
90
90
91
92
SBIN
2,109
2,134
2,152
2,177
2,195
SESAGOA
186
189
190
193
195
SIEMENS
707
721
730
744
753
STER
98
100
102
104
105
SUNPHARMA
606
621
633
648
660
TATAMOTORS
237
240
243
246
249
TATAPOWER
97
101
103
107
109
TATASTEEL
428
435
439
446
451
TCS
1,252
1,265
1,276
1,289
1,300
WIPRO
391
396
403
407
414
3
Daily Technical Report
July 02, 2012
Research Team Tel: 022 - 39357800
DISCLAIMER
This document is solely for the personal information of the recipient, and must not be singularly used as the basis of any investment
decision. Nothing in this document should be construed as investment or financial advice. Each recipient of this document should make
such investigations as they deem necessary to arrive at an independent evaluation of an investment in the securities of the companies
referred to in this document (including the merits and risks involved), and should consult their own advisors to determine the merits and
risks of such an investment.
Angel Broking Limited, its affiliates, directors, its proprietary trading and investment businesses may, from time to time, make
investment decisions that are inconsistent with or contradictory to the recommendations expressed herein. The views contained in this
document are those of the analyst, and the company may or may not subscribe to all the views expressed within.
Reports based on technical and derivative analysis center on studying charts of a stock's price movement, outstanding positions and
trading volume, as opposed to focusing on a company's fundamentals and, as such, may not match with a report on a company's
fundamentals.
The information in this document has been printed on the basis of publicly available information, internal data and other reliable
sources believed to be true, but we do not represent that it is accurate or complete and it should not be relied on as such, as this
document is for general guidance only. Angel Broking Limited or any of its affiliates/ group companies shall not be in any way
responsible for any loss or damage that may arise to any person from any inadvertent error in the information contained in this report.
Angel Broking Limited has not independently verified all the information contained within this document. Accordingly, we cannot testify,
nor make any representation or warranty, express or implied, to the accuracy, contents or data contained within this document. While
Angel Broking Limited endeavours to update on a reasonable basis the information discussed in this material, there may be regulatory,
compliance, or other reasons that prevent us from doing so.
This document is being supplied to you solely for your information, and its contents, information or data may not be reproduced,
redistributed or passed on, directly or indirectly.
Angel Broking Limited and its affiliates may seek to provide or have engaged in providing corporate finance, investment banking or
other advisory services in a merger or specific transaction to the companies referred to in this report, as on the date of this report or in
the past.
Neither Angel Broking Limited, nor its directors, employees or affiliates shall be liable for any loss or damage that may arise from or in
connection with the use of this information.
Note: Please refer to the important `Stock Holding Disclosure' report on the Angel website (Research Section). Also, please refer to the
latest update on respective stocks for the disclosure status in respect of those stocks. Angel Broking Limited and its affiliates may have
investment positions in the stocks recommended in this report.
Research Team
Shardul Kulkarni
-
Head - Technicals
Sameet Chavan
-
Technical Analyst
Sacchitanand Uttekar
-
Technical Analyst
Mehul Kothari
-
Technical Analyst
Ankur Lakhotia
-
Technical Analyst
Angel Broking Pvt. Ltd.
Registered Office: G-1, Ackruti Trade Centre, Rd. No. 7, MIDC, Andheri (E), Mumbai - 400 093.
Corporate Office: 6th Floor, Ackruti Star, MIDC, Andheri (E), Mumbai - 400 093. Tel: (022) 3952 6600
Sebi Registration No: INB 010996539
4