Daily Technical Report
May 02, 2012
Sensex (17319) / NIFTY (5248)
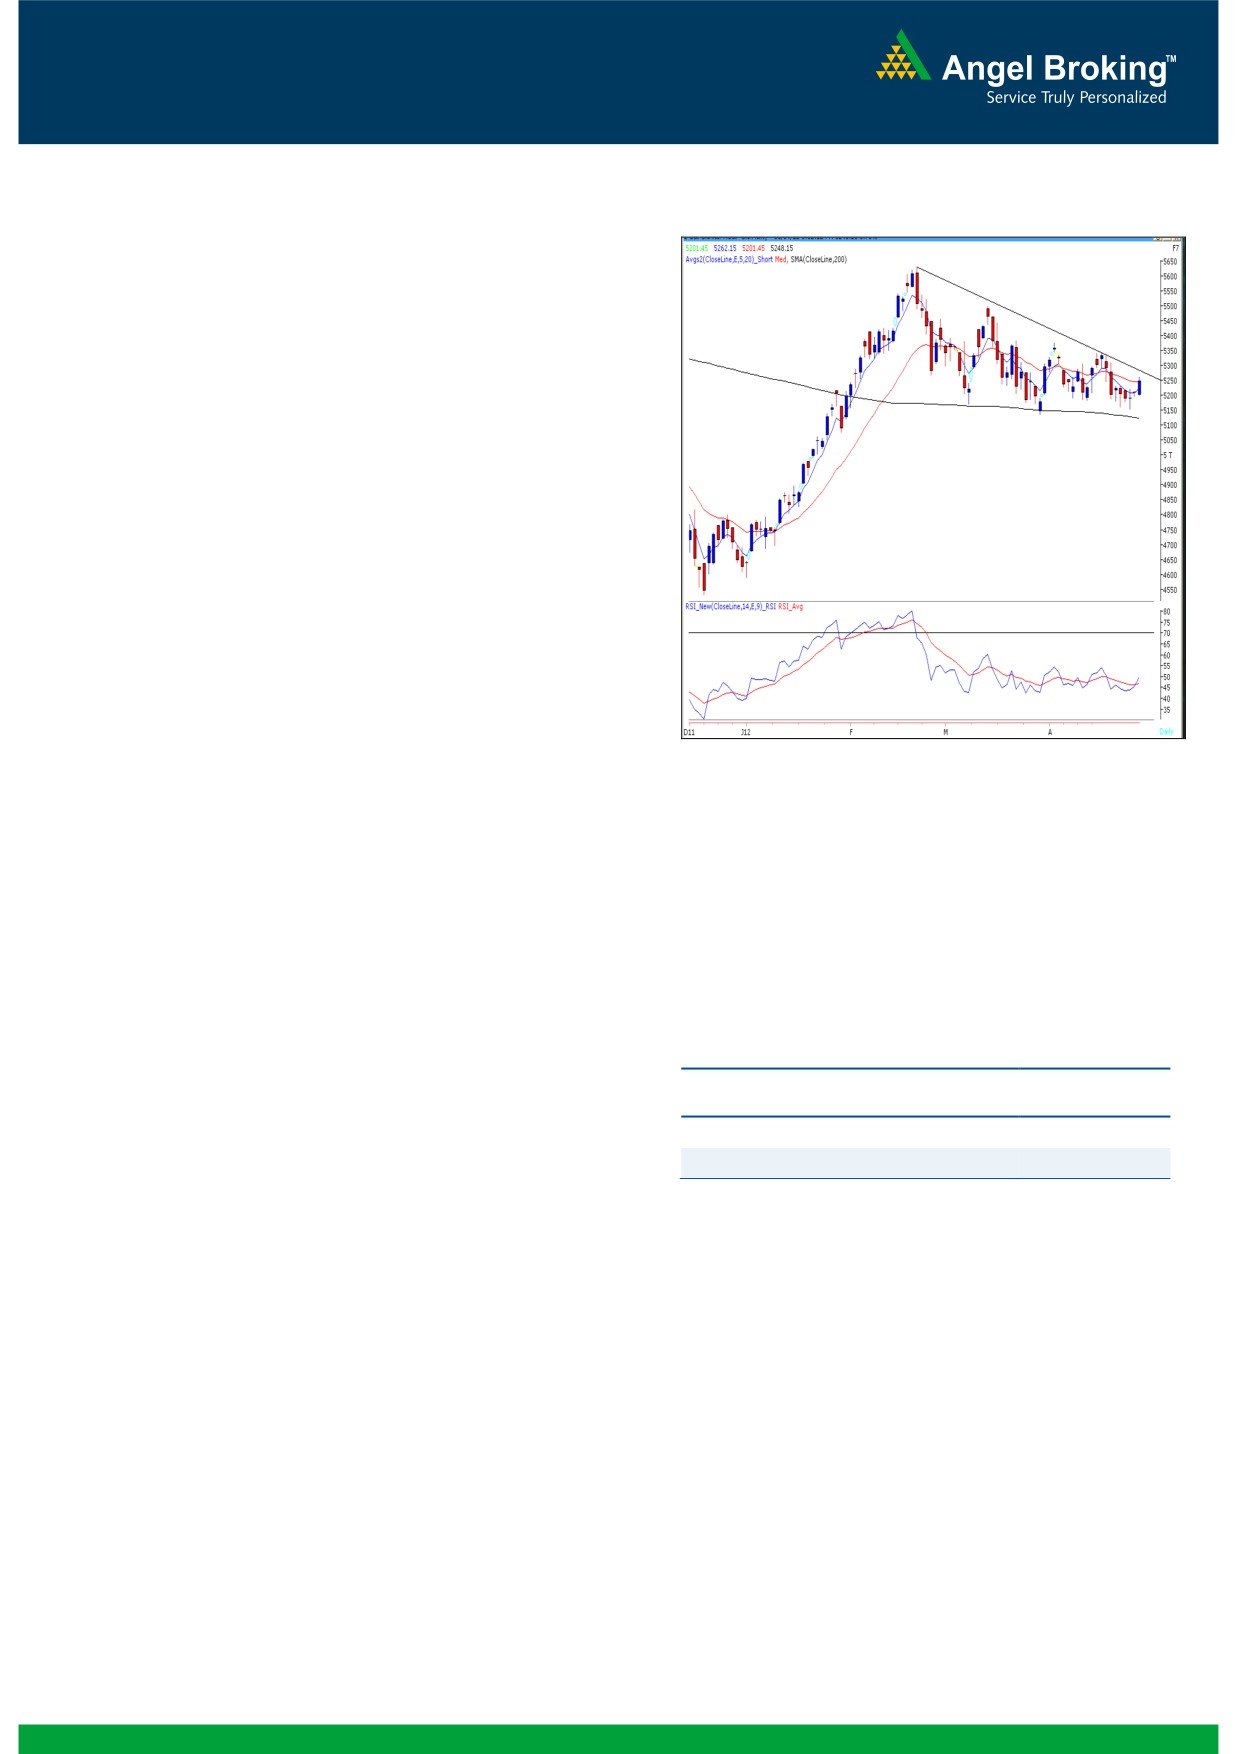
Exhibit 1: Nifty Daily Chart
On Monday, we witnessed a positive opening in-line
with strong cues from other Asian bourses.
Subsequently, indices surged higher as the day
progressed and eventually closed almost at the
highest point of the day. On sectoral front, IT, TECK
and Oil & Gas counters were among the major
gainers, whereas FMCG and Consumer Durables
counters ended with marginal loss. The advance to
decline ratio was in marginally favor of advancing
counters
(A=1174 D=1091) (Source
-
Formation
The 200-day SMA (Simple Moving Average) and
20-day EMA (Exponential Moving Average) have
now shifted to 17100 / 5135 and 17400 /
5250, respectively.
Source: Falcon
The ‘20-Week EMA’ is placed at 17200 / 5200
level.
We are now witnessing a ‘Downward Sloping
Trend Line’ resistance around 17350 / 5250
level.
The ‘RSI’ momentum oscillator on the daily chart
is signaling a positive crossover.
Trading strategy:
Actionable points:
Positive Above
On Monday, after a positive opening Indices have
View
5262
now moved towards the ‘Downward Sloping Trend
Expected Targets
5343 - 5441
Line’ resistance of 17350 / 5250 level mentioned in
Support Levels
5222 - 5200
our earlier reports. A sustainable move beyond
Monday’s high of 17360 / 5262 with significant
higher volumes would lead to a break out from this
resistance. Considering the global cues from the
Asian and American markets, it is highly probable
that this breakout would sustain and we may close
above the 17360 / 5262 mark. As a result, indices
may rally towards 17531 - 17664 / 5343 - 5441.
The daily ‘RSI’ momentum oscillator is signaling a
positive crossover and further augments the positive
outlook on the markets. On the downside 5223 -
5200 levels, may act as support in the coming trading
sessions.
1
Daily Technical Report
May 02, 2012
Bank Nifty Outlook - (10277)
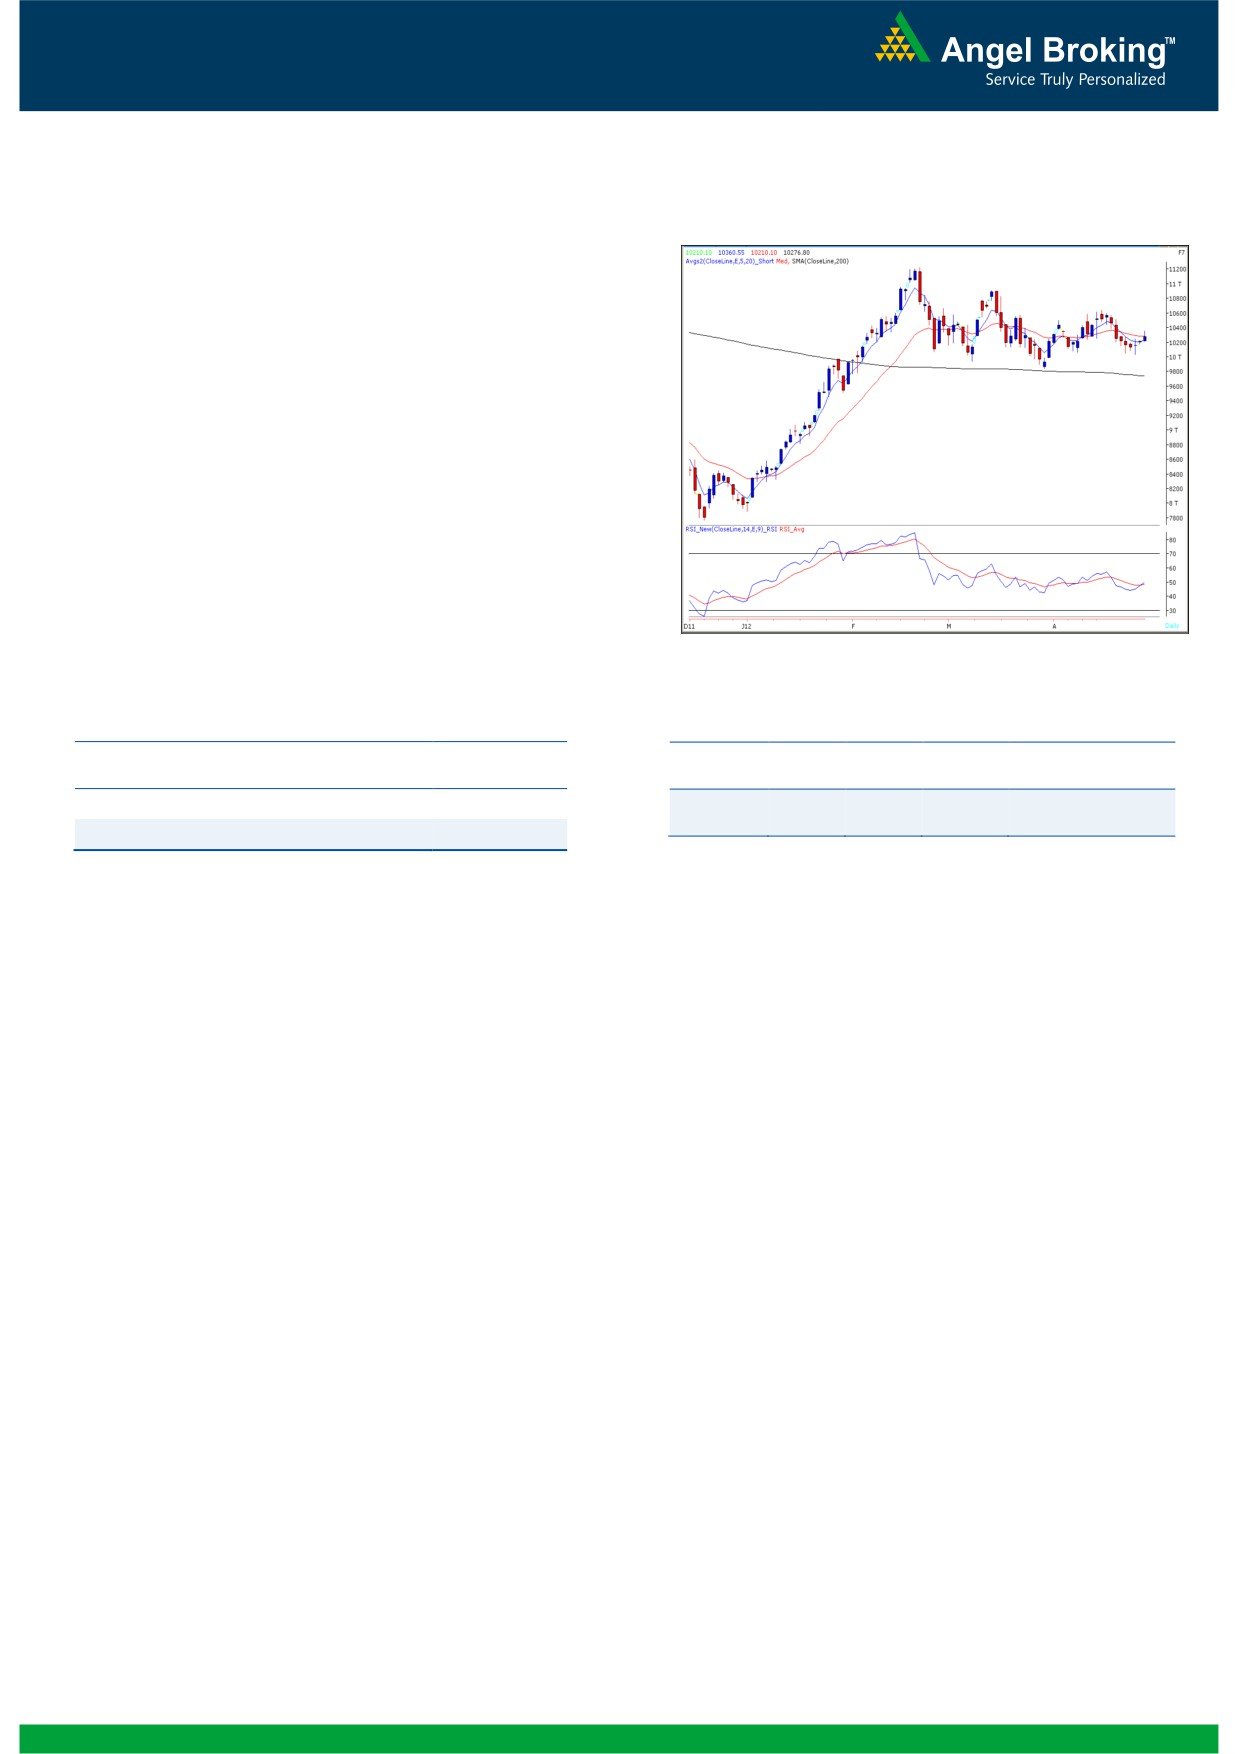
Exhibit 2: Bank Nifty Daily Chart
On Monday, Bank Nifty opened on a flat note in line
with our benchmark indices and gained strength as
the day progressed. The index tested the mentioned
resistance level of 10345. We had also mentioned in
our previous report that we are witnessing a positive
crossover in “RSI - Smoothened” momentum oscillator
on the hourly chart and possibility of a bounce back
cannot be ruled out. In addition, we are now
witnessing positive crossover in “RSI” momentum
oscillator on the daily chart. The effect of positive
crossover will be seen if the index sustains above
Monday’s high of 10360. In this case the index is
likely to rally towards 10408 - 10515 levels. On the
downside 10210 - 10150 levels are likely to act as
Source: Falcon
support in coming trading session.
Actionable points:
Positive Bias:
Positive Above
Stock
Positive Expected
View
CMP
Remarks
10360
Name
Above
Target
Expected Targets
10408 -10515
Hanung
View will be
139.5
144
158
Toys
negated below 135
Support Levels
10210 -10150
2
Daily Technical Report
May 02, 2012
Research Team Tel: 022 - 39357800
DISCLAIMER
This document is solely for the personal information of the recipient, and must not be singularly used as the basis of any investment
decision. Nothing in this document should be construed as investment or financial advice. Each recipient of this document should make
such investigations as they deem necessary to arrive at an independent evaluation of an investment in the securities of the companies
referred to in this document (including the merits and risks involved), and should consult their own advisors to determine the merits and
risks of such an investment.
Angel Broking Limited, its affiliates, directors, its proprietary trading and investment businesses may, from time to time, make
investment decisions that are inconsistent with or contradictory to the recommendations expressed herein. The views contained in this
document are those of the analyst, and the company may or may not subscribe to all the views expressed within.
Reports based on technical and derivative analysis center on studying charts of a stock's price movement, outstanding positions and
trading volume, as opposed to focusing on a company's fundamentals and, as such, may not match with a report on a company's
fundamentals.
The information in this document has been printed on the basis of publicly available information, internal data and other reliable
sources believed to be true, but we do not represent that it is accurate or complete and it should not be relied on as such, as this
document is for general guidance only. Angel Broking Limited or any of its affiliates/ group companies shall not be in any way
responsible for any loss or damage that may arise to any person from any inadvertent error in the information contained in this report.
Angel Broking Limited has not independently verified all the information contained within this document. Accordingly, we cannot testify,
nor make any representation or warranty, express or implied, to the accuracy, contents or data contained within this document. While
Angel Broking Limited endeavours to update on a reasonable basis the information discussed in this material, there may be regulatory,
compliance, or other reasons that prevent us from doing so.
This document is being supplied to you solely for your information, and its contents, information or data may not be reproduced,
redistributed or passed on, directly or indirectly.
Angel Broking Limited and its affiliates may seek to provide or have engaged in providing corporate finance, investment banking or
other advisory services in a merger or specific transaction to the companies referred to in this report, as on the date of this report or in
the past.
Neither Angel Broking Limited, nor its directors, employees or affiliates shall be liable for any loss or damage that may arise from or in
connection with the use of this information.
Note: Please refer to the important `Stock Holding Disclosure' report on the Angel website (Research Section). Also, please refer to the
latest update on respective stocks for the disclosure status in respect of those stocks. Angel Broking Limited and its affiliates may have
investment positions in the stocks recommended in this report.
Research Team
Shardul Kulkarni
-
Head - Technicals
Sameet Chavan
-
Technical Analyst
Sacchitanand Uttekar
-
Technical Analyst
Mehul Kothari
-
Technical Analyst
Ankur Lakhotia
-
Technical Analyst
Angel Broking Pvt. Ltd.
Registered Office: G-1, Ackruti Trade Centre, Rd. No. 7, MIDC, Andheri (E), Mumbai - 400 093.
Corporate Office: 6th Floor, Ackruti Star, MIDC, Andheri (E), Mumbai - 400 093. Tel: (022) 3952 6600
Sebi Registration No: INB 010996539
4