Technical Research | March 02, 2012
Daily Technical Report
Sensex (17584) / NIFTY (5340)
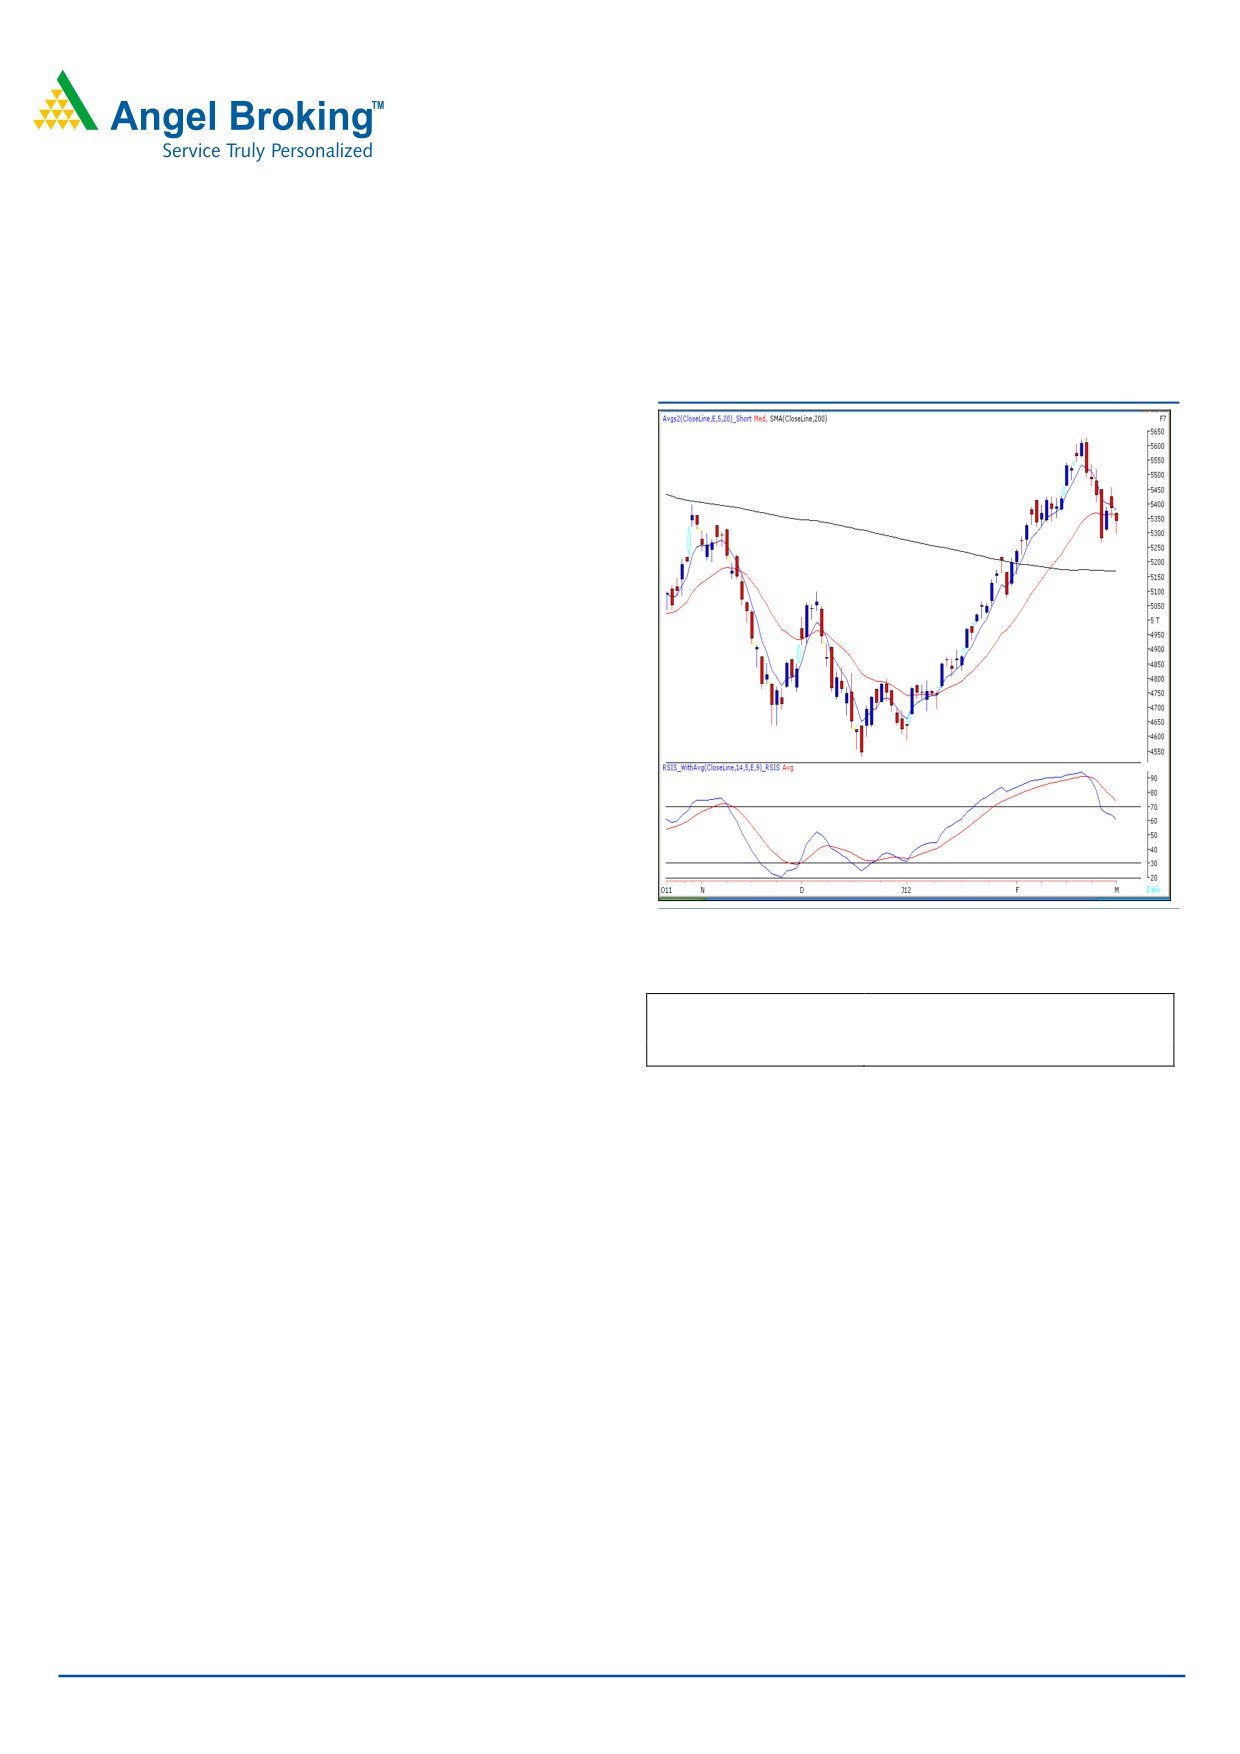
Exhibit 1: Nifty Daily Chart
Yesterday, markets opened with a downside gap and
traded with negative bias almost throughout the day. We
observed selling pressure on the violation of Wednesday’s
low of 17677 / 5352. This has resulted in closing well
inside the negative territory for the day. On the sectoral
front, Realty, Capital Goods and Banking counters were
among the major losers, whereas Health Care sector ended
with a nominal gain. The advance to decline ratio was in
favor of declining counters. (A=1243 D=1586) (Source -
Formation:
• The 200-day SMA and 20-day EMA have now shifted to
17200 / 5170 and 17692 / 5362, respectively.
• The weekly “Stochastic” oscillator is negatively poised.
Source: Falcon
Actionable points:
Trading strategy:
View
Neutral
Indices opened on a pessimistic note and continued to drift
Resistance Levels
5360 - 5397
downwards right from the initial trade of the session.
Support levels
5297 - 5268
Further, momentum increased on the downside on the
violation of 17677 / 5352 level. As a result, in line with
expectations, we witnessed a sharp corrective towards the
5300 mark. We are now observing that a minor bounce
during the latter part of the session pushed indices towards
“Hourly 20-EMA” and eventually closed marginally below it.
Hence, going forward, the immediate resistance is seen
around “Hourly 20-EMA” which is placed at 17670 / 5360
level. A move beyond this may push indices higher to test
17795 - 18000 / 5397 - 5459 levels. On the downside, a
breach of
17463
/
5297 level may intensify selling
pressure, which may drag indices towards 17381 - 1720 /
5268 - 5200 levels.
For Private Circulation Only |
1
Technical Research | March 02, 2012
Bank Nifty Outlook - (10283)
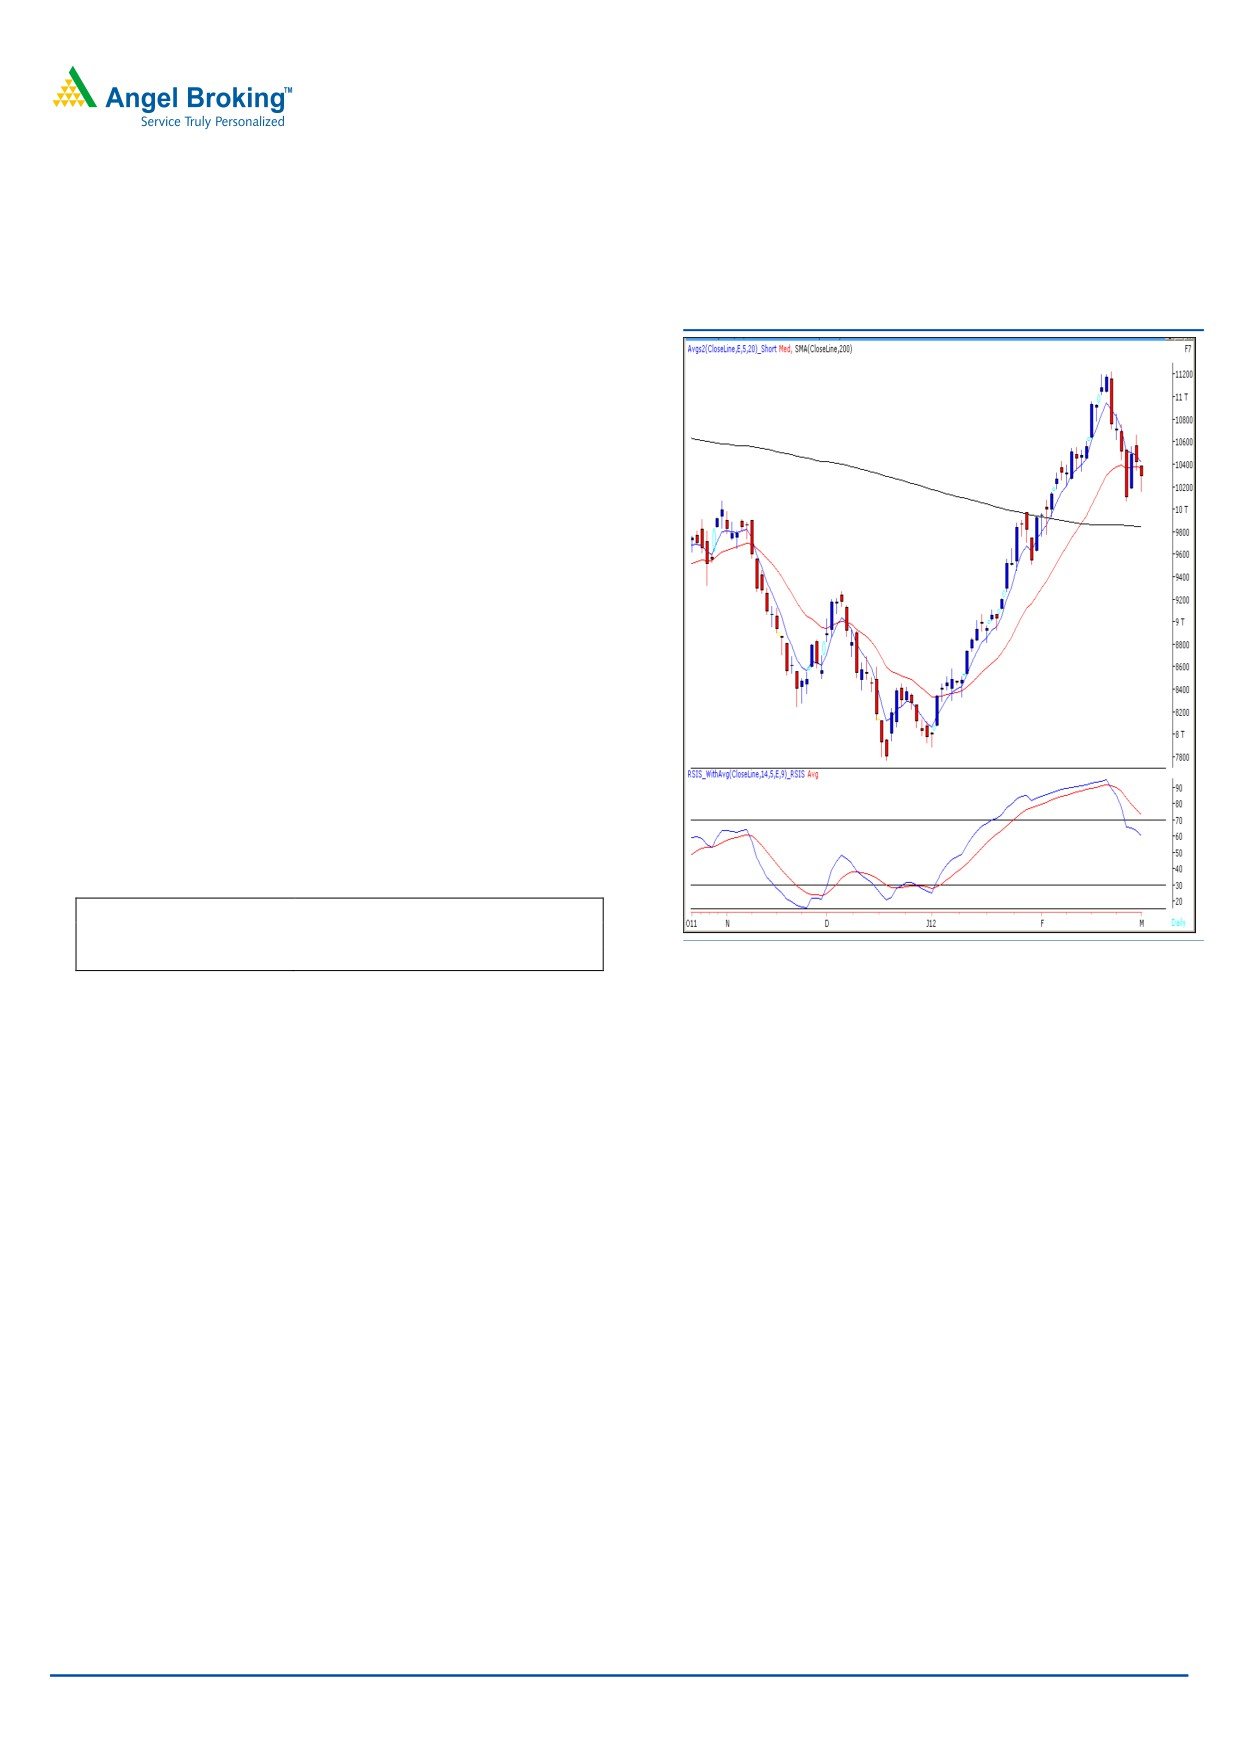
Exhibit 2: Bank Nifty Daily Chart
Yesterday, Bank Nifty opened on a flat note and selling
pressure was witnessed throughout the day which led the
index to close in the negative territory. The index traded in
our mentioned range of 10800 - 10200. The positive
crossover mentioned in “stochastic” momentum oscillator
in our previous report is still intact. We reiterate our view
that the index is likely to be in the range of 10800 -
10200. Only a sustainable move outside the said range
will dictate a clear direction of the trend. Within the
mentioned range the index is likely to find resistance at
10542 - 10667 - 10800 levels. On the downside a fall
below 10200 is likely to attract selling pressure and the
Bank nifty may test 10073 levels Any violation of the said
support level will intensify the selling pressure further
which may lead the index to test the support zone of
9900 - 9843.
Actionable points:
View
Neutral
Resistance Levels
10542 - 10667 - 10800
Support Levels
10200 - 10073
Source: Falcon
For Private Circulation Only |
2
Technical Research | March 02, 2012
Positive Bias:
Positive
Expected
Stock Name
CMP
5 Day EMA
20 Day EMA
Remarks
Above
Target
Bank of
822.8
809.9
804.9
829.7
875
View will change below
Baroda
814
Adani Power
78.2
77.9
78.7
78.9
86
View will change below
73.5
Negative Bias:
Negative
Expected
Stock Name
CMP
5 Day EMA
20 Day EMA
Remarks
Below
Target
Hero Motor
1937.5
1974.9
2001.6
1915
1790
View will change above
2015
For Private Circulation Only |
3
Technical Research | March 02, 2012
Daily Pivot Levels for Nifty 50 Stocks
SCRIPS
S2
S1
PIVOT
R1
R2
SENSEX
17,334
17,459
17,588
17,713
17,843
NIFTY
5,262
5,301
5,337
5,376
5,412
BANKNIFTY
10,053
10,171
10,278
10,396
10,503
ACC
1,258
1,290
1,317
1,349
1,376
AMBUJACEM
157
161
163
167
170
AXISBANK
1,111
1,132
1,153
1,174
1,196
BAJAJ-AUTO
1,706
1,740
1,779
1,813
1,853
BHARTIARTL
341
343
347
350
353
BHEL
290
295
300
305
310
BPCL
604
631
650
678
696
CAIRN
363
370
374
381
385
CIPLA
307
311
316
320
324
COALINDIA
327
331
335
338
342
DLF
184
199
212
227
240
DRREDDY
1,604
1,636
1,662
1,694
1,721
GAIL
363
368
374
379
385
HCLTECH
470
476
481
486
491
HDFC
655
662
667
674
678
HDFCBANK
497
505
514
522
531
HEROMOTOCO
1,884
1,911
1,947
1,973
2,009
HINDALCO
140
145
149
154
157
HINDUNILVR
375
377
380
383
386
ICICIBANK
853
868
885
901
918
IDFC
131
134
138
141
146
INFY
2,776
2,816
2,846
2,886
2,916
ITC
202
204
207
210
212
JINDALSTEL
549
562
576
589
603
JPASSOCIAT
72
73
75
77
79
KOTAKBANK
524
540
557
572
589
LT
1,239
1,259
1,281
1,301
1,324
M&M
646
664
686
704
727
MARUTI
1,221
1,268
1,295
1,342
1,369
NTPC
170
173
178
181
186
ONGC
278
283
290
295
301
PNB
918
933
947
962
975
POWERGRID
110
111
113
114
115
RANBAXY
417
421
427
431
437
RCOM
91
93
95
97
99
RELIANCE
793
802
810
819
828
RELINFRA
568
589
602
624
637
RPOWER
113
118
121
126
129
SAIL
95
98
101
105
108
SBIN
2,163
2,191
2,214
2,242
2,266
SESAGOA
207
210
213
216
219
SIEMENS
769
791
804
826
839
STER
120
122
124
126
128
SUNPHARMA
539
545
554
560
570
SUZLON
24
27
29
32
33
TATAMOTORS
260
264
269
272
277
TATAPOWER
112
114
116
118
119
TATASTEEL
449
456
464
471
479
TCS
1,202
1,211
1,219
1,228
1,236
WIPRO
411
418
426
432
440
Technical Research Team
For Private Circulation Only |
4
Technical Report
RESEARCH TEAM
Shardul Kulkarni
Head - Technicals
Sameet Chavan
Technical Analyst
Sacchitanand Uttekar
Technical Analyst
Mehul Kothari
Technical Analyst
Ankur Lakhotia
Technical Analyst
Research Team: 022-3952 6600
DISCLAIMER: This document is not for public distribution and has been furnished to you solely for your information and must not
be reproduced or redistributed to any other person. Persons into whose possession this document may come are required to observe
these restrictions.
Opinion expressed is our current opinion as of the date appearing on this material only. While we endeavor to update on a
reasonable basis the information discussed in this material, there may be regulatory, compliance, or other reasons that prevent us
from doing so. Prospective investors and others are cautioned that any forward-looking statements are not predictions and may be
subject to change without notice. Our proprietary trading and investment businesses may make investment decisions that are
inconsistent with the recommendations expressed herein.
The information in this document has been printed on the basis of publicly available information, internal data and other reliable
sources believed to be true and are for general guidance only. While every effort is made to ensure the accuracy and completeness of
information contained, the company takes no guarantee and assumes no liability for any errors or omissions of the information. No
one can use the information as the basis for any claim, demand or cause of action.
Recipients of this material should rely on their own investigations and take their own professional advice. Each recipient of this
document should make such investigations as it deems necessary to arrive at an independent evaluation of an investment in the
securities of companies referred to in this document (including the merits and risks involved), and should consult their own advisors to
determine the merits and risks of such an investment. Price and value of the investments referred to in this material may go up or
down. Past performance is not a guide for future performance. Certain transactions - futures, options and other derivatives as well as
non-investment grade securities - involve substantial risks and are not suitable for all investors. Reports based on technical analysis
centers on studying charts of a stock's price movement and trading volume, as opposed to focusing on a company's fundamentals
and as such, may not match with a report on a company's fundamentals.
We do not undertake to advise you as to any change of our views expressed in this document. While we would endeavor to update
the information herein on a reasonable basis, Angel Broking, its subsidiaries and associated companies, their directors and
employees are under no obligation to update or keep the information current. Also there may be regulatory, compliance, or other
reasons that may prevent Angel Broking and affiliates from doing so. Prospective investors and others are cautioned that any
forward-looking statements are not predictions and may be subject to change without notice.
Angel Broking Limited and affiliates, including the analyst who has issued this report, may, on the date of this report, and from time
to time, have long or short positions in, and buy or sell the securities of the companies mentioned herein or engage in any other
transaction involving such securities and earn brokerage or compensation or act as advisor or have other potential conflict of interest
with respect to company/ies mentioned herein or inconsistent with any recommendation and related information and opinions.
Angel Broking Limited and affiliates may seek to provide or have engaged in providing corporate finance, investment banking or
other advisory services in a merger or specific transaction to the companies referred to in this report, as on the date of this report or
in the past.
Sebi Registration No : INB 010996539
For Private Circulation Only |