Technical Research | January 02, 2012
Daily Technical Report
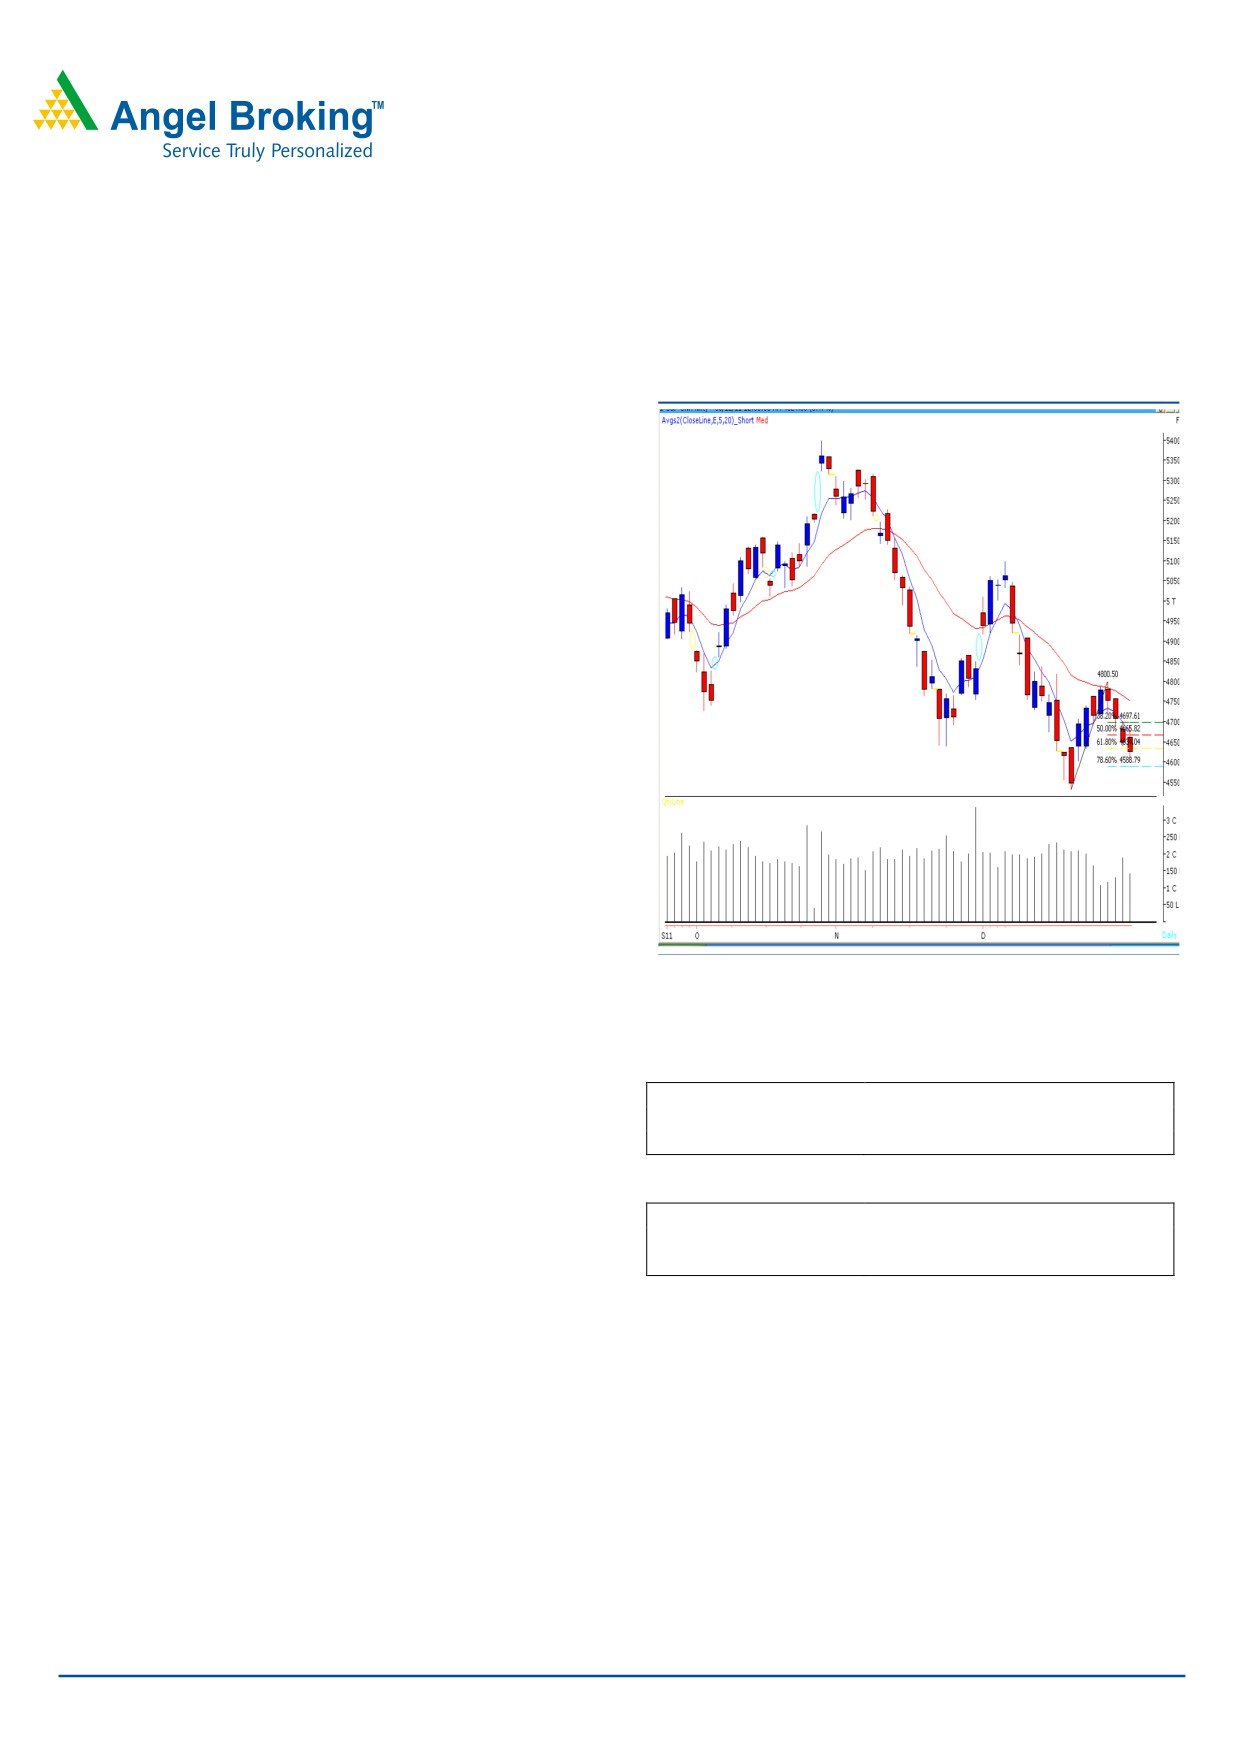
Sensex (15418) / NIFTY (4624)
Exhibit 1: Nifty Daily Chart
Markets opened with an upside gap on Friday’s session, but
failed to sustain at higher levels due to strong selling
pressure during the second half. Hence, indices closed
almost at the lowest point of the week. On the sectoral
front, Oil & Gas, Realty and Banking sectors were among
the major losers, whereas PSU and Health Care counters
ended with a nominal gain. The advance to decline ratio
was marginally in favor of declining counters. (A=1327
Formation
• The
20 - day EMA (Exponential Moving Average)
resistance zone is around 16020 - 16070 / 4800 - 4820
levels.
• On the Daily chart, the 61.80% and 78.60% Fibonacci
retracement levels of the rise from 15135 to 16049 / 4531
to
4801 are at 15485 /
4634 and 15331 /
4589,
Source: Falcon
respectively.
Actionable points:
Trading strategy:
View
Positive Above 4691
The fall seen during the later part of the week, after testing
Expected Targets
4726 - 4758
the 20 - Day EMA, suggests that 16020 - 16070 / 4800 -
Support levels
4609 - 4589 - 4531
4820 levels have now become a significant resistance zone
for the markets. Therefore, the upward momentum is likely
View
Negative Below 4609
to resume only if indices manage to sustain above this
Expected Targets
4589 - 4531
resistance zone. In this case, we may witness a further rally
Resistance levels
4691
towards 16286 - 16421/ 4881 - 4920 levels. At present,
Further, the recent bottom of 15135 / 4531 would act as a
we are observing that indices have closed marginally below
crucial support for the markets. The negative momentum
the 61.80% Fibonacci retracement level of 15485 / 4634.
may reinforce on the violation of this support. In this case,
The next immediate support is at 15331 / 4589, which is
indices may slide towards the next support levels of 14870 -
the 78.60% Fibonacci retracement level.
14400 / 4430 - 4300.
We wish everyone a Happy and Prosperous 2012.
For Private Circulation Only |
1
Technical Research | January 02, 2012
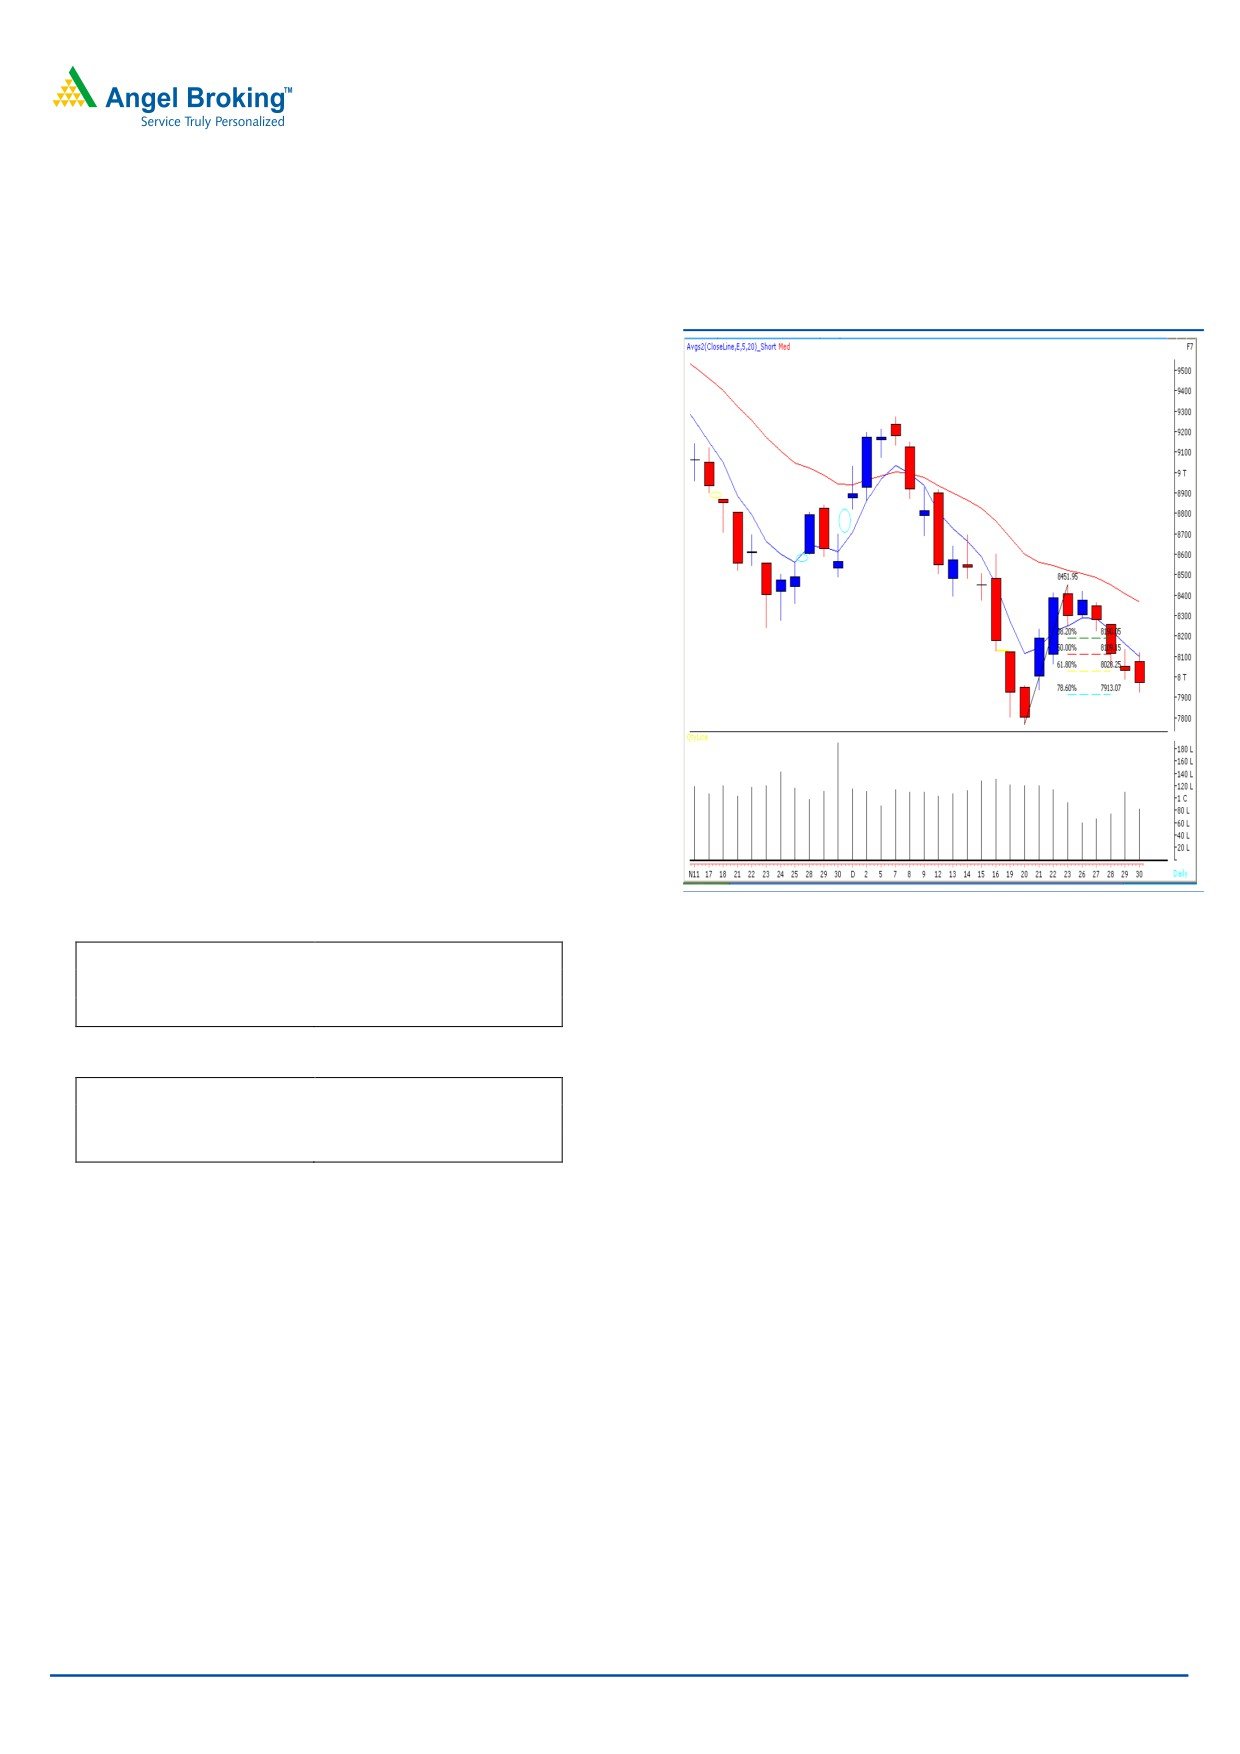
Bank Nifty Outlook - (7969)
Exhibit 2: Bank Nifty Daily Chart
Bank Nifty opened higher in-line with our benchmark
indices on Friday’s session. As expected and mentioned in
our earlier report, strong selling pressure was seen on the
violation of Thursday’s low of 7986 and index closed
near the lowest point of the day. It is now clear that the
Bank Nifty have tested the 78.60% (7925) Fibonacci
retracement level of the rise from 7766 to 8752. Going
forward, 7925 - 7913 is likely to act as a support zone. A
sustainable move below this support zone may reinforce
selling pressure, which may drag the index to test recent
bottom of 7766. On the upside, 8138 remains to be a
strong resistance in coming trading session. The upside
momentum is likely to resume only if Bank Nifty manages
to sustain above 8138 level. In this case, index is likely to
rally towards 8250 level.
Actionable points:
Source: Falcon
View
Positive Above 8138
Expected Target
8250
Support Level
7913 - 7766
View
Negative Below 7913
Expected Target
7766
Resistance Level
8138
For Private Circulation Only |
2
Technical Research | January 02, 2012
Positive Bias:
Expected
Stock Name
CMP
5 Day EMA
20 Day EMA
Remarks
Target
PFC
138.1
136.3
145.5
146
View will change below 131
Union Bank
169.8
167.3
183.4
184
View will change below 155
Negative Bias:
Expected
Stock Name
CMP
5 Day EMA
20 Day EMA
Remarks
Target
India Cem
66
67.7
69.7
62
View will change above 69
BomDyeing
345.7
355.3
365.6
325
View will change above 358
For Private Circulation Only |
3
Technical Research | January 02, 2012
Daily Pivot Levels for Nifty 50 Stocks
SCRIPS
S2
S1
PIVOT
R1
R2
SENSEX
15,232
15,343
15,519
15,630
15,806
NIFTY
4,560
4,592
4,641
4,674
4,723
BANKNIFTY
7,810
7,889
8,005
8,084
8,200
ACC
1,116
1,126
1,143
1,153
1,169
AMBUJACEM
152
153
156
158
161
AXISBANK
789
798
813
823
837
BAJAJ-AUTO
1,561
1,576
1,596
1,611
1,632
BHARTIARTL
335
339
343
347
351
BHEL
234
237
239
241
243
BPCL
461
469
477
485
493
CAIRN
301
308
311
318
322
CIPLA
314
317
321
324
329
DLF
177
180
185
188
193
DRREDDY
1,553
1,566
1,577
1,590
1,601
GAIL
372
378
382
387
391
HCLTECH
382
385
388
391
395
HDFC
635
644
656
665
677
HDFCBANK
416
421
428
433
440
HEROMOTOCO
1,873
1,889
1,911
1,927
1,948
HINDALCO
112
114
117
118
121
HINDUNILVR
400
404
409
413
419
ICICIBANK
669
677
688
696
708
IDFC
88
90
93
95
98
INFY
2,728
2,748
2,761
2,781
2,795
ITC
199
200
202
203
204
JINDALSTEL
436
445
455
464
475
JPASSOCIAT
51
52
53
54
55
KOTAKBANK
414
422
435
443
456
LT
978
986
999
1,008
1,021
M&M
665
673
684
692
703
MARUTI
894
906
923
935
952
NTPC
158
159
161
162
164
ONGC
250
253
258
261
266
PNB
768
774
782
789
796
POWERGRID
99
99
100
101
102
RANBAXY
393
399
406
412
419
RCOM
67
69
70
71
72
RELCAPITAL
227
231
237
241
247
RELIANCE
669
681
701
713
732
RELINFRA
330
335
344
349
357
RPOWER
69
70
71
72
74
SAIL
79
80
81
82
83
SBIN
1,580
1,600
1,625
1,644
1,669
SESAGOA
156
160
163
167
170
SIEMENS
631
637
644
650
657
STER
85
87
90
92
94
SUNPHARMA
488
493
497
501
505
SUZLON
17
18
18
18
18
TATAMOTORS
173
176
180
183
187
TATAPOWER
85
86
88
89
91
TATASTEEL
326
331
339
344
352
TCS
1,141
1,151
1,167
1,177
1,193
WIPRO
392
395
399
402
406
Technical Research Team
For Private Circulation Only |
4
Technical Report
RESEARCH TEAM
Shardul Kulkarni
Head - Technicals
Sameet Chavan
Technical Analyst
Sacchitanand Uttekar
Technical Analyst
Mehul Kothari
Technical Analyst
Ankur Lakhotia
Technical Analyst
Research Team: 022-3952 6600
DISCLAIMER: This document is not for public distribution and has been furnished to you solely for your information and must not
be reproduced or redistributed to any other person. Persons into whose possession this document may come are required to observe
these restrictions.
Opinion expressed is our current opinion as of the date appearing on this material only. While we endeavor to update on a
reasonable basis the information discussed in this material, there may be regulatory, compliance, or other reasons that prevent us
from doing so. Prospective investors and others are cautioned that any forward-looking statements are not predictions and may be
subject to change without notice. Our proprietary trading and investment businesses may make investment decisions that are
inconsistent with the recommendations expressed herein.
The information in this document has been printed on the basis of publicly available information, internal data and other reliable
sources believed to be true and are for general guidance only. While every effort is made to ensure the accuracy and completeness of
information contained, the company takes no guarantee and assumes no liability for any errors or omissions of the information. No
one can use the information as the basis for any claim, demand or cause of action.
Recipients of this material should rely on their own investigations and take their own professional advice. Each recipient of this
document should make such investigations as it deems necessary to arrive at an independent evaluation of an investment in the
securities of companies referred to in this document (including the merits and risks involved), and should consult their own advisors to
determine the merits and risks of such an investment. Price and value of the investments referred to in this material may go up or
down. Past performance is not a guide for future performance. Certain transactions - futures, options and other derivatives as well as
non-investment grade securities - involve substantial risks and are not suitable for all investors. Reports based on technical analysis
centers on studying charts of a stock's price movement and trading volume, as opposed to focusing on a company's fundamentals
and as such, may not match with a report on a company's fundamentals.
We do not undertake to advise you as to any change of our views expressed in this document. While we would endeavor to update
the information herein on a reasonable basis, Angel Broking, its subsidiaries and associated companies, their directors and
employees are under no obligation to update or keep the information current. Also there may be regulatory, compliance, or other
reasons that may prevent Angel Broking and affiliates from doing so. Prospective investors and others are cautioned that any
forward-looking statements are not predictions and may be subject to change without notice.
Angel Broking Limited and affiliates, including the analyst who has issued this report, may, on the date of this report, and from time
to time, have long or short positions in, and buy or sell the securities of the companies mentioned herein or engage in any other
transaction involving such securities and earn brokerage or compensation or act as advisor or have other potential conflict of interest
with respect to company/ies mentioned herein or inconsistent with any recommendation and related information and opinions.
Angel Broking Limited and affiliates may seek to provide or have engaged in providing corporate finance, investment banking or
other advisory services in a merger or specific transaction to the companies referred to in this report, as on the date of this report or
in the past.
Sebi Registration No : INB 010996539
For Private Circulation Only |