Technical Research | November 2, 2011
Daily Technical Report
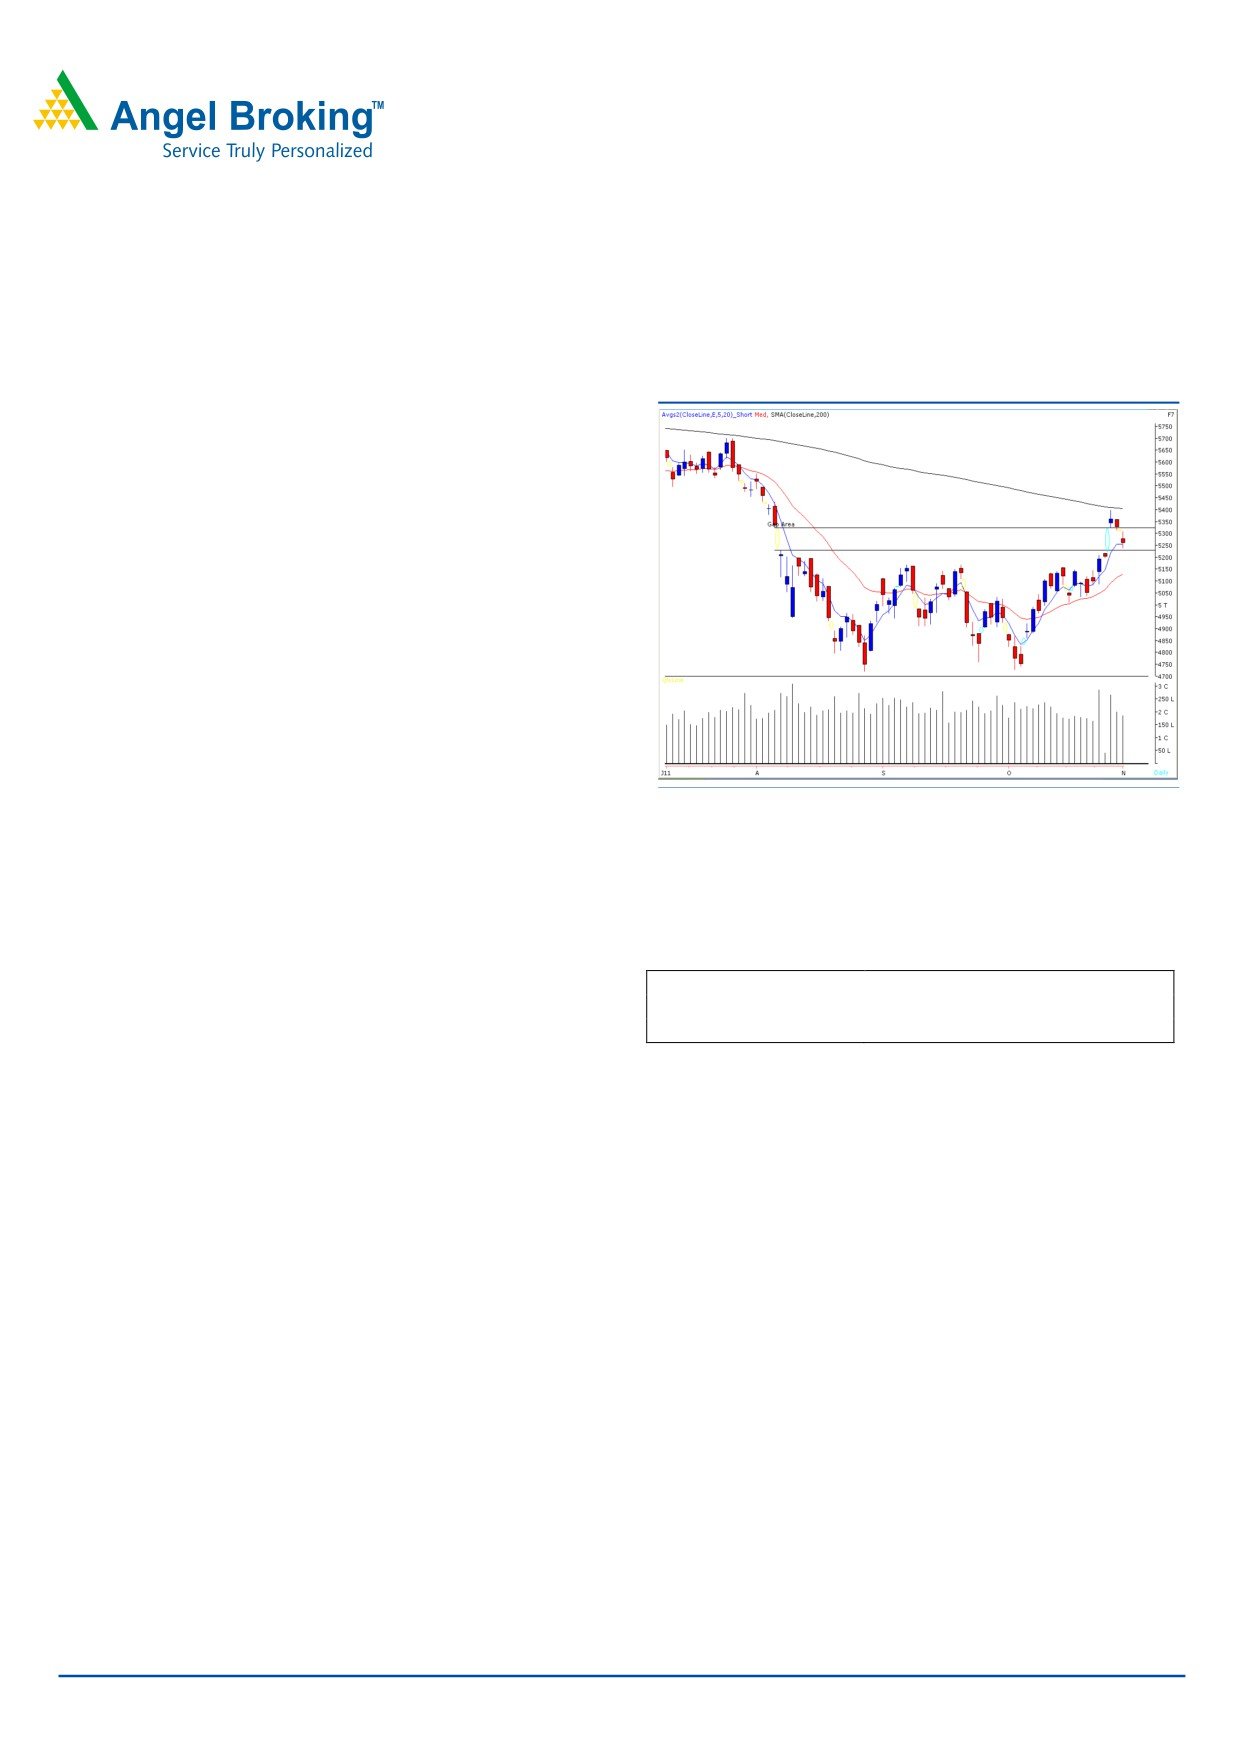
Sensex (17481) / NIFTY (5258)
Yesterday, indices opened lower in-line with weak global
Exhibit 1: Nifty Daily Chart
cues and continued to remain under pressure as the day
progressed. Due to continuous selling pressure indices then
drifted towards the support level of 17350 / 5219. On the
sector front, Realty, Auto and Banking counters were among
the major loosers. There was no sector in the positive
territory. The advance decline ratio was strongly in favor of
declining counters (A=1177 D=1609).
(Source
-
Formation
• The Daily “200 SMA” is placed at the 18020 / 5410
level.
• We are witnessing a downside gap area of 17671 to
Source: Falcon
17350 / 5322 to 5219 created on October 28, 2011.
Trading strategy:
Actionable points:
We witnessed a pessimistic opening in yesterday’s session
View
Neutral
mainly due to negativity across global indices. As expected,
Resistance Levels
5275 - 5322
we witnessed a corrective movement after the violation of
Support Levels
5219 - 5160
Monday’s low of
17668
/
5314 level. Subsequently,
markets drifted lower to fill the gap area of 17671 to
17350 / 5322 to 5219 created on October 28, 2011.
Going forward, 17350 / 5219 remains to be a decent
support for the market. A move below this support level
may intensify further selling pressure which may drag
indices lower to test 17273 - 17188 / 5196 - 5160 levels.
On the upside, 17540 - 17671 / 5275 - 5322 levels may
act as resistance in coming trading session.
For Private Circulation Only |
1
Technical Research | November 2, 2011
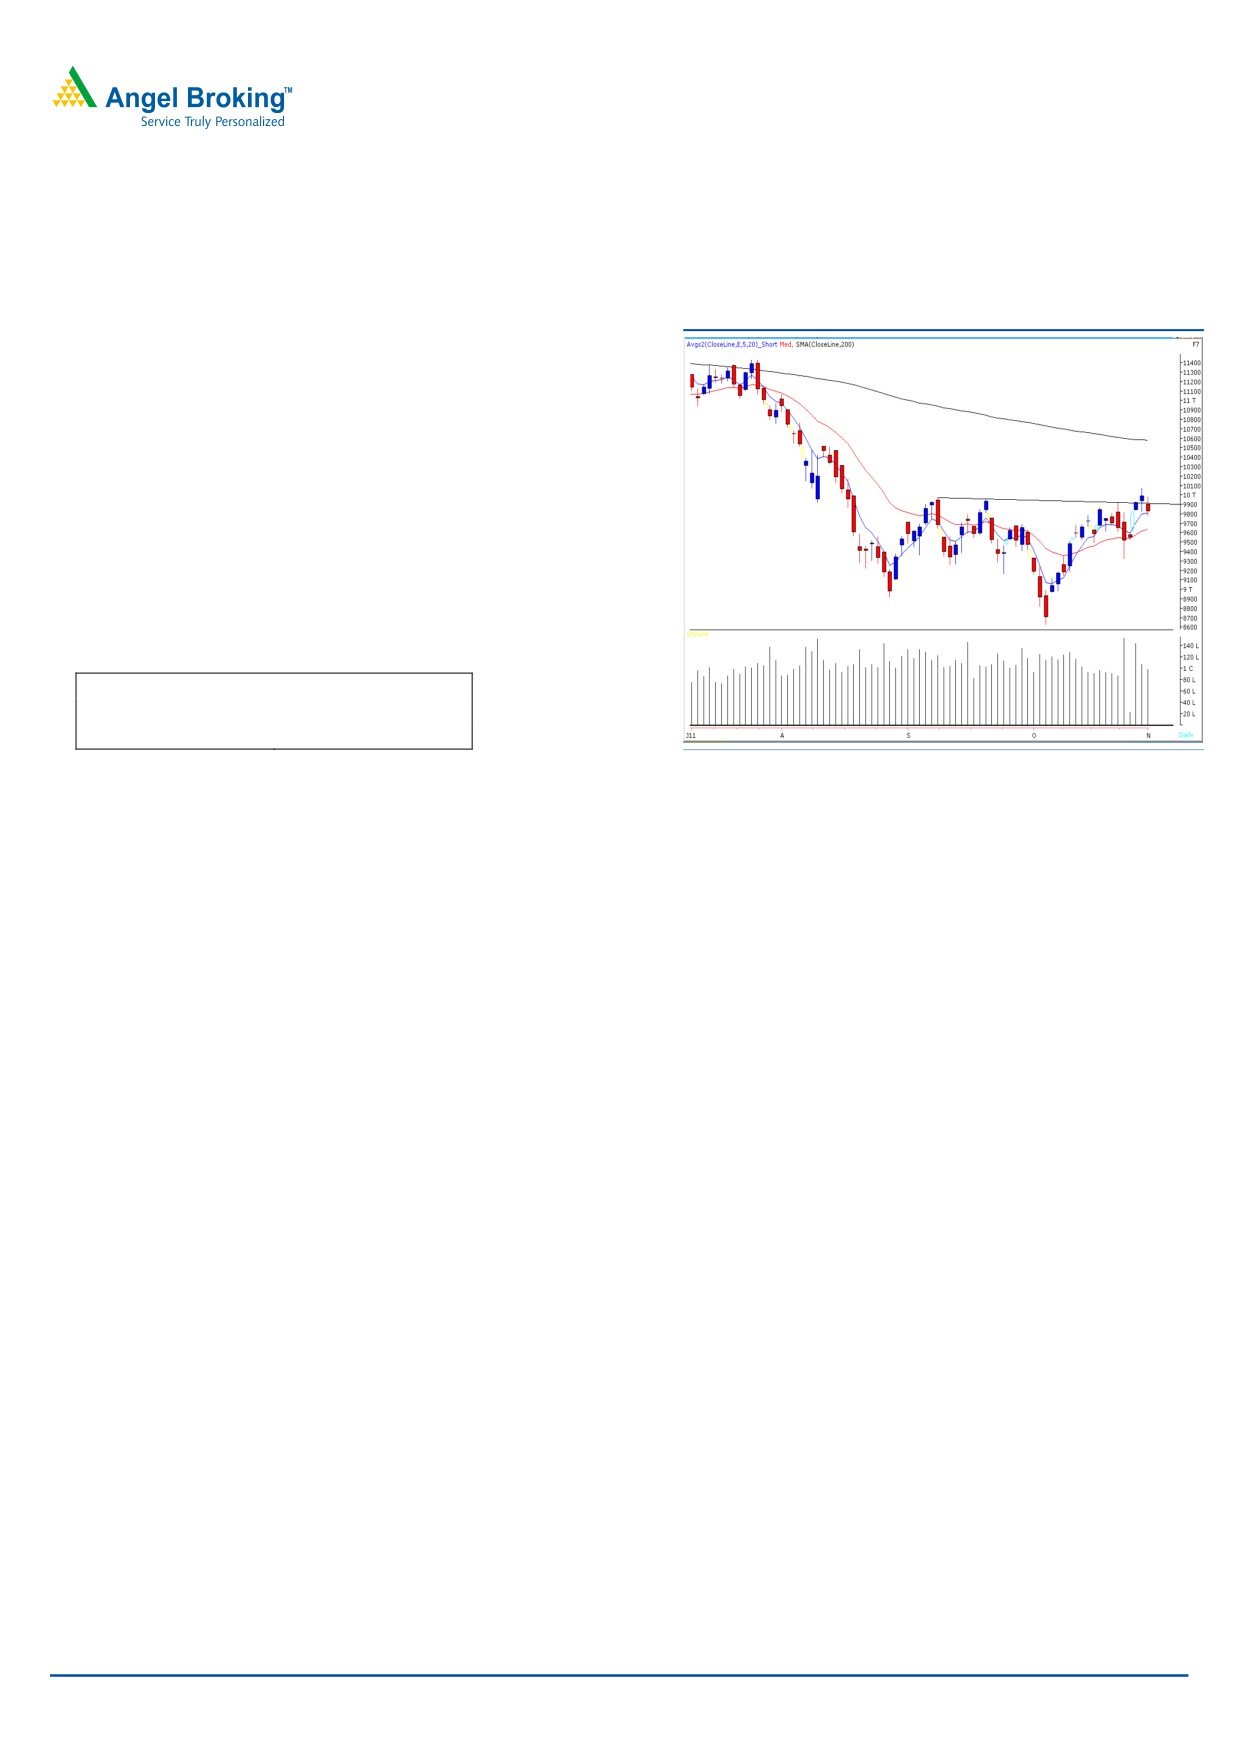
Bank Nifty Outlook - (9822)
Exhibit 2: Bank Nifty Daily Chart
Bank nifty opened lower in-line with our benchmark indices
and traded in a narrow range during the initial hours of the
trade. However, during the latter part of the session, the
index slipped marginally below mentioned support level of
9826. Going forward, if Bank Nifty sustains below
yesterday’s low of 9783 then it is likely to test 9607 - 9500
levels which is a multiple support zone.
On the upside, 10080 level may act as a resistance for the
day.
Actionable points:
View
Neutral
Resistance Level
10080
Support Level
9607 - 9500
Source: Falcon
For Private Circulation Only |
2
Technical Report
RESEARCH TEAM
Shardul Kulkarni
Head - Technicals
Sameet Chavan
Technical Analyst
Sacchitanand Uttekar
Technical Analyst
Mehul Kothari
Technical Analyst
Ankur Lakhotia
Technical Analyst
Research Team: 022-3952 6600
DISCLAIMER: This document is not for public distribution and has been furnished to you solely for your information and must not
be reproduced or redistributed to any other person. Persons into whose possession this document may come are required to observe
these restrictions.
Opinion expressed is our current opinion as of the date appearing on this material only. While we endeavor to update on a
reasonable basis the information discussed in this material, there may be regulatory, compliance, or other reasons that prevent us
from doing so. Prospective investors and others are cautioned that any forward-looking statements are not predictions and may be
subject to change without notice. Our proprietary trading and investment businesses may make investment decisions that are
inconsistent with the recommendations expressed herein.
The information in this document has been printed on the basis of publicly available information, internal data and other reliable
sources believed to be true and are for general guidance only. While every effort is made to ensure the accuracy and completeness of
information contained, the company takes no guarantee and assumes no liability for any errors or omissions of the information. No
one can use the information as the basis for any claim, demand or cause of action.
Recipients of this material should rely on their own investigations and take their own professional advice. Each recipient of this
document should make such investigations as it deems necessary to arrive at an independent evaluation of an investment in the
securities of companies referred to in this document (including the merits and risks involved), and should consult their own advisors to
determine the merits and risks of such an investment. Price and value of the investments referred to in this material may go up or
down. Past performance is not a guide for future performance. Certain transactions - futures, options and other derivatives as well as
non-investment grade securities - involve substantial risks and are not suitable for all investors. Reports based on technical analysis
centers on studying charts of a stock's price movement and trading volume, as opposed to focusing on a company's fundamentals
and as such, may not match with a report on a company's fundamentals.
We do not undertake to advise you as to any change of our views expressed in this document. While we would endeavor to update
the information herein on a reasonable basis, Angel Broking, its subsidiaries and associated companies, their directors and
employees are under no obligation to update or keep the information current. Also there may be regulatory, compliance, or other
reasons that may prevent Angel Broking and affiliates from doing so. Prospective investors and others are cautioned that any
forward-looking statements are not predictions and may be subject to change without notice.
Angel Broking Limited and affiliates, including the analyst who has issued this report, may, on the date of this report, and from time
to time, have long or short positions in, and buy or sell the securities of the companies mentioned herein or engage in any other
transaction involving such securities and earn brokerage or compensation or act as advisor or have other potential conflict of interest
with respect to company/ies mentioned herein or inconsistent with any recommendation and related information and opinions.
Angel Broking Limited and affiliates may seek to provide or have engaged in providing corporate finance, investment banking or
other advisory services in a merger or specific transaction to the companies referred to in this report, as on the date of this report or
in the past.
Sebi Registration No : INB 010996539
For Private Circulation Only |