Technical Research | December 01, 2011
Daily Technical Report
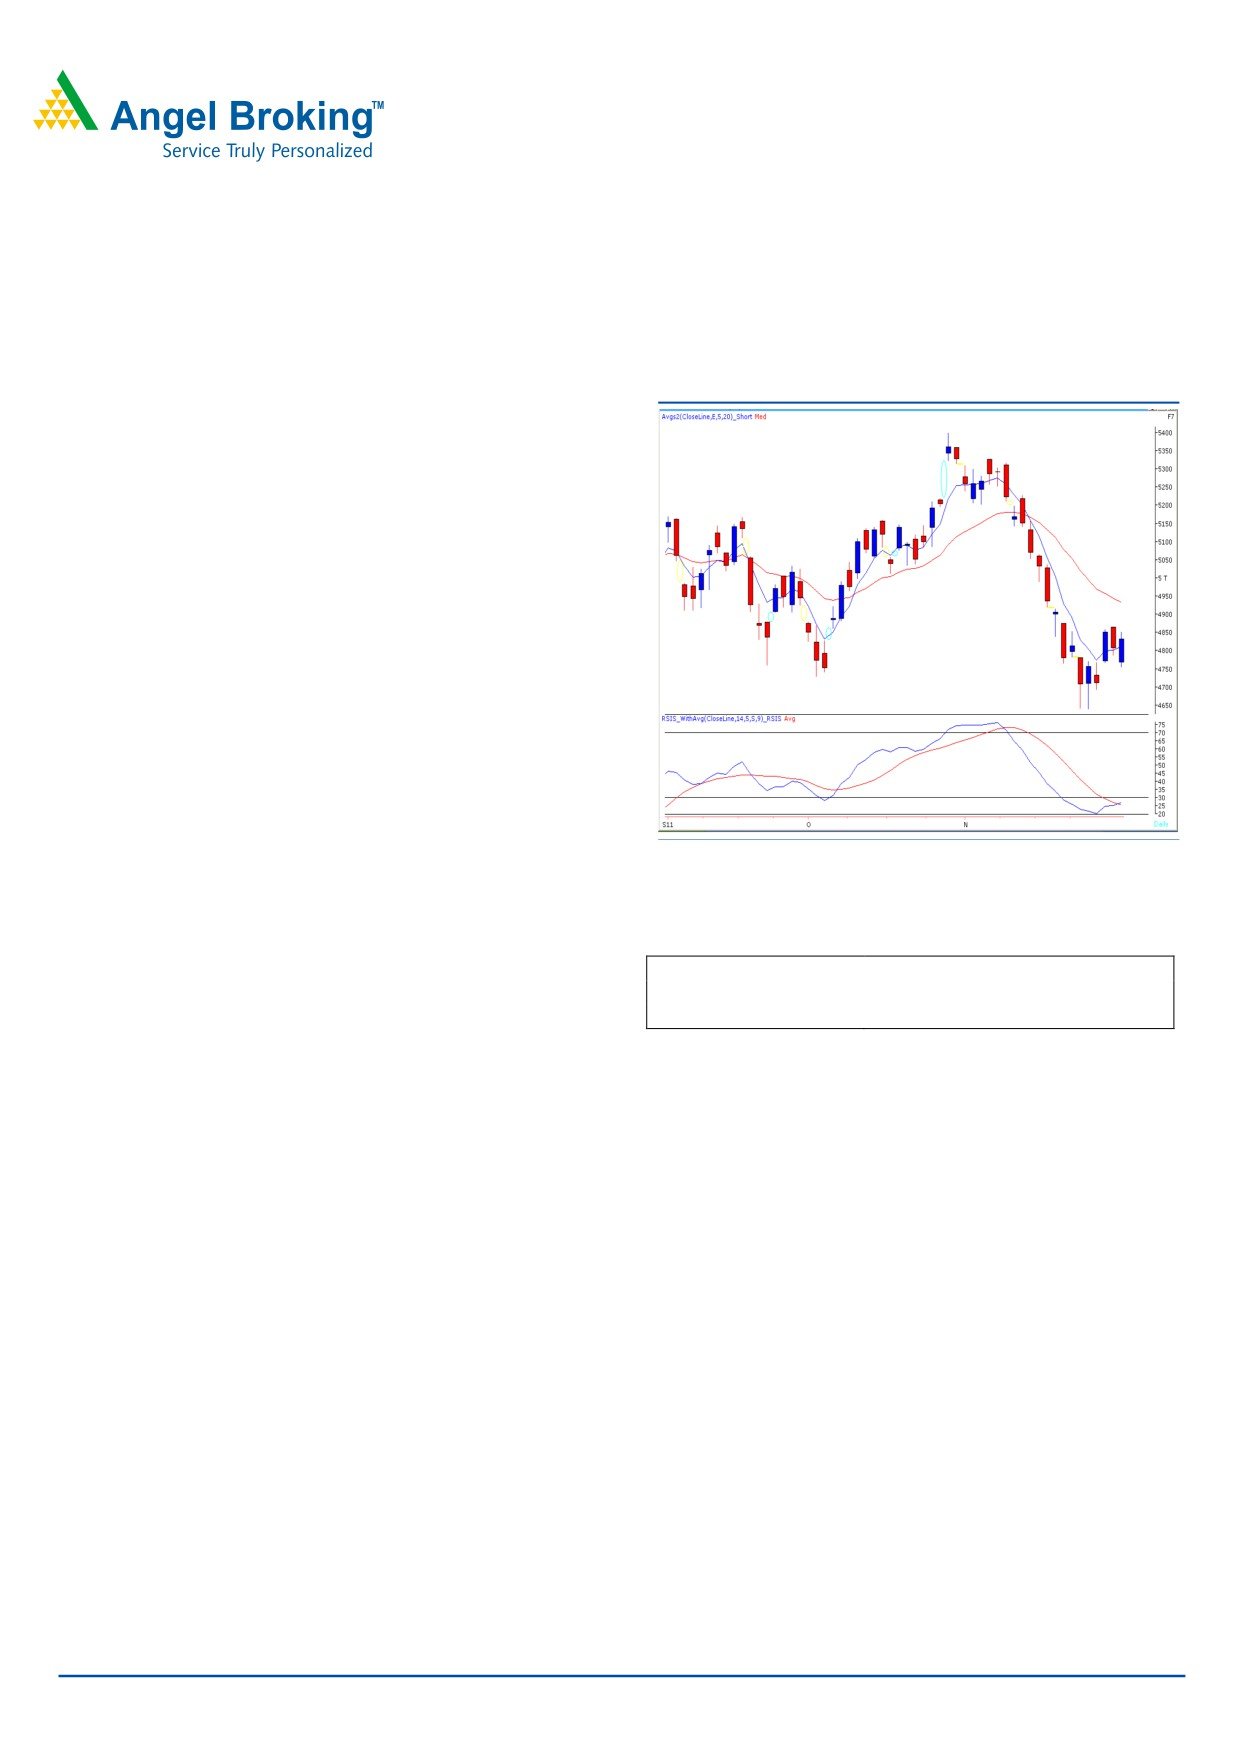
Sensex (16123) / NIFTY (4832)
Exhibit 1: Nifty Daily Chart
Yesterday, we witnessed a highly volatile trading session
where our Benchmark indices tested the mentioned
resistance as well as support levels of the day. The indices
opened lower but ended on a positive note. On the sectoral
front, Oil & Gas and FMCG counters were among the
major gainers whereas Consumer Durables ended with
marginal loss. The advance decline ratio was in favour of
declining counters (A=1204 D=1521).
(Source
-
Formation
• On the Daily chart, the momentum oscillator viz. the
“RSI Smoothened” has given a positive crossover.
Source: Falcon
Actionable points:
Trading strategy:
View
Neutral
Our markets opened lower and traded with extreme
Resistance levels
4866 - 4932
volatility throughout the day. On the downside, indices
Support levels
4755 - 4693
tested the mentioned support level of 15888 / 4766.
However, buying emerged near this level which led the
indices to test resistance level of 16135 / 4844. On the
Daily chart, we are witnessing a positive crossover in
momentum oscillator viz. the “RSI Smoothened”, which
indicates further strength. Going forward, if indices trades
convincingly above the resistance level of 16210 / 4866,
then they are likely to test the “20 Day EMA” placed at
16430 / 4932 level. On the downside, 15850 - 15645 /
4755 - 4693 levels may act as support for coming trading
sessions.
We are of the opinion that the collective policy changes by
central banks across the world have not been factored in by
our markets. Positional traders with short positions are
advised to exit on any closing above 16430 / 4932 level.
For Private Circulation Only |
1
Technical Research | December 01, 2011
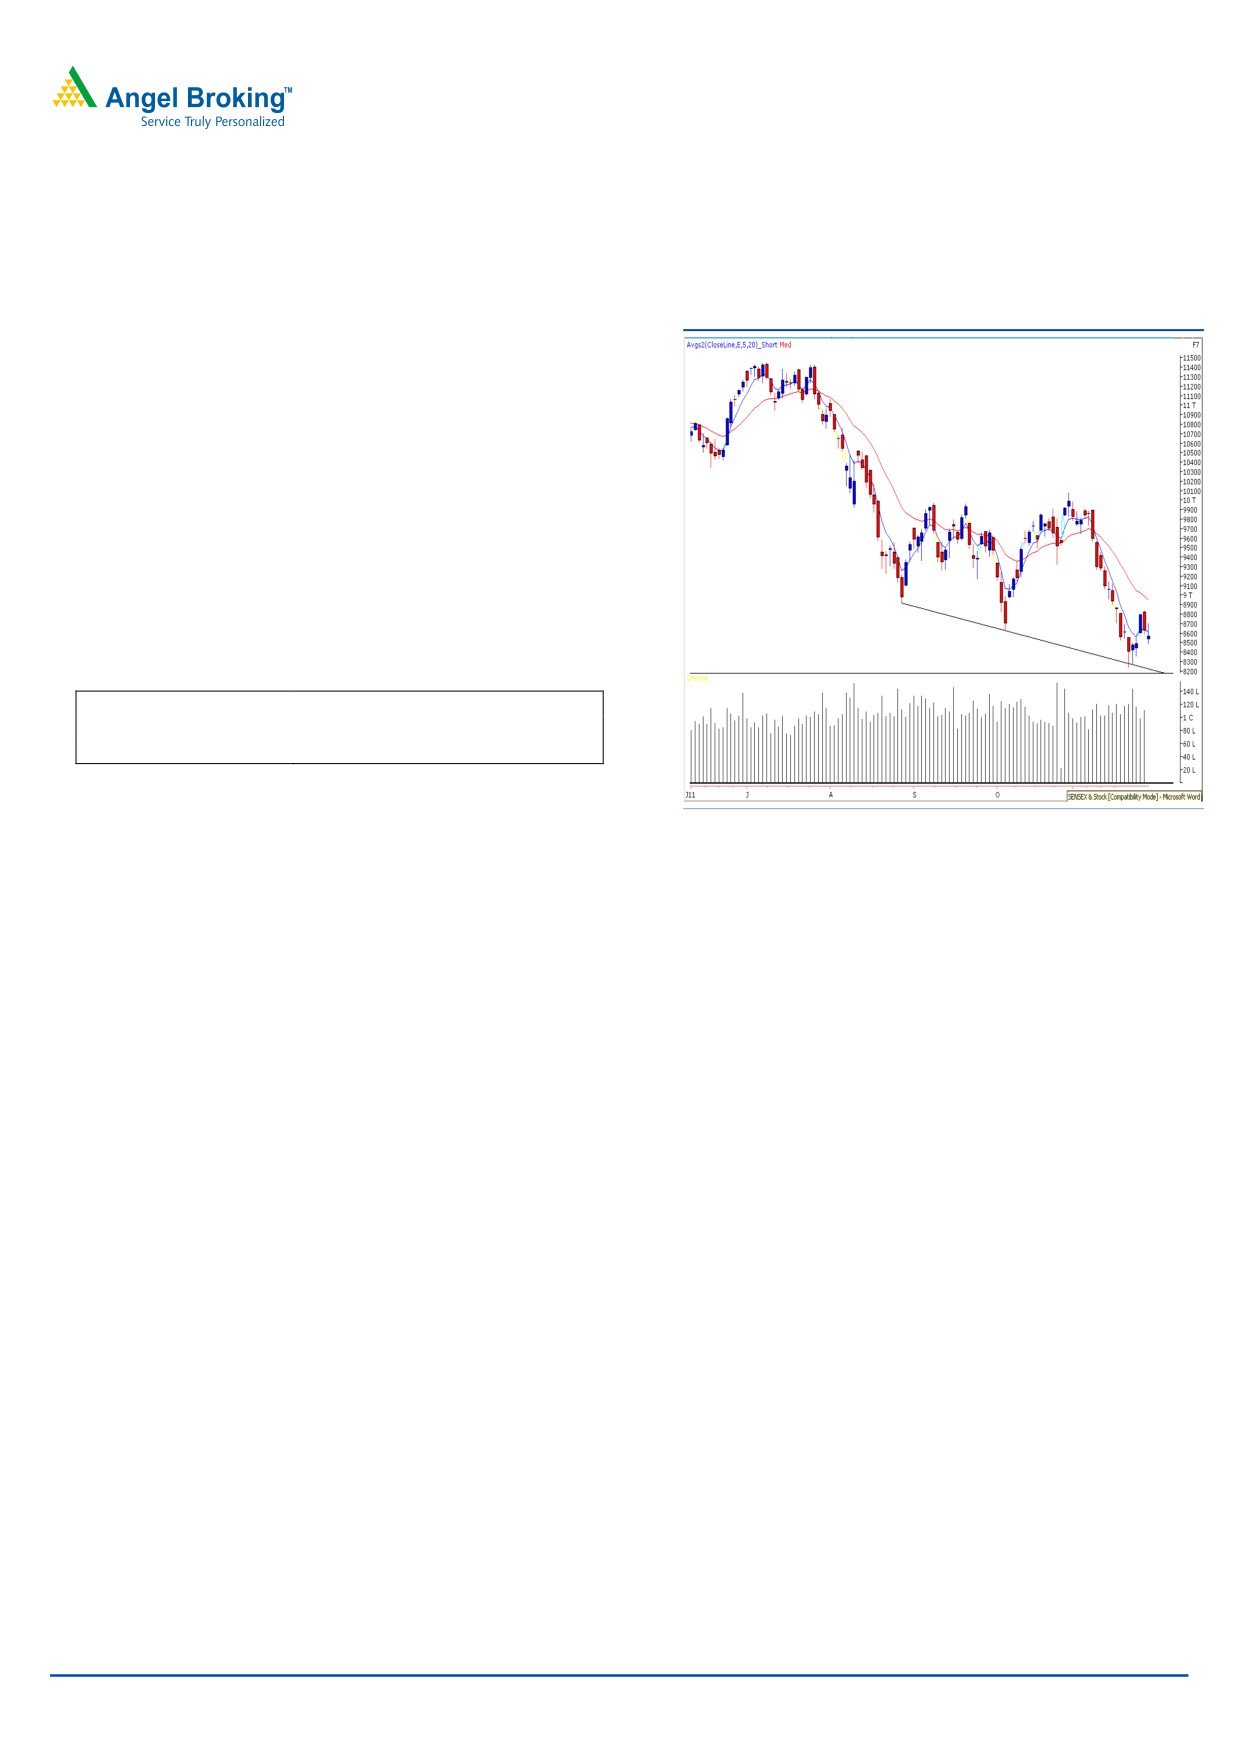
Bank Nifty Outlook - (8564)
Exhibit 2: Bank Nifty Daily Chart
Bank nifty opened with a minor downside gap and traded
with extreme volatility throughout the session. We are
observing a “Spinning top” candle pattern formation,
which indicates indecision in the mind of bulls and bears
prevailing at current levels. Therefore, if Bank Nifty
Sustains above yesterday’s high of 8704 then it is likely to
test 8844 - 8880 levels. On the downside, 8490 - 8360
levels may act as support levels for the day.
Actionable points:
View
Neutral
Resistance levels
8704 - 8880 - 8944
Support levels
8490 - 8360
Source: Falcon
For Private Circulation Only |
2
Technical Research | December 01, 2011
Positive Bias:
Stock Name
5 Day EMA
20 Day EMA
Expected Target
Remarks
Wipro
373.8
371.2
389
View will change below 369
Lupin
468.1
464.95
486
View will change below 466.30
Negative Bias:
Stock Name
5 Day EMA
20 Day EMA
Expected Target
Remarks
Dish TV
64.4
67.1
58.6
View will change above 68.2
Patel Engg
86.5
88.4
80
View will change above 92
For Private Circulation Only |
3
Technical Research | December 01, 2011
Daily Pivot Levels for Nifty 50 Stocks
SCRIPS
S2
S1
PIVOT
R1
R2
SENSEX
15,721
15,922
16,051
16,252
16,381
NIFTY
4,716
4,774
4,813
4,871
4,910
BANKNIFTY
8,372
8,468
8,586
8,682
8,800
ACC
1,126
1,135
1,144
1,153
1,162
AMBUJACEM
142
145
148
151
154
AXISBANK
914
931
953
970
992
BAJAJ-AUTO
1,606
1,637
1,663
1,695
1,721
BHARTIARTL
359
373
381
394
403
BHEL
270
276
280
287
290
BPCL
507
522
533
548
558
CAIRN
296
299
301
304
307
CIPLA
322
325
327
330
333
DLF
194
201
206
212
217
DRREDDY
1,550
1,564
1,577
1,591
1,604
GAIL
379
386
390
397
401
HCLTECH
373
378
386
391
399
HDFC
616
629
638
651
661
HDFCBANK
420
431
440
452
461
HEROMOTOCO
1,903
1,951
2,019
2,068
2,136
HINDALCO
119
121
122
124
126
HINDUNILVR
381
389
395
403
409
ICICIBANK
688
700
717
730
747
IDFC
106
107
109
110
112
INFY
2,534
2,570
2,598
2,634
2,662
ITC
194
198
200
203
205
JINDALSTEL
462
483
497
518
532
JPASSOCIAT
60
61
62
63
64
KOTAKBANK
441
454
462
475
483
LT
1,239
1,256
1,267
1,283
1,294
M&M
692
709
720
737
749
MARUTI
943
957
967
982
991
NTPC
154
158
161
165
168
ONGC
249
258
264
273
279
PNB
865
874
882
890
898
POWERGRID
94
96
98
101
103
RANBAXY
417
426
439
447
460
RCOM
70
72
73
75
77
RELCAPITAL
271
276
283
288
295
RELIANCE
741
760
772
790
802
RELINFRA
392
398
407
413
422
RPOWER
82
84
86
87
89
SAIL
78
79
81
82
85
SBIN
1,695
1,729
1,762
1,796
1,829
SESAGOA
174
179
182
187
190
SIEMENS
658
674
687
703
717
STER
96
97
100
102
104
SUNPHARMA
500
513
521
534
542
SUZLON
22
23
23
24
24
TATAMOTORS
166
169
173
176
180
TATAPOWER
89
90
91
93
94
TATASTEEL
378
382
385
389
392
TCS
1,065
1,090
1,107
1,132
1,148
WIPRO
367
372
377
382
387
Technical Research Team
For Private Circulation Only |
4
Technical Report
RESEARCH TEAM
Shardul Kulkarni
Head - Technicals
Sameet Chavan
Technical Analyst
Sacchitanand Uttekar
Technical Analyst
Mehul Kothari
Technical Analyst
Ankur Lakhotia
Technical Analyst
Research Team: 022-3952 6600
DISCLAIMER: This document is not for public distribution and has been furnished to you solely for your information and must not
be reproduced or redistributed to any other person. Persons into whose possession this document may come are required to observe
these restrictions.
Opinion expressed is our current opinion as of the date appearing on this material only. While we endeavor to update on a
reasonable basis the information discussed in this material, there may be regulatory, compliance, or other reasons that prevent us
from doing so. Prospective investors and others are cautioned that any forward-looking statements are not predictions and may be
subject to change without notice. Our proprietary trading and investment businesses may make investment decisions that are
inconsistent with the recommendations expressed herein.
The information in this document has been printed on the basis of publicly available information, internal data and other reliable
sources believed to be true and are for general guidance only. While every effort is made to ensure the accuracy and completeness of
information contained, the company takes no guarantee and assumes no liability for any errors or omissions of the information. No
one can use the information as the basis for any claim, demand or cause of action.
Recipients of this material should rely on their own investigations and take their own professional advice. Each recipient of this
document should make such investigations as it deems necessary to arrive at an independent evaluation of an investment in the
securities of companies referred to in this document (including the merits and risks involved), and should consult their own advisors to
determine the merits and risks of such an investment. Price and value of the investments referred to in this material may go up or
down. Past performance is not a guide for future performance. Certain transactions - futures, options and other derivatives as well as
non-investment grade securities - involve substantial risks and are not suitable for all investors. Reports based on technical analysis
centers on studying charts of a stock's price movement and trading volume, as opposed to focusing on a company's fundamentals
and as such, may not match with a report on a company's fundamentals.
We do not undertake to advise you as to any change of our views expressed in this document. While we would endeavor to update
the information herein on a reasonable basis, Angel Broking, its subsidiaries and associated companies, their directors and
employees are under no obligation to update or keep the information current. Also there may be regulatory, compliance, or other
reasons that may prevent Angel Broking and affiliates from doing so. Prospective investors and others are cautioned that any
forward-looking statements are not predictions and may be subject to change without notice.
Angel Broking Limited and affiliates, including the analyst who has issued this report, may, on the date of this report, and from time
to time, have long or short positions in, and buy or sell the securities of the companies mentioned herein or engage in any other
transaction involving such securities and earn brokerage or compensation or act as advisor or have other potential conflict of interest
with respect to company/ies mentioned herein or inconsistent with any recommendation and related information and opinions.
Angel Broking Limited and affiliates may seek to provide or have engaged in providing corporate finance, investment banking or
other advisory services in a merger or specific transaction to the companies referred to in this report, as on the date of this report or
in the past.
Sebi Registration No: INB 010996539
For Private Circulation Only |