Daily Technical Report
August 01, 2012
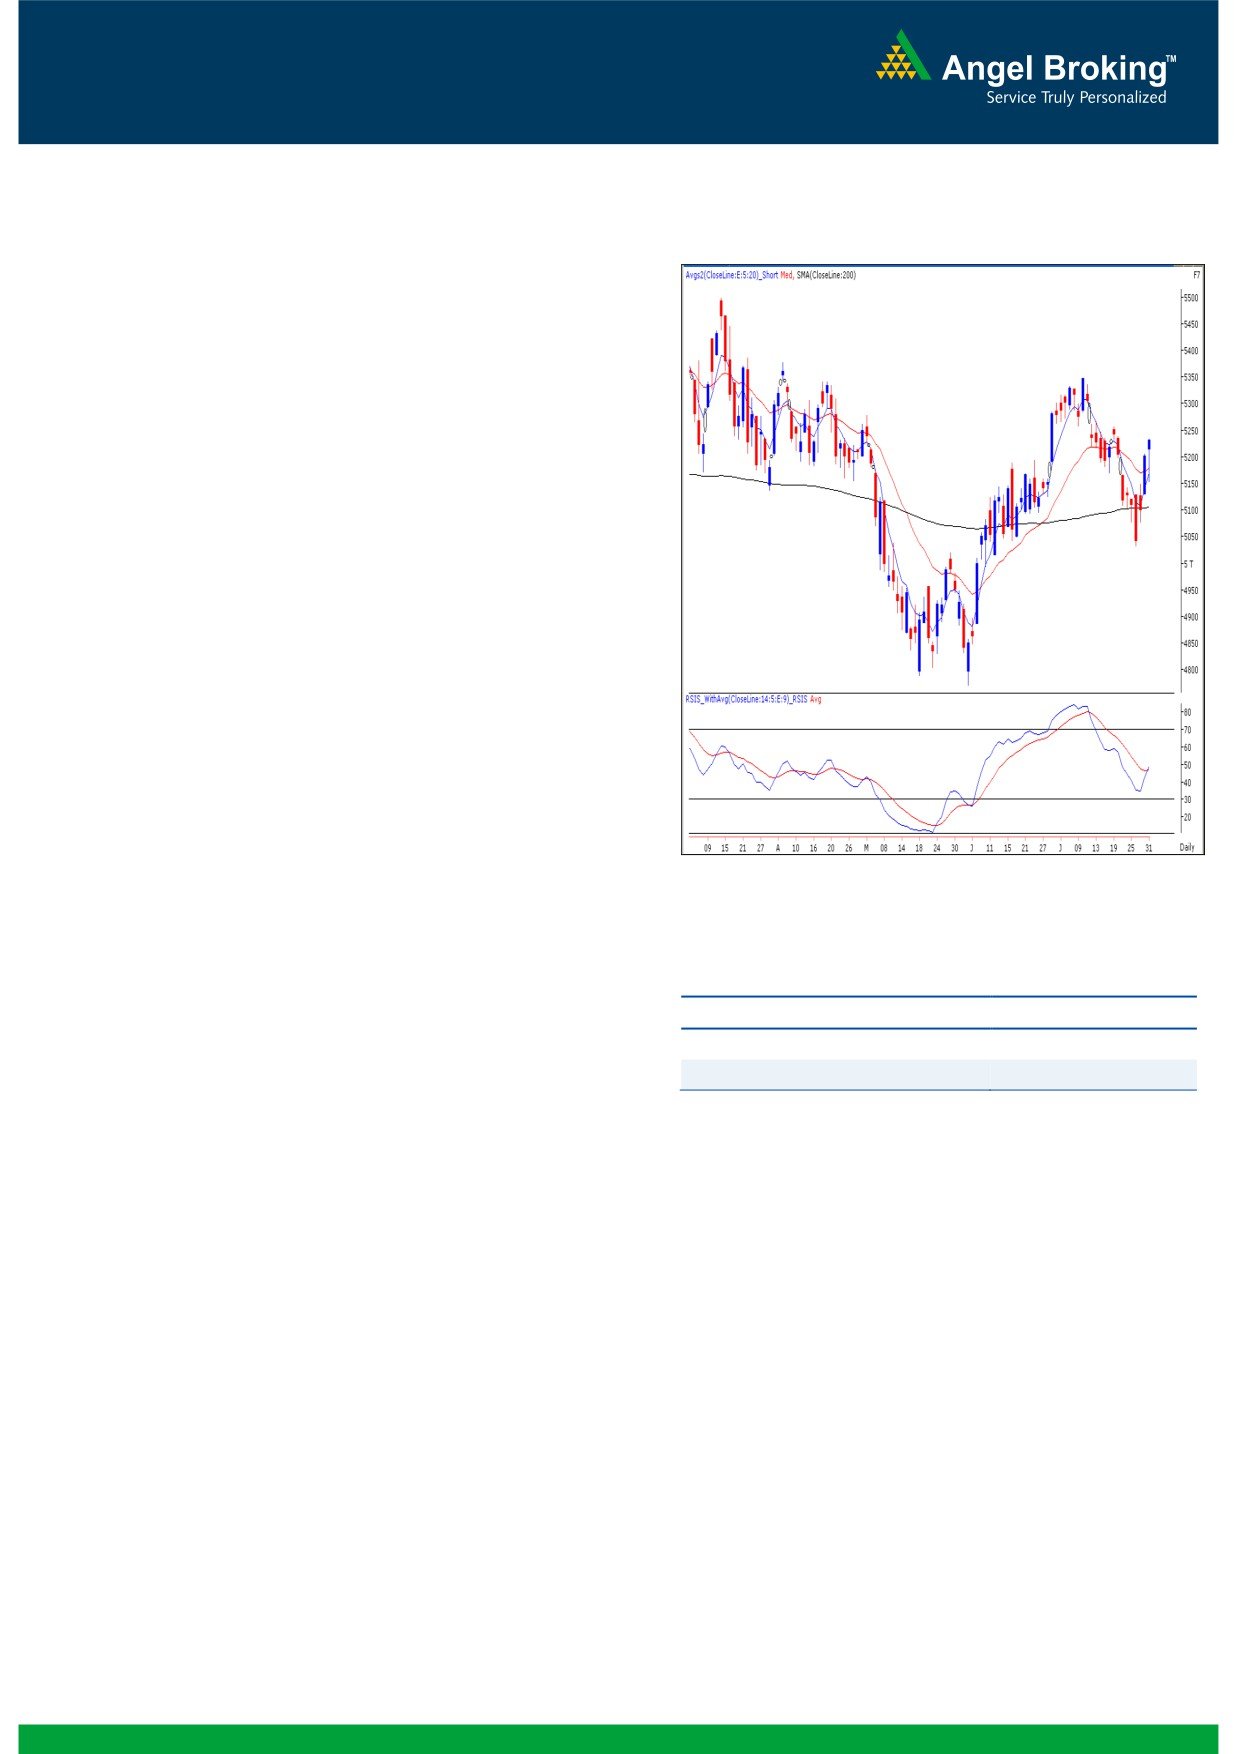
Exhibit 1: Nifty Daily Chart
Sensex (17236) / NIFTY (5229)
Yesterday, indices opened marginally higher in-line
with mixed global cues and strong buying post the
announcement of the RBI monetary policy led the
markets to close well above 5200 mark. The buying
was seen mainly in Oil & Gas, Realty and IT sectors;
whereas Consumer Durables and Banking counters
remained under pressure. The advance to decline
ratio was in favor of advancing counters (A=1437
Formation
On the weekly chart, we are witnessing a
“Downward Sloping Trend Line” resistance near
17500 / 5325 formed by joining the highs of
21109 / 6339 (November 5, 2010) - 18524 /
5630 (February 24, 2012).
The ’20-day EMA’ and
’200-day SMA’ are
placed at 17042 / 5169 and 16879 / 5100
levels, respectively.
Source: Falcon
We are now observing a positive crossover in
daily ‘RSI - Smoothened’.
Actionable points:
Trading strategy:
View
Bullish Above 5235
After opening marginally higher, Indices tested the '20
Expected Targets
5257 - 5300
EMA' on hourly chart. This level acted as a decent
Support Level
5154 - 5129
support for the markets and indices surged
significantly higher to close near the day's highs.
Along with other momentum oscillators, the daily 'RSI
- Smoothened' oscillator is now signaling a positive
crossover. The impact of this tool would be seen only
if indices sustain above yesterday's high of 17254 /
5235. In such a scenario, considering that the daily
chart price action indicates positive momentum, we
expect the market to rally higher to test 17318 -
17466 / 5257 - 5300 levels. On the downside,
17004 / 5154 level may act as an important support
for the markets.
1
Daily Technical Report
August 01, 2012
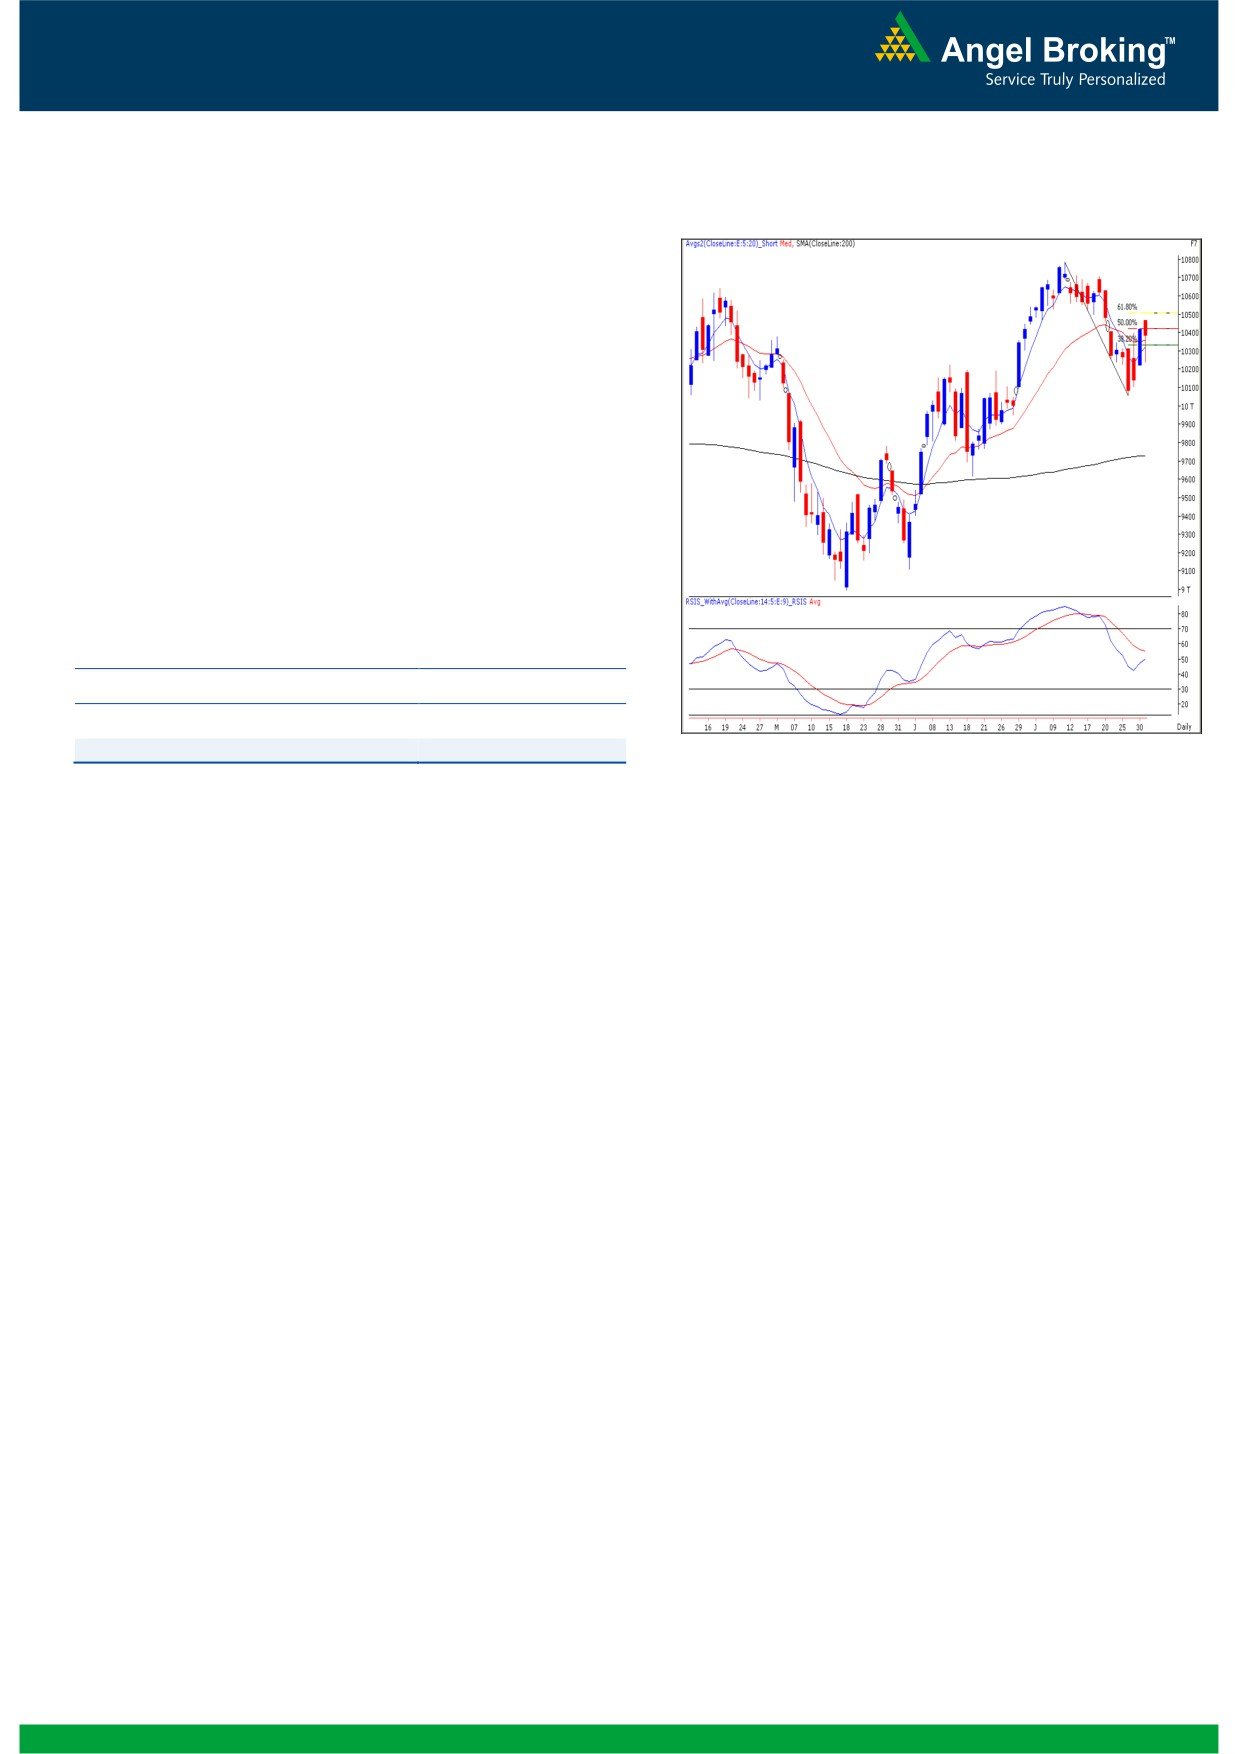
Bank Nifty Outlook - (10384)
Exhibit 2: Bank Nifty Daily Chart
Yesterday, Bank Nifty opened with an upside gap and
traded with extreme volatility throughout the day. The
momentum oscillators on the daily chart continue to
remain positive. However the index is currently facing
resistance near 61.8% Fibonacci retracement level of
the fall from July 11, 2012 - July 26, 2012. Thus,
going forward we believe that the index is likely to
trade in the range of
10500
-
10150. In the
mentioned range 10405 - 10468 levels are likely to
act as resistance and 10290 - 10235 levels are likely
to act as support in coming trading session.
Actionable points:
View
Neutral
Expected targets
10405 - 10468
Support Level
10290 - 10235
Source: Falcon
2
Daily Technical Report
August 01, 2012
Research Team Tel: 022 - 39357800
DISCLAIMER
This document is solely for the personal information of the recipient, and must not be singularly used as the basis of any investment
decision. Nothing in this document should be construed as investment or financial advice. Each recipient of this document should make
such investigations as they deem necessary to arrive at an independent evaluation of an investment in the securities of the companies
referred to in this document (including the merits and risks involved), and should consult their own advisors to determine the merits and
risks of such an investment.
Angel Broking Limited, its affiliates, directors, its proprietary trading and investment businesses may, from time to time, make
investment decisions that are inconsistent with or contradictory to the recommendations expressed herein. The views contained in this
document are those of the analyst, and the company may or may not subscribe to all the views expressed within.
Reports based on technical and derivative analysis center on studying charts of a stock's price movement, outstanding positions and
trading volume, as opposed to focusing on a company's fundamentals and, as such, may not match with a report on a company's
fundamentals.
The information in this document has been printed on the basis of publicly available information, internal data and other reliable
sources believed to be true, but we do not represent that it is accurate or complete and it should not be relied on as such, as this
document is for general guidance only. Angel Broking Limited or any of its affiliates/ group companies shall not be in any way
responsible for any loss or damage that may arise to any person from any inadvertent error in the information contained in this report.
Angel Broking Limited has not independently verified all the information contained within this document. Accordingly, we cannot testify,
nor make any representation or warranty, express or implied, to the accuracy, contents or data contained within this document. While
Angel Broking Limited endeavours to update on a reasonable basis the information discussed in this material, there may be regulatory,
compliance, or other reasons that prevent us from doing so.
This document is being supplied to you solely for your information, and its contents, information or data may not be reproduced,
redistributed or passed on, directly or indirectly.
Angel Broking Limited and its affiliates may seek to provide or have engaged in providing corporate finance, investment banking or
other advisory services in a merger or specific transaction to the companies referred to in this report, as on the date of this report or in
the past.
Neither Angel Broking Limited, nor its directors, employees or affiliates shall be liable for any loss or damage that may arise from or in
connection with the use of this information.
Note: Please refer to the important `Stock Holding Disclosure' report on the Angel website (Research Section). Also, please refer to the
latest update on respective stocks for the disclosure status in respect of those stocks. Angel Broking Limited and its affiliates may have
investment positions in the stocks recommended in this report.
Research Team
Shardul Kulkarni
-
Head - Technicals
Sameet Chavan
-
Technical Analyst
Sacchitanand Uttekar
-
Technical Analyst
Mehul Kothari
-
Technical Analyst
Ankur Lakhotia
-
Technical Analyst
Angel Broking Pvt. Ltd.
Registered Office: G-1, Ackruti Trade Centre, Rd. No. 7, MIDC, Andheri (E), Mumbai - 400 093.
Corporate Office: 6th Floor, Ackruti Star, MIDC, Andheri (E), Mumbai - 400 093. Tel: (022) 3952 6600
Sebi Registration No: INB 010996539
4