Daily Technical Report
June 01, 2012
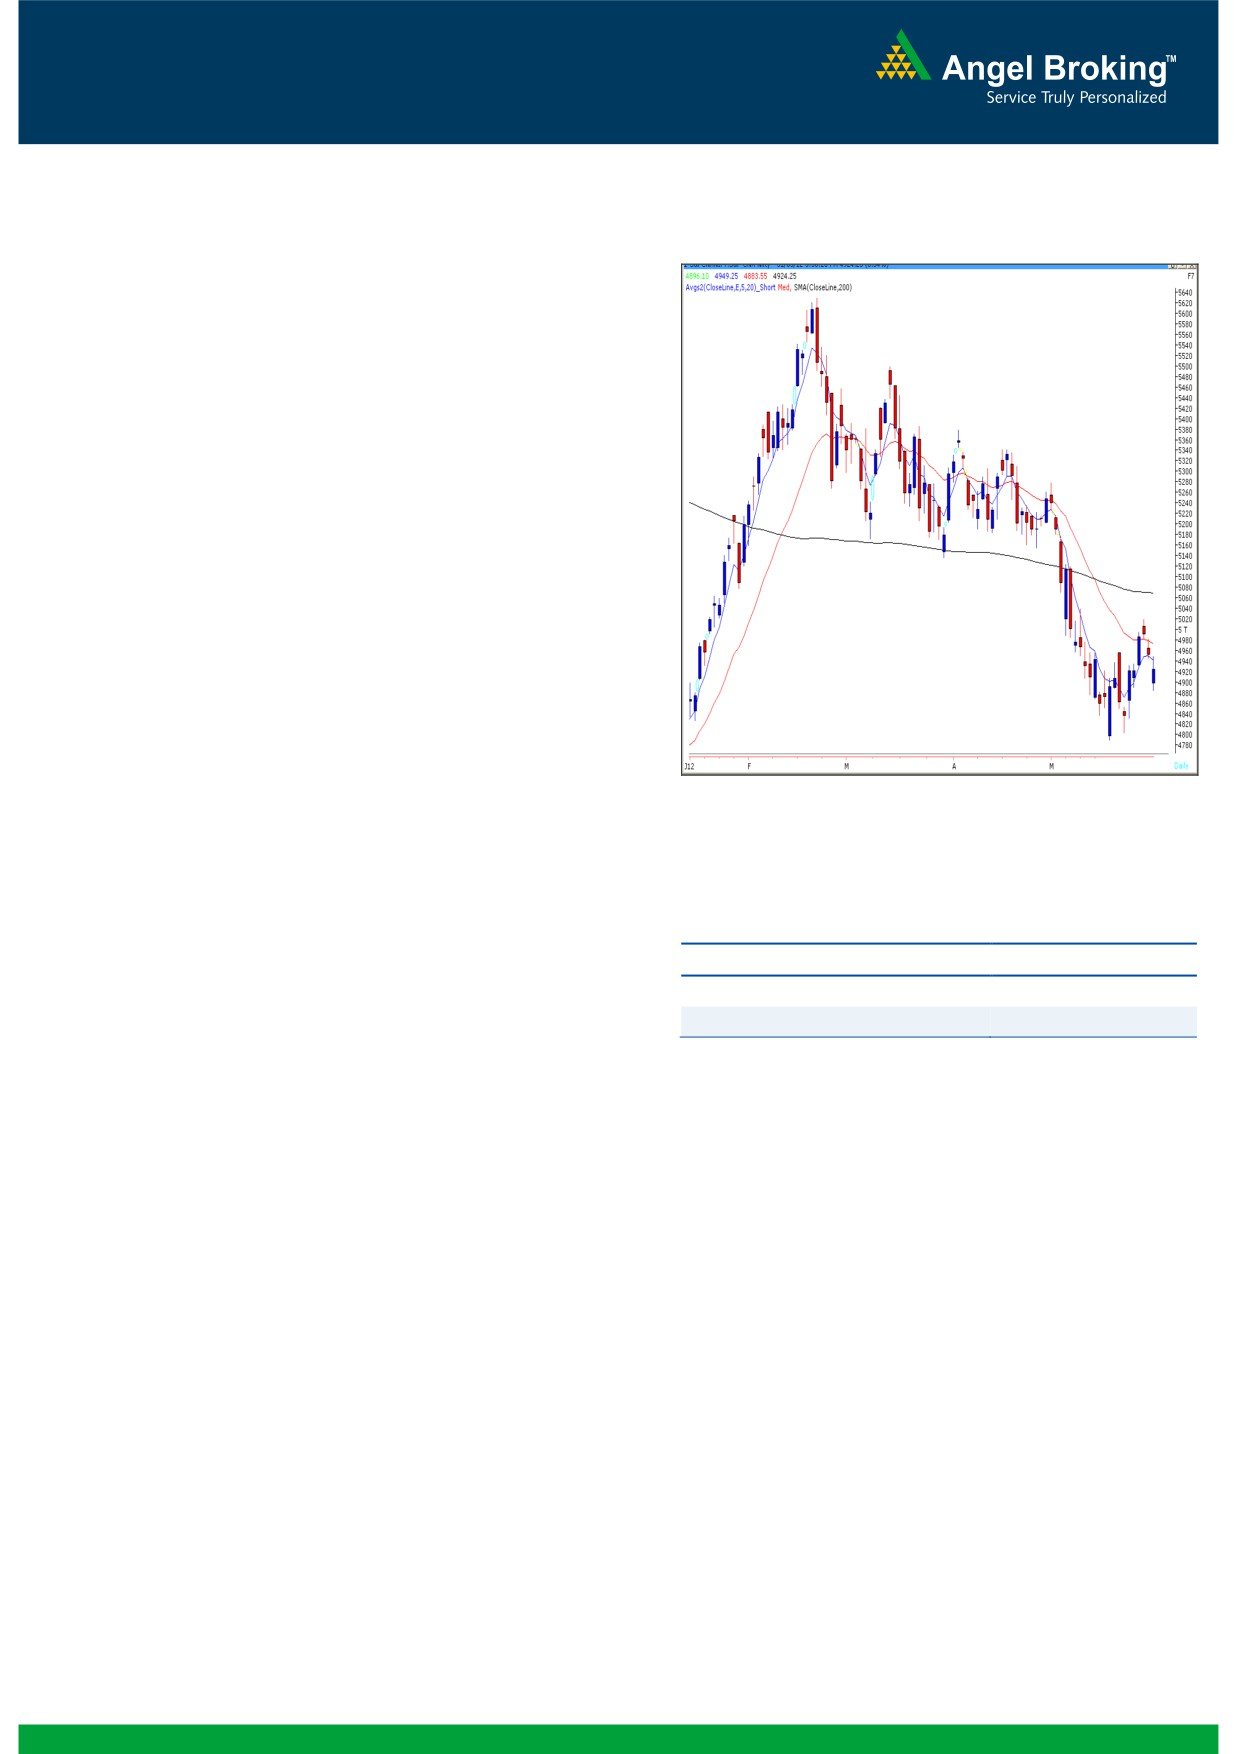
Exhibit 1: Nifty Daily Chart
Sensex (16219) / NIFTY (4924)
Yesterday, despite extremely weak GDP data, our
markets bounced in the latter half of the day to close
above 4900 mark. The session was less volatile than
previous derivative expiry sessions. On sectoral front,
Auto, Banking heavyweights corrected during
yesterday’s session; whereas Realty and IT sectors
ended on the gaining side. The advance to decline
ratio was strongly in of declining counters (A=1184
Formation
The 200-day SMA (Simple Moving Average) and
20-day EMA (Exponential Moving Average) have
now shifted to 16800 / 5070 and 16429 /
4980, respectively.
The ‘20-Week EMA’ is placed at 16930 / 5130
level.
Source: Falcon
Indices have taken a support near 16113 /
4886 level, which is the
61.8
% Fibonacci
Retracement level of the rise from 15847 / 4804
(Low on 23rd May, 2012) to 16544 / 5020 (High
Actionable points:
on 29th May , 2012).
View
Buy Above 4949
The candlestick pattern on the weekly chart
Expected targets
4982 - 5020
represents another bullish “Hammer”.
Support Levels
4883 - 4850
Trading strategy:
Yesterday, once again indices opened lower in-line
with negative global cues. Despite the weakest GDP
growth data since March 2003, the indices bounced
from lower levels to close well above the 4900 mark.
We are observing that the market has taken support
near an important Fibonacci retracement support
level (16113 / 4886) and the possibility of a further
upside cannot be ruled out. Going forward, we expect
a rally towards 16429 - 16544 / 4982 - 5020 levels,
once the Index sustains above yesterday's high of
16278 / 4949 level. Conversely, yesterday's low of
16086 / 4883 may provide decent support for the
markets.
1
Daily Technical Report
June 01, 2012
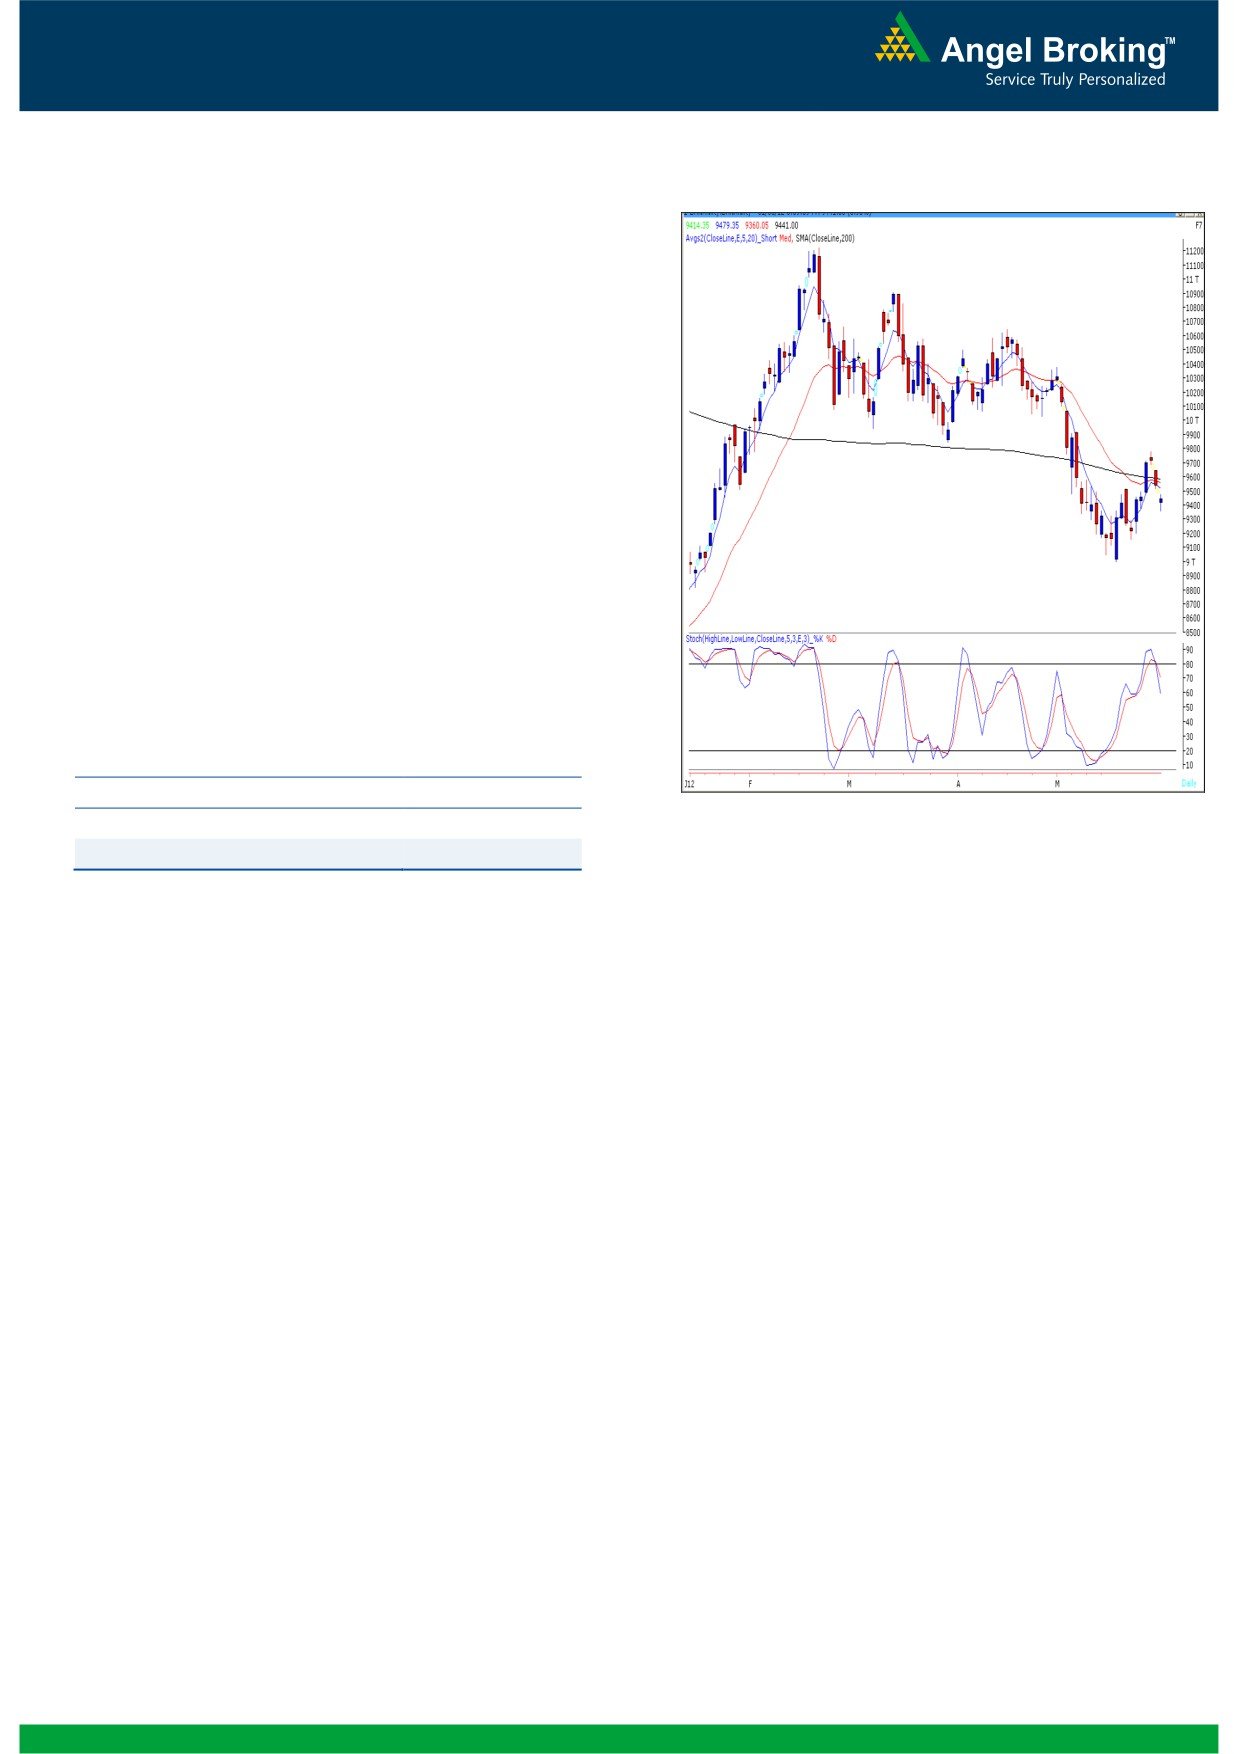
Exhibit 2: Bank Nifty Daily Chart
Bank Nifty Outlook - (9441)
For the second consecutive session, Bank Nifty
opened with a downside gap and traded in a narrow
range throughout the day. The index found support
near the mentioned level of 9370 and bounced back.
The momentum oscillator “Stochastic” on the daily
chart continues with its sell signal. The negative
crossover in “RSI - Smoothened” oscillator on the
hourly chart mentioned in our previous report is still
intact. However, it is about to enter the oversold
territory. We are also witnessing a “Spinning Top”
candlestick pattern, which is a sign of indecisiveness
prevailing at current levels. Thus we expect range
bounce activity in the coming session. On the upside
9520 - 9564 levels are likely to act as resistance and
9360 - 9270 levels are likely to act as support for the
day.
Actionable points:
View
Neutral
Source: Falcon
Resistance Levels
9520 - 9564
Support Levels
9360 - 9270
2
Daily Technical Report
June 01, 2012
Research Team Tel: 022 - 39357800
DISCLAIMER
This document is solely for the personal information of the recipient, and must not be singularly used as the basis of any investment
decision. Nothing in this document should be construed as investment or financial advice. Each recipient of this document should make
such investigations as they deem necessary to arrive at an independent evaluation of an investment in the securities of the companies
referred to in this document (including the merits and risks involved), and should consult their own advisors to determine the merits and
risks of such an investment.
Angel Broking Limited, its affiliates, directors, its proprietary trading and investment businesses may, from time to time, make
investment decisions that are inconsistent with or contradictory to the recommendations expressed herein. The views contained in this
document are those of the analyst, and the company may or may not subscribe to all the views expressed within.
Reports based on technical and derivative analysis center on studying charts of a stock's price movement, outstanding positions and
trading volume, as opposed to focusing on a company's fundamentals and, as such, may not match with a report on a company's
fundamentals.
The information in this document has been printed on the basis of publicly available information, internal data and other reliable
sources believed to be true, but we do not represent that it is accurate or complete and it should not be relied on as such, as this
document is for general guidance only. Angel Broking Limited or any of its affiliates/ group companies shall not be in any way
responsible for any loss or damage that may arise to any person from any inadvertent error in the information contained in this report.
Angel Broking Limited has not independently verified all the information contained within this document. Accordingly, we cannot testify,
nor make any representation or warranty, express or implied, to the accuracy, contents or data contained within this document. While
Angel Broking Limited endeavours to update on a reasonable basis the information discussed in this material, there may be regulatory,
compliance, or other reasons that prevent us from doing so.
This document is being supplied to you solely for your information, and its contents, information or data may not be reproduced,
redistributed or passed on, directly or indirectly.
Angel Broking Limited and its affiliates may seek to provide or have engaged in providing corporate finance, investment banking or
other advisory services in a merger or specific transaction to the companies referred to in this report, as on the date of this report or in
the past.
Neither Angel Broking Limited, nor its directors, employees or affiliates shall be liable for any loss or damage that may arise from or in
connection with the use of this information.
Note: Please refer to the important `Stock Holding Disclosure' report on the Angel website (Research Section). Also, please refer to the
latest update on respective stocks for the disclosure status in respect of those stocks. Angel Broking Limited and its affiliates may have
investment positions in the stocks recommended in this report.
Research Team
Shardul Kulkarni
-
Head - Technicals
Sameet Chavan
-
Technical Analyst
Sacchitanand Uttekar
-
Technical Analyst
Mehul Kothari
-
Technical Analyst
Ankur Lakhotia
-
Technical Analyst
Angel Broking Pvt. Ltd.
Registered Office: G-1, Ackruti Trade Centre, Rd. No. 7, MIDC, Andheri (E), Mumbai - 400 093.
Corporate Office: 6th Floor, Ackruti Star, MIDC, Andheri (E), Mumbai - 400 093. Tel: (022) 3952 6600
Sebi Registration No: INB 010996539
4