Technical Research | March 01, 2012
Daily Technical Report
Sensex (17753) / NIFTY (5385)
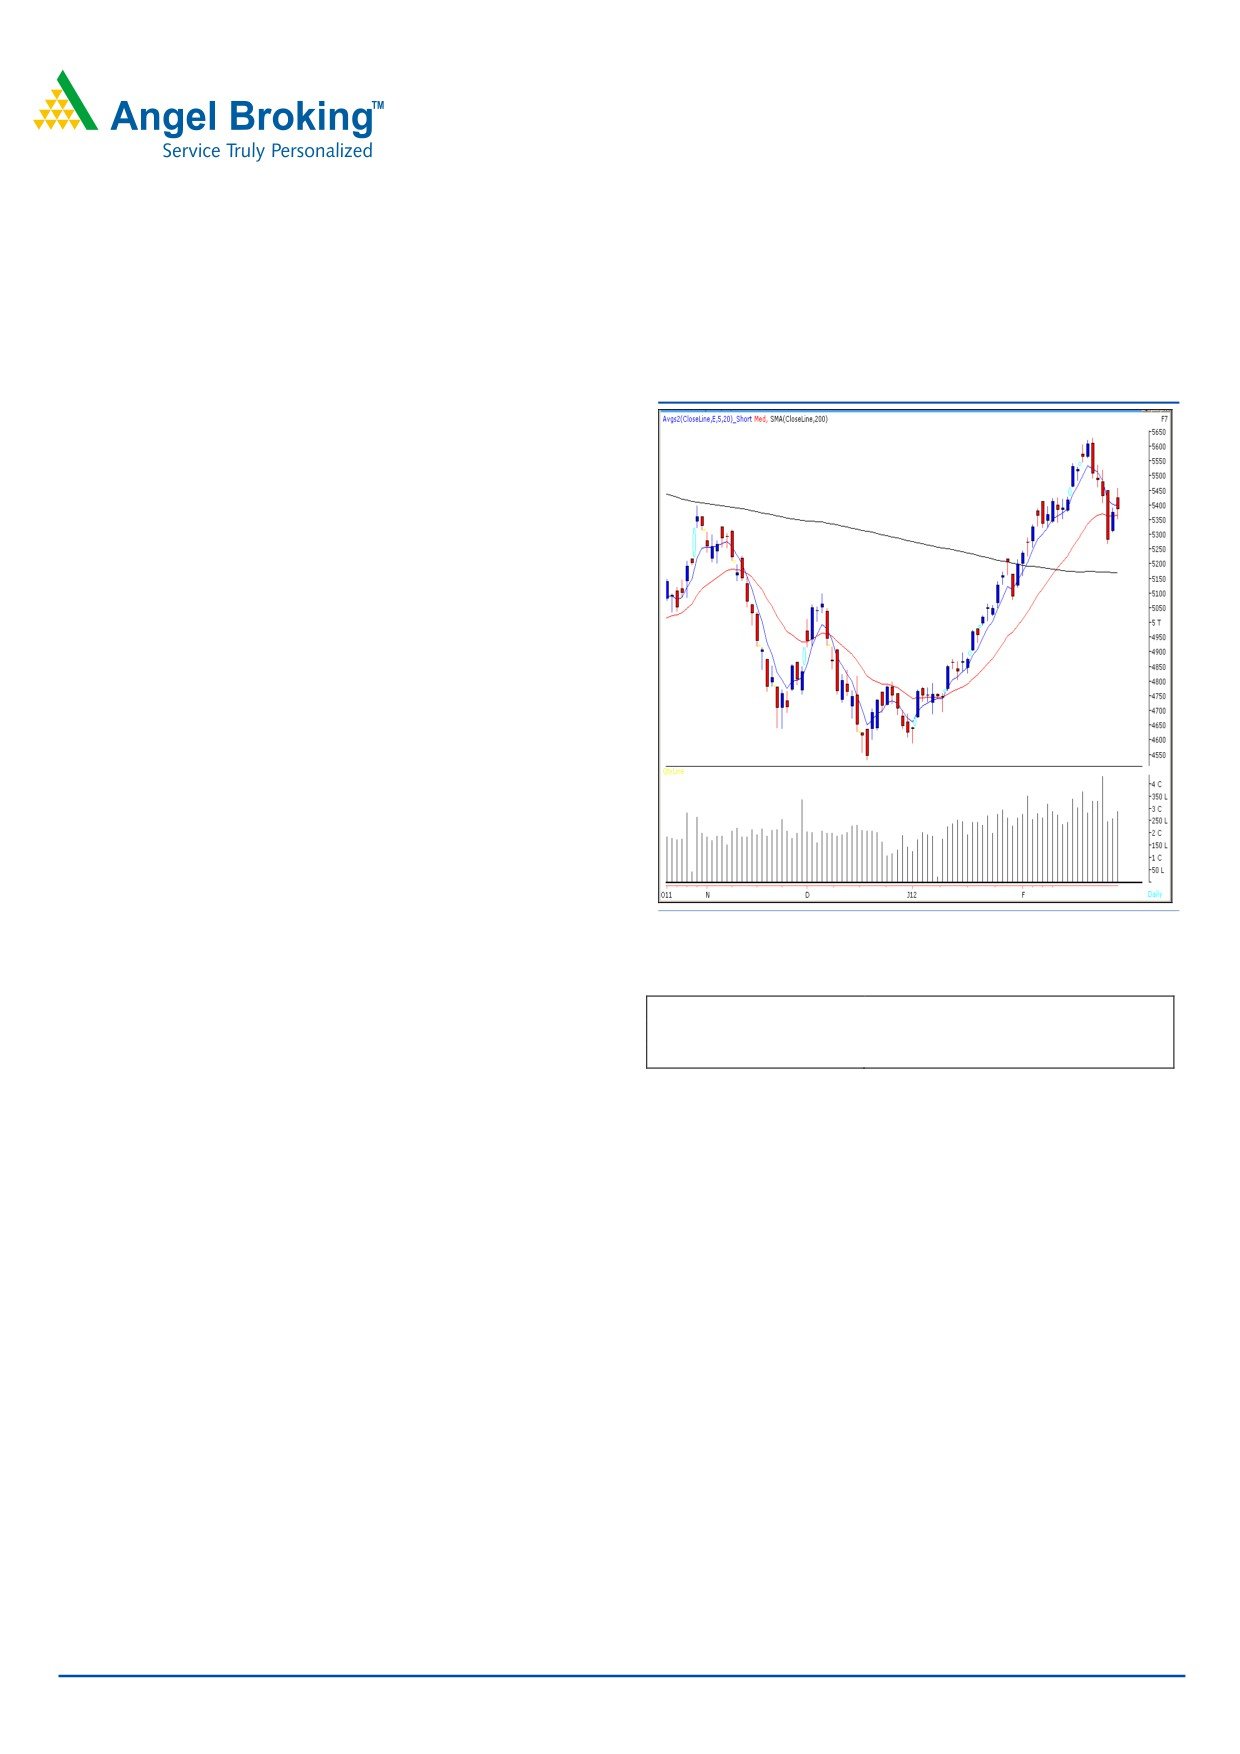
Exhibit 1: Nifty Daily Chart
Yesterday, markets opened with a significant upside gap
and continued to move higher during the first half to test
mentioned resistance at 17975 - 5450. Post mid-session,
strong selling pressure eventually dragged indices lower to
close with nominal gains. On the sectoral front, Oil & Gas,
PSU and Metal counters were among the major gainers,
whereas Capital Goods and FMCG sectors ended with a on
a losing side. The advance to decline ratio was in favor of
advancing counters. (A=1581 D=1311) (Source
-
Formation:
• The 200-day SMA and 20-day EMA have now shifted to
17200 / 5170 and 17720 / 5370, respectively.
• The weekly “Stochastic” oscillator is negatively poised.
Source: Falcon
Trading strategy:
Actionable points:
View
Negative below 5352
After a strong bounce back on Tuesday’s session, we
Expected targets
5306 - 5268
witnessed a gap up opening during yesterday’s session.
Resistance levels
5459
Subsequently, indices moved higher during the initial trade
to test Tuesday’s high of 17975 / 5450. Looking at the
global indices and the charts of the dollar index it is likely
that our markets may open lower. Going forward, if indices
sustain below yesterday’s low of 17677 / 5352, then they
are likely to drift towards the next support levels of 17530 -
17381 / 5306 - 5268. Conversely, yesterday’s high of
18001 / 5459 is likely to act as a resistance in coming
trading session. A move beyond this may push indices
higher to test 18200 / 5520 level.
For Private Circulation Only |
1
Technical Research | March 01, 2012
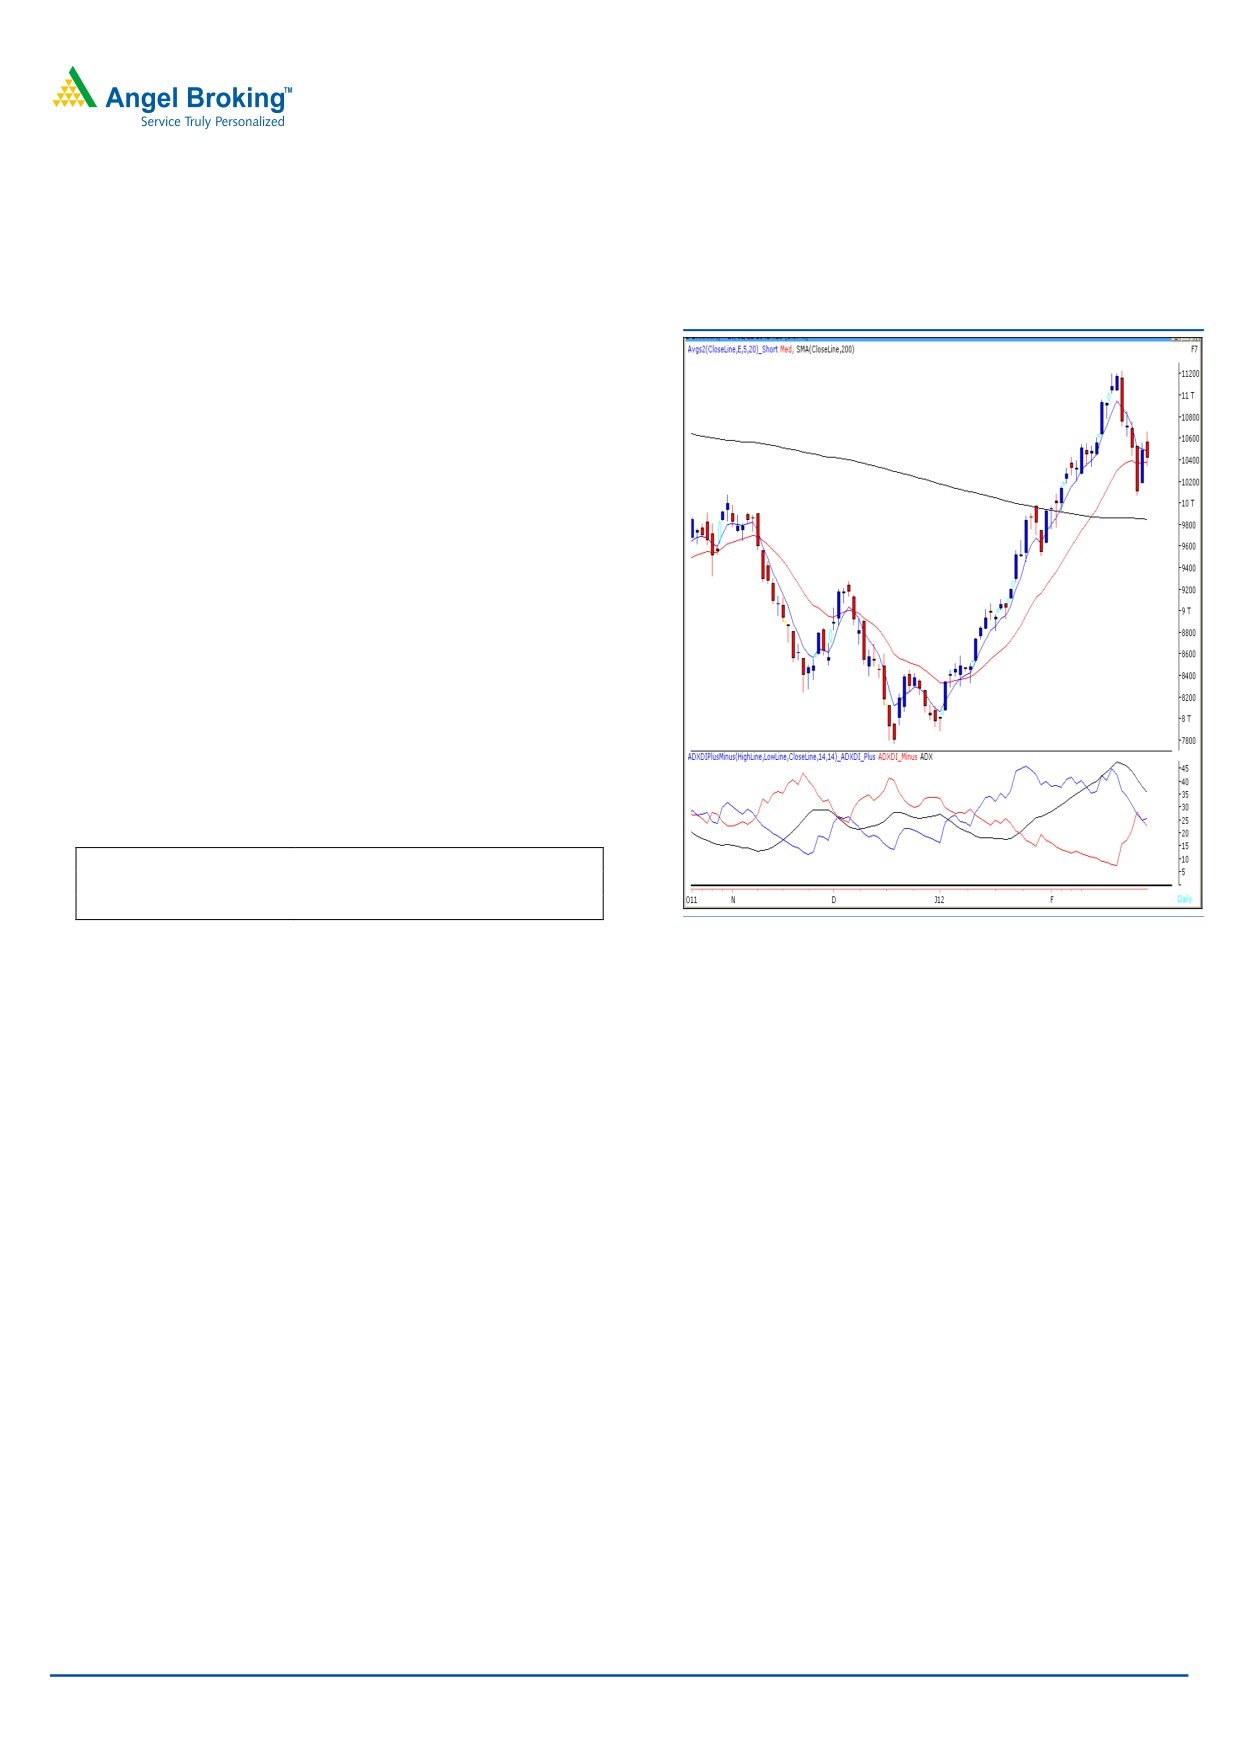
Bank Nifty Outlook - (10414)
Exhibit 2: Bank Nifty Daily Chart
Yesterday, Bank Nifty opened with an upside gap and
traded with extreme volatility throughout the day. We are
now witnessing a positive crossover in “stochastic”
momentum oscillator on the daily chart. However, on the
contrary on hourly chart we are witnessing a negative
crossover in “5 & 20 EMA”. Looking at the mixed signals
on hourly and daily charts we are of the opinion that the
index is likely to be in the range of 10800 - 10200. Only
a sustainable move outside the said range will dictate a
clear direction of the trend. In such a scenario index is
likely to find resistance at 10667 - 10800 levels. On the
downside 10200 - 10073 levels are likely to act as
support in coming trading session.
Actionable points:
View
Neutral
Resistance Levels
10667 - 10800
Support Levels
10200 - 10073
Source: Falcon
For Private Circulation Only |
2
Technical Research | March 01, 2012
Positive Bias:
Expected
Stock Name
CMP
5 Day EMA
20 Day EMA
Remarks
Target
TTK Prestige
2976.7
2901.5
2828.2
3230
View will change below 2880
Negative Bias:
Expected
Stock Name
CMP
5 Day EMA
20 Day EMA
Remarks
Target
United Spirits
572.6
591.3
629.7
539
View will change above 602
For Private Circulation Only |
3
Technical Research | March 01, 2012
Daily Pivot Levels for Nifty 50 Stocks
SCRIPS
S2
S1
PIVOT
R1
R2
SENSEX
17,487
17,620
17,811
17,943
18,134
NIFTY
5,292
5,339
5,399
5,445
5,505
BANKNIFTY
10,148
10,281
10,474
10,607
10,801
ACC
1,279
1,293
1,306
1,320
1,333
AMBUJACEM
154
157
162
166
171
AXISBANK
1,133
1,155
1,183
1,205
1,232
BAJAJ-AUTO
1,738
1,770
1,807
1,838
1,875
BHARTIARTL
340
345
349
354
358
BHEL
292
300
312
319
331
BPCL
648
655
662
670
677
CAIRN
359
364
367
373
376
CIPLA
310
313
320
323
330
COALINDIA
329
332
334
336
338
DLF
219
223
228
232
237
DRREDDY
1,601
1,622
1,641
1,662
1,681
GAIL
366
370
375
379
384
HCLTECH
480
483
484
487
488
HDFC
649
656
668
675
686
HDFCBANK
497
507
523
534
550
HEROMOTOCO
1,879
1,912
1,964
1,997
2,049
HINDALCO
142
145
148
152
155
HINDUNILVR
374
377
382
385
390
ICICIBANK
884
895
909
920
933
IDFC
135
138
142
145
148
INFY
2,841
2,862
2,885
2,906
2,929
ITC
203
205
209
212
215
JINDALSTEL
549
566
589
606
629
JPASSOCIAT
71
73
76
78
80
KOTAKBANK
527
537
552
562
576
LT
1,246
1,277
1,328
1,359
1,410
M&M
677
693
706
722
734
MARUTI
1,226
1,241
1,266
1,280
1,306
NTPC
178
179
181
183
185
ONGC
288
290
294
297
301
PNB
924
939
960
975
996
POWERGRID
111
112
113
114
115
RANBAXY
414
421
431
438
447
RCOM
89
92
94
97
100
RELIANCE
794
807
818
831
841
RELINFRA
558
576
601
619
643
RPOWER
112
116
120
123
127
SAIL
99
101
103
105
106
SBIN
2,189
2,218
2,253
2,282
2,317
SESAGOA
203
209
212
218
221
SIEMENS
769
783
803
817
837
STER
120
122
124
126
128
SUNPHARMA
534
542
554
562
574
SUZLON
25
26
27
27
28
TATAMOTORS
261
266
272
277
284
TATAPOWER
110
113
115
117
120
TATASTEEL
453
463
469
479
485
TCS
1,197
1,209
1,225
1,237
1,252
WIPRO
415
424
430
439
445
Technical Research Team
For Private Circulation Only |
4
Technical Report
RESEARCH TEAM
Shardul Kulkarni
Head - Technicals
Sameet Chavan
Technical Analyst
Sacchitanand Uttekar
Technical Analyst
Mehul Kothari
Technical Analyst
Ankur Lakhotia
Technical Analyst
Research Team: 022-3952 6600
DISCLAIMER: This document is not for public distribution and has been furnished to you solely for your information and must not
be reproduced or redistributed to any other person. Persons into whose possession this document may come are required to observe
these restrictions.
Opinion expressed is our current opinion as of the date appearing on this material only. While we endeavor to update on a
reasonable basis the information discussed in this material, there may be regulatory, compliance, or other reasons that prevent us
from doing so. Prospective investors and others are cautioned that any forward-looking statements are not predictions and may be
subject to change without notice. Our proprietary trading and investment businesses may make investment decisions that are
inconsistent with the recommendations expressed herein.
The information in this document has been printed on the basis of publicly available information, internal data and other reliable
sources believed to be true and are for general guidance only. While every effort is made to ensure the accuracy and completeness of
information contained, the company takes no guarantee and assumes no liability for any errors or omissions of the information. No
one can use the information as the basis for any claim, demand or cause of action.
Recipients of this material should rely on their own investigations and take their own professional advice. Each recipient of this
document should make such investigations as it deems necessary to arrive at an independent evaluation of an investment in the
securities of companies referred to in this document (including the merits and risks involved), and should consult their own advisors to
determine the merits and risks of such an investment. Price and value of the investments referred to in this material may go up or
down. Past performance is not a guide for future performance. Certain transactions - futures, options and other derivatives as well as
non-investment grade securities - involve substantial risks and are not suitable for all investors. Reports based on technical analysis
centers on studying charts of a stock's price movement and trading volume, as opposed to focusing on a company's fundamentals
and as such, may not match with a report on a company's fundamentals.
We do not undertake to advise you as to any change of our views expressed in this document. While we would endeavor to update
the information herein on a reasonable basis, Angel Broking, its subsidiaries and associated companies, their directors and
employees are under no obligation to update or keep the information current. Also there may be regulatory, compliance, or other
reasons that may prevent Angel Broking and affiliates from doing so. Prospective investors and others are cautioned that any
forward-looking statements are not predictions and may be subject to change without notice.
Angel Broking Limited and affiliates, including the analyst who has issued this report, may, on the date of this report, and from time
to time, have long or short positions in, and buy or sell the securities of the companies mentioned herein or engage in any other
transaction involving such securities and earn brokerage or compensation or act as advisor or have other potential conflict of interest
with respect to company/ies mentioned herein or inconsistent with any recommendation and related information and opinions.
Angel Broking Limited and affiliates may seek to provide or have engaged in providing corporate finance, investment banking or
other advisory services in a merger or specific transaction to the companies referred to in this report, as on the date of this report or
in the past.
Sebi Registration No : INB 010996539
For Private Circulation Only |