Technical Research | October 25, 2011
Daily Technical Report
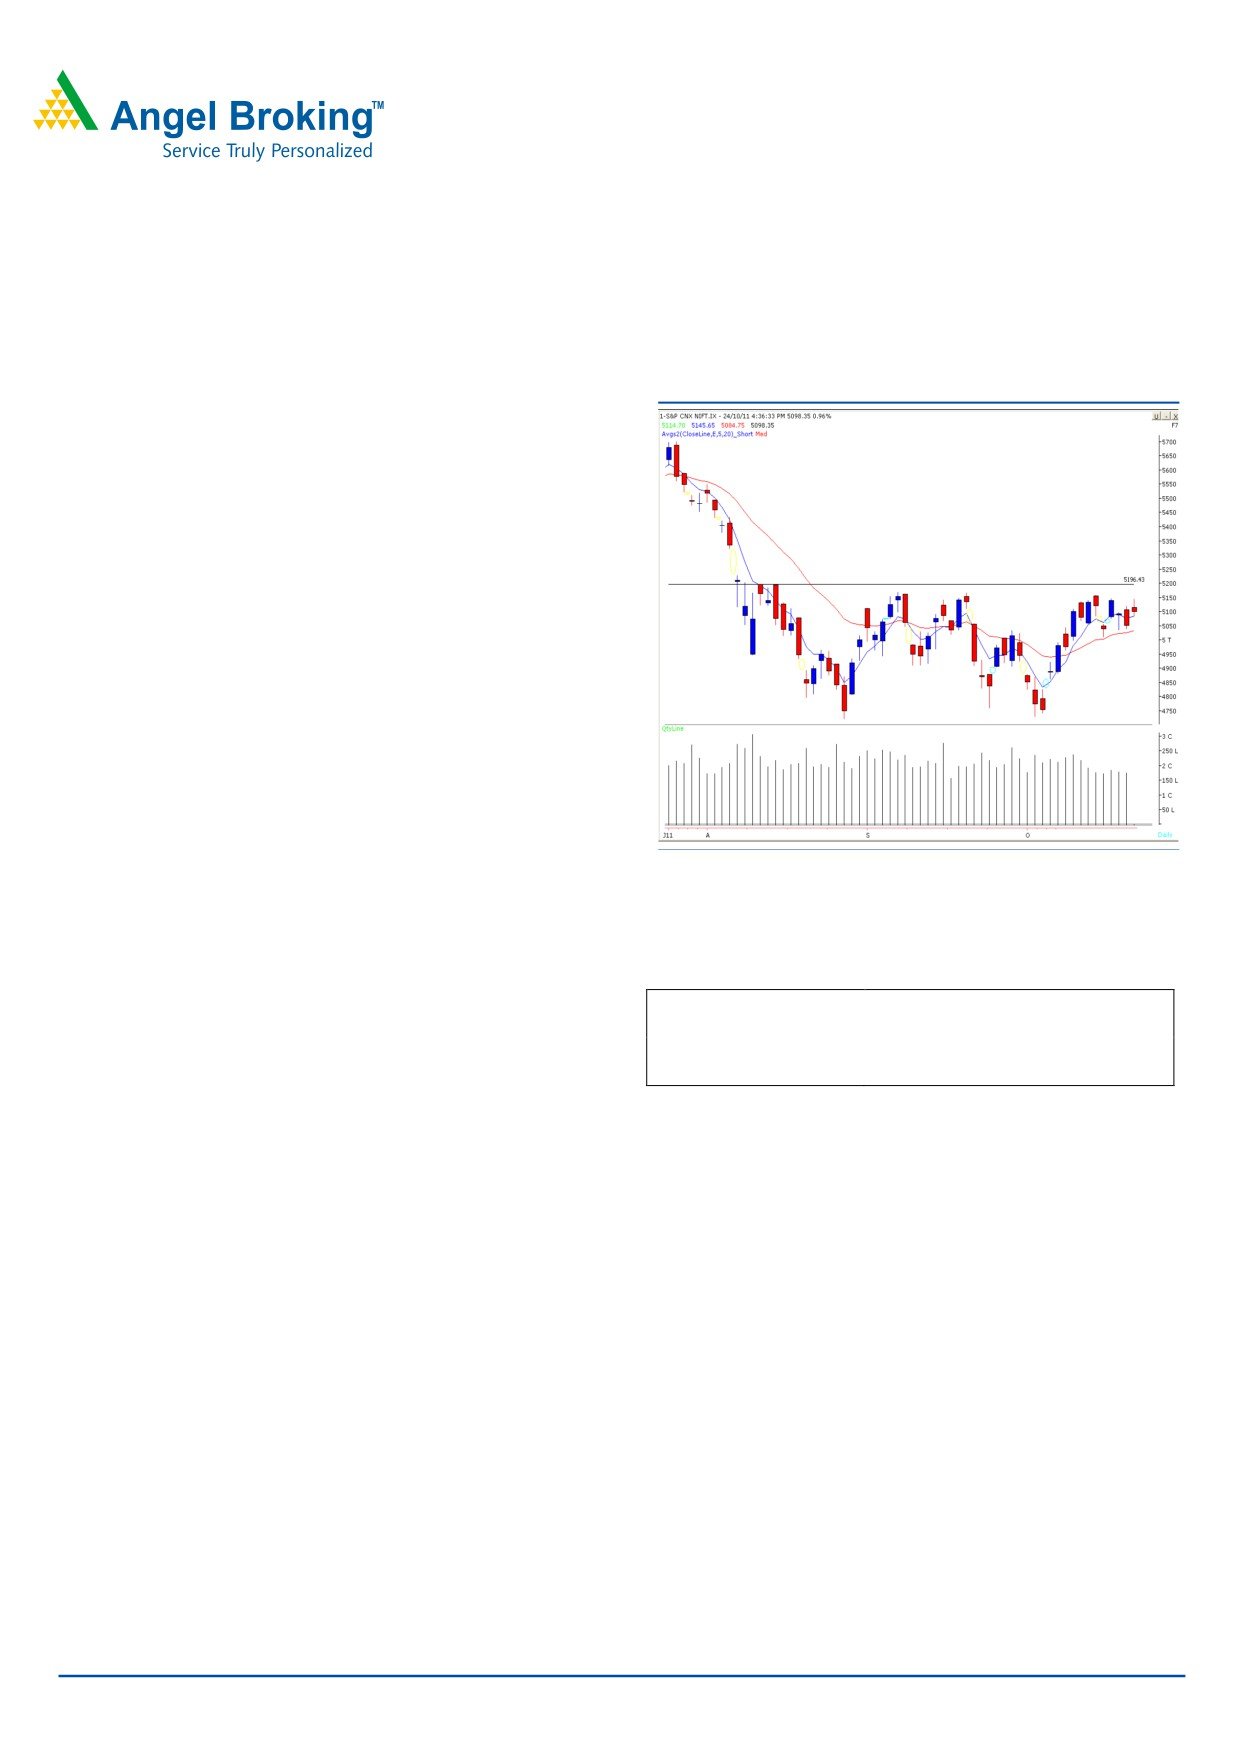
Sensex (16939) / NIFTY (5098)
Markets opened with an upside gap and moved again
Exhibit 1: Nifty Daily Chart
towards the resistance zone of 17100 - 17200 / 5160 -
5177. During the second half selling pressure intensified
which dragged indices lower to close below its iniatial
opening level. On the sector front, IT, Auto and Teck
counters were among the gainers whereas Capital Goods
sector ended on a losing side. The advance decline ratio
was in favor of declining counters (A=1278 D=1528).
Formation
• On the Weekly chart, there is a “Horizontal Line”
resistance at 17256 / 5198 level.
• The “20 EMA” on the Weekly chart is now placed at
17215 / 5172 level.
Source: Falcon
• On the Daily chart, the “20 EMA” is placed at 16714 /
5025 level.
Actionable points:
Trading strategy:
Indices opened significantly higher on the back of positive
View
Neutral
sentiments across global indices and subsequently moved
Resistance Levels
5177 - 5198
Support Levels
5011 - 4944
towards the stiff resistance zone of 17100 - 17200 / 5160
- 5177 where once again we witnessed strong selling
pressure. As mentioned earlier, until and unless indices
don’t break out of the trading range of 17256 to 16669 /
5198 to 5011 on either side, we may not get clear direction
of the trend. Thus, going forward, 17200 - 17256 / 5177 -
5198 levels remain to be a strong resistance zone. On the
downside, indices have a decent support around 16714 -
16669 / 5025 - 5011 levels. A breach of these levels may
attract selling pressure which would drag indices lower to
test 16460 - 16300 / 4944 - 4890 levels.
The coming trading session is likely to trade with immense
volatility on account of “RBI Monetary Policy” and Derivative
expiry.Therefore, we advise traders to stay light on positions
and trade with strict stop losses.
For Private Circulation Only |
1
Technical Research | October 25, 2011
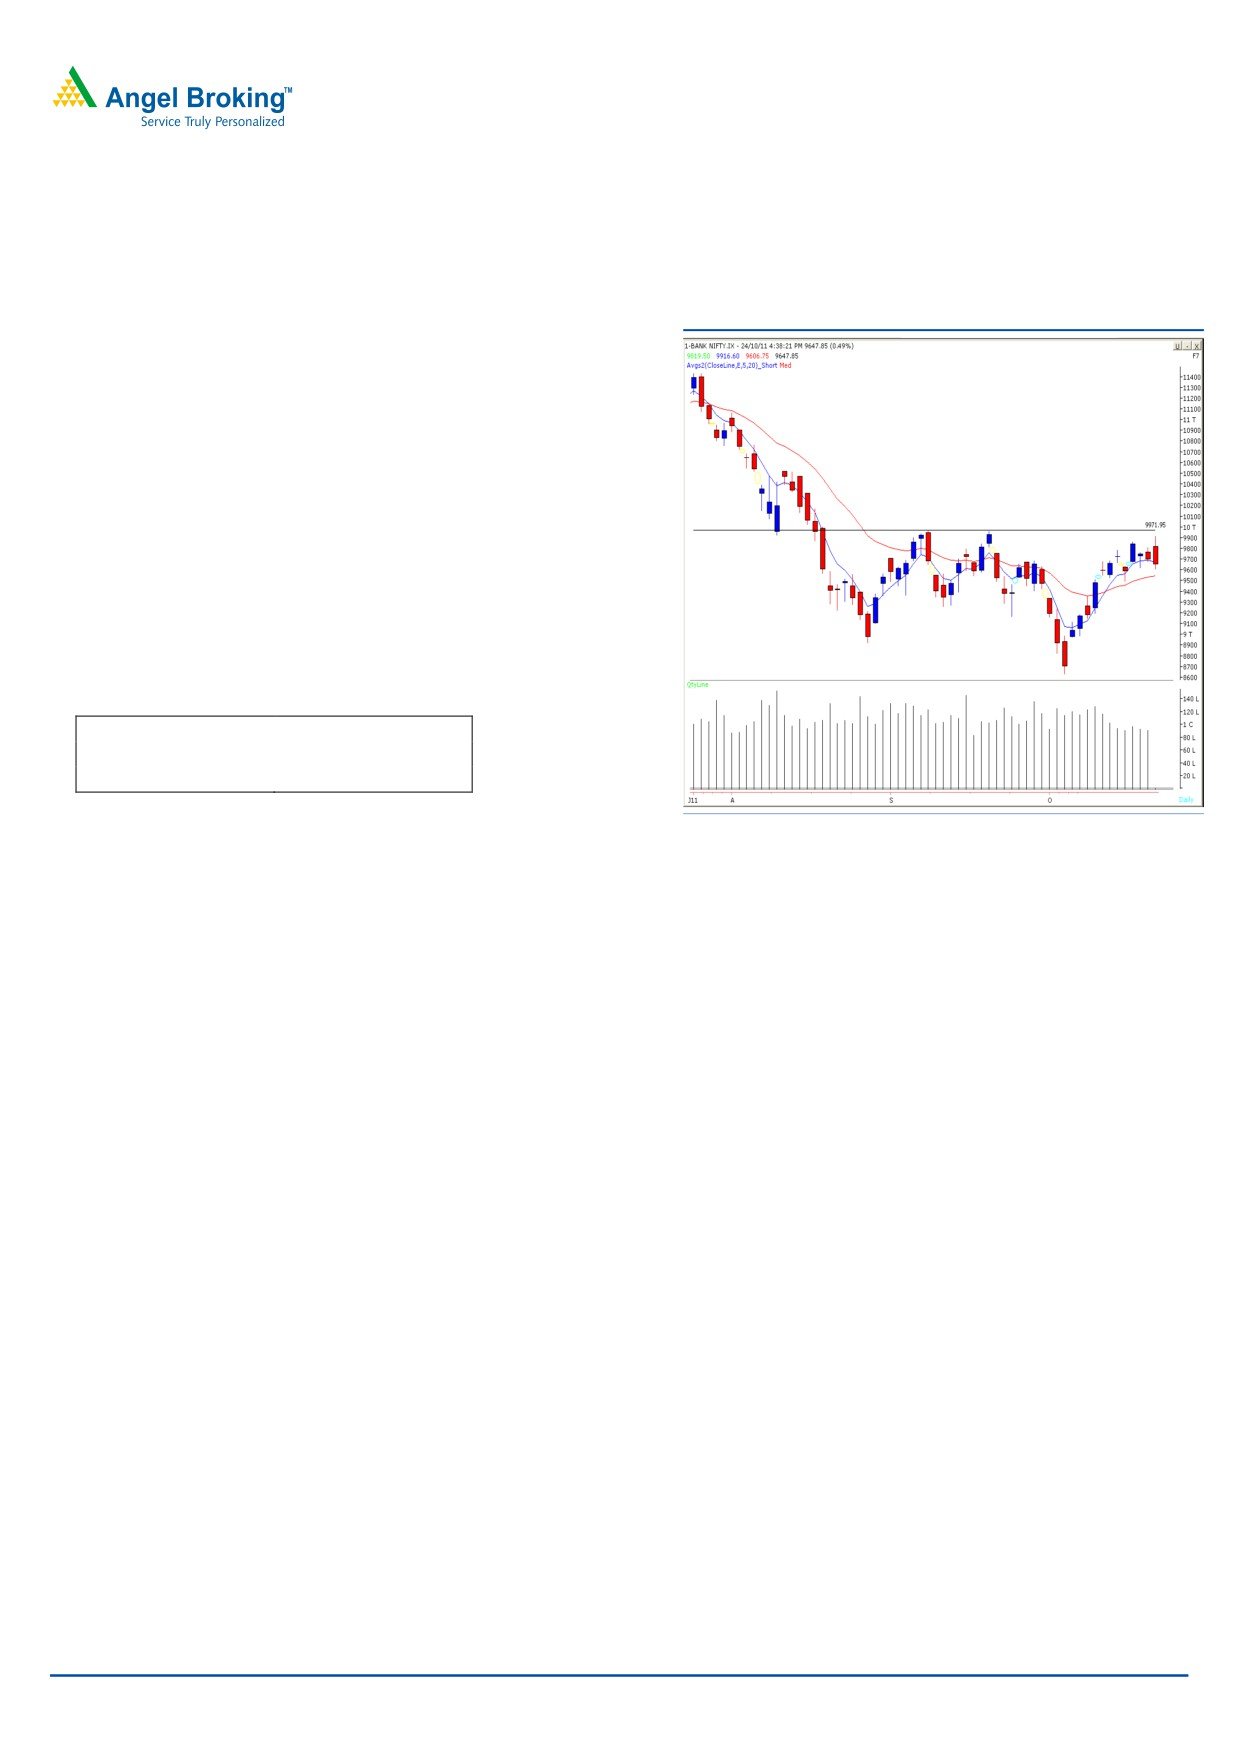
Bank Nifty Outlook - (9648)
Exhibit 2: Bank Nifty Daily Chart
Bank nifty tested mentioned resistance level of 9970 during
the initial part of the session. However, during the second
half selling pressure emerged near this resistance which led
the index to test support level of 9580. We reiterate our view
that 9970 - 10030 levels may act as a stiff resistance for
Bank Nifty; only a close beyond these levels would provide
clear direction of the trend.
On the downside, 9580 - 9430 levels may act as a support
level for the day.
Actionable points:
View
Neutral
Resistance Levels
9970 - 10030
Support Level
9580 - 9430
Source: Falcon
For Private Circulation Only |
2
Technical Research | October 25, 2011
Positive Bias:
Stock Name
5 Day EMA
20 Day EMA
Expected Target
Remarks
Ongc
269.7
267.2
289
View will change below 268
HindUnilvr
331.7
331.3
347
View will change below 331
Negative Bias:
Stock Name
5 Day EMA
20 Day EMA
Expected Target
Remarks
Larsen & Toubro
1344.8
1401.5
1245
View will change above 1352
Renuka
55.2
56
51.50
View will change above 56.2
For Private Circulation Only |
3
Technical Research | October 25, 2011
Daily Pivot Levels for Nifty 50 Stocks
SCRIPS
S2
S1
PIVOT
R1
R2
SENSEX
16,775
16,857
16,981
17,063
17,187
NIFTY
5,049
5,074
5,110
5,134
5,170
BANKNIFTY
9,414
9,531
9,724
9,841
10,034
ACC
1,117
1,125
1,135
1,144
1,154
AMBUJACEM
148
149
152
154
156
AXISBANK
1,134
1,151
1,170
1,187
1,206
BAJAJ-AUTO
1,635
1,665
1,685
1,715
1,735
BHARTIARTL
374
378
382
386
389
BHEL
311
315
321
324
330
BPCL
637
640
644
648
652
CAIRN
285
288
292
295
298
CIPLA
286
288
289
291
292
DLF
223
226
229
232
236
DRREDDY
1,530
1,537
1,546
1,553
1,562
GAIL
417
421
425
429
432
HCLTECH
415
420
423
427
430
HDFC
627
634
641
648
655
HDFCBANK
474
479
488
493
502
HEROMOTOCO
2,046
2,059
2,075
2,088
2,104
HINDALCO
121
122
124
125
127
HINDUNILVR
324
330
334
341
345
ICICIBANK
839
854
876
890
912
IDFC
120
122
123
125
126
INFY
2,728
2,747
2,761
2,781
2,795
ITC
202
205
206
209
210
JINDALSTEL
511
521
533
543
555
JPASSOCIAT
69
70
71
72
73
KOTAKBANK
464
468
472
476
480
LT
1,253
1,274
1,312
1,333
1,371
M&M
804
807
811
814
818
MARUTI
1,096
1,104
1,114
1,123
1,133
NTPC
169
170
172
173
174
ONGC
263
270
274
280
284
PNB
935
953
980
998
1,026
POWERGRID
100
100
101
101
102
RANBAXY
497
501
506
510
515
RCOM
70
72
73
75
76
RELCAPITAL
323
329
336
341
349
RELIANCE
838
842
848
852
858
RELINFRA
395
401
408
414
420
RPOWER
83
86
88
90
92
SAIL
104
105
106
107
109
SBIN
1,825
1,867
1,928
1,970
2,031
SESAGOA
202
205
209
212
216
SIEMENS
798
807
824
833
850
STER
105
110
115
121
125
SUNPHARMA
464
473
487
496
510
SUZLON
36
36
37
38
39
TATAMOTORS
181
183
185
188
190
TATAPOWER
97
98
98
99
100
TATASTEEL
429
433
438
442
448
TCS
1,044
1,062
1,077
1,095
1,110
WIPRO
350
354
360
364
369
Technical Research Team
For Private Circulation Only |
4
Technical Report
RESEARCH TEAM
Shardul Kulkarni
Head - Technicals
Sameet Chavan
Technical Analyst
Sacchitanand Uttekar
Technical Analyst
Mehul Kothari
Technical Analyst
Ankur Lakhotia
Technical Analyst
Research Team: 022-3952 6600
DISCLAIMER: This document is not for public distribution and has been furnished to you solely for your information and must not
be reproduced or redistributed to any other person. Persons into whose possession this document may come are required to observe
these restrictions.
Opinion expressed is our current opinion as of the date appearing on this material only. While we endeavor to update on a
reasonable basis the information discussed in this material, there may be regulatory, compliance, or other reasons that prevent us
from doing so. Prospective investors and others are cautioned that any forward-looking statements are not predictions and may be
subject to change without notice. Our proprietary trading and investment businesses may make investment decisions that are
inconsistent with the recommendations expressed herein.
The information in this document has been printed on the basis of publicly available information, internal data and other reliable
sources believed to be true and are for general guidance only. While every effort is made to ensure the accuracy and completeness of
information contained, the company takes no guarantee and assumes no liability for any errors or omissions of the information. No
one can use the information as the basis for any claim, demand or cause of action.
Recipients of this material should rely on their own investigations and take their own professional advice. Each recipient of this
document should make such investigations as it deems necessary to arrive at an independent evaluation of an investment in the
securities of companies referred to in this document (including the merits and risks involved), and should consult their own advisors to
determine the merits and risks of such an investment. Price and value of the investments referred to in this material may go up or
down. Past performance is not a guide for future performance. Certain transactions - futures, options and other derivatives as well as
non-investment grade securities - involve substantial risks and are not suitable for all investors. Reports based on technical analysis
centers on studying charts of a stock's price movement and trading volume, as opposed to focusing on a company's fundamentals
and as such, may not match with a report on a company's fundamentals.
We do not undertake to advise you as to any change of our views expressed in this document. While we would endeavor to update
the information herein on a reasonable basis, Angel Broking, its subsidiaries and associated companies, their directors and
employees are under no obligation to update or keep the information current. Also there may be regulatory, compliance, or other
reasons that may prevent Angel Broking and affiliates from doing so. Prospective investors and others are cautioned that any
forward-looking statements are not predictions and may be subject to change without notice.
Angel Broking Limited and affiliates, including the analyst who has issued this report, may, on the date of this report, and from time
to time, have long or short positions in, and buy or sell the securities of the companies mentioned herein or engage in any other
transaction involving such securities and earn brokerage or compensation or act as advisor or have other potential conflict of interest
with respect to company/ies mentioned herein or inconsistent with any recommendation and related information and opinions.
Angel Broking Limited and affiliates may seek to provide or have engaged in providing corporate finance, investment banking or
other advisory services in a merger or specific transaction to the companies referred to in this report, as on the date of this report or
in the past.
Sebi Registration No : INB 010996539
For Private Circulation Only |