Technical Research | August 22, 2011
Daily Technical Report
Sensex (16142) / Nifty (4846)
Markets opened nearly 2% lower due to extreme pessimism
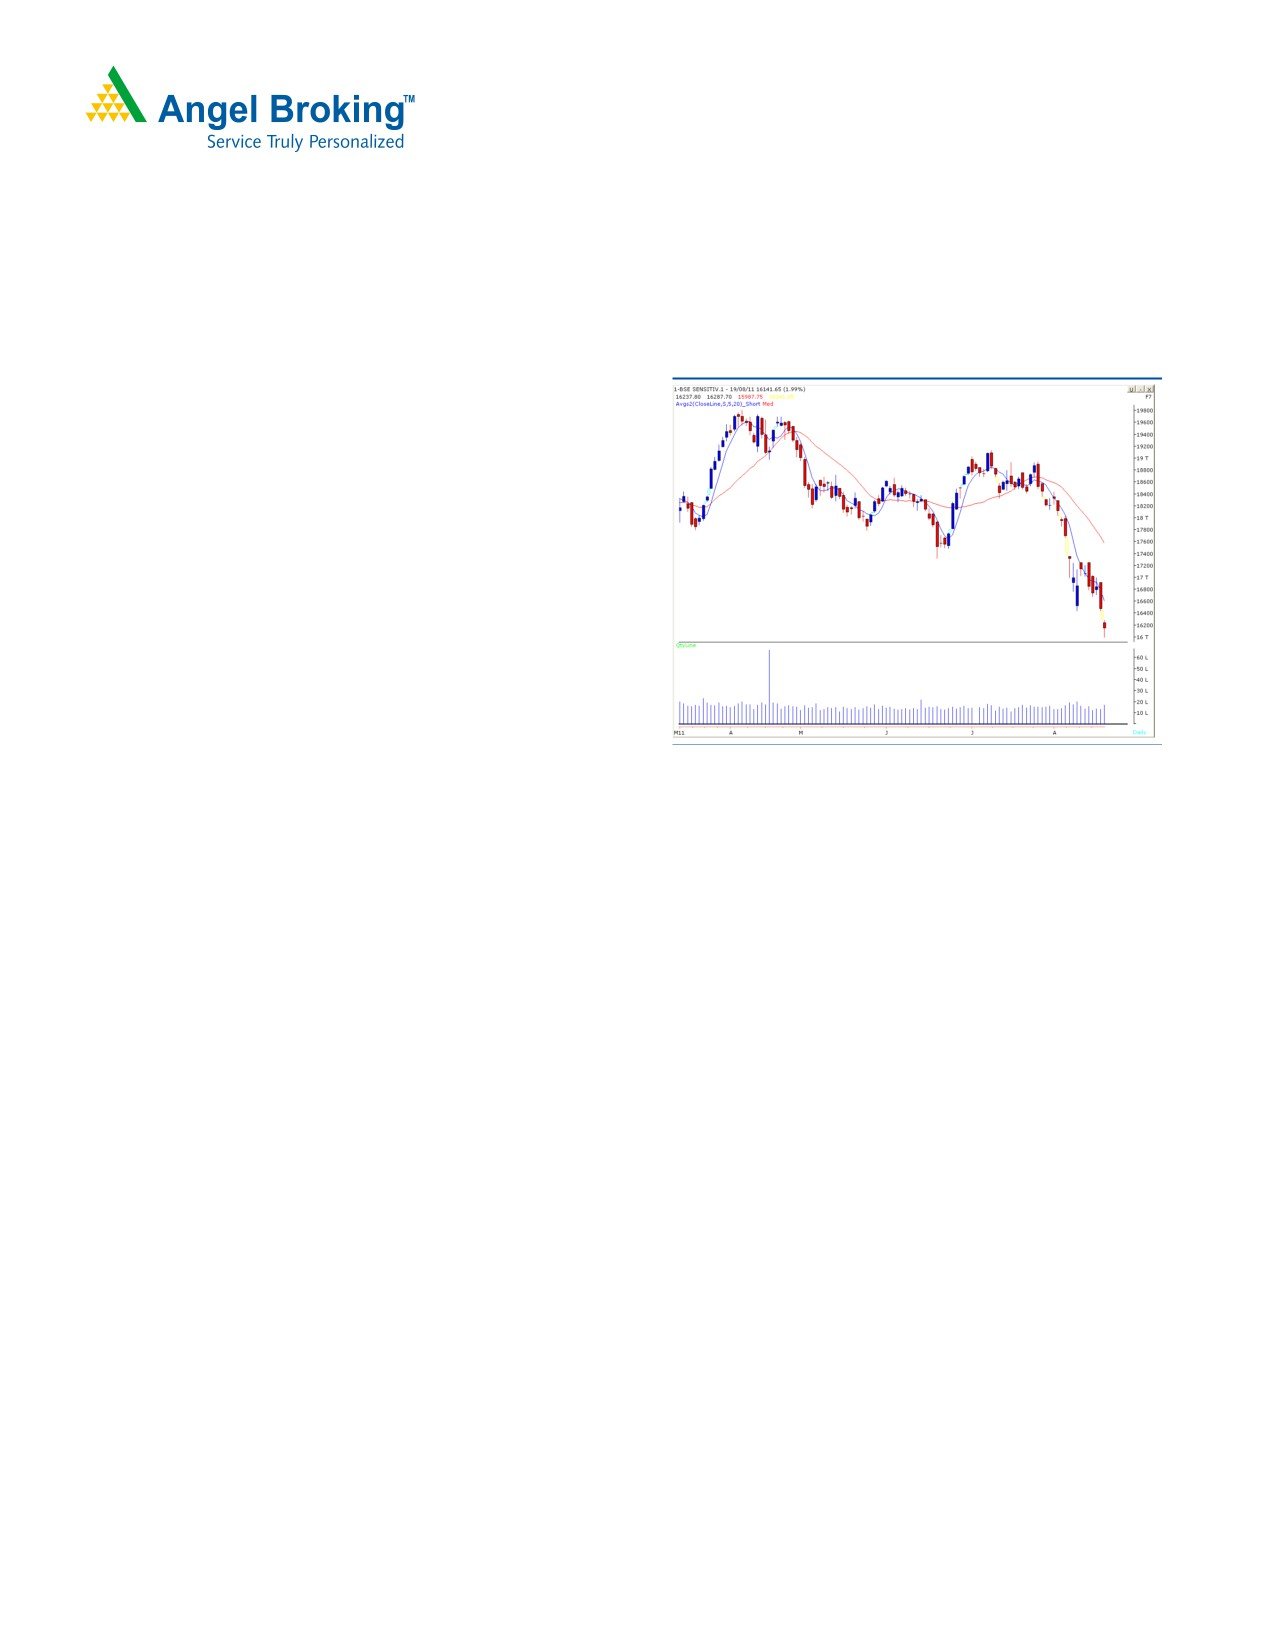
Exhibit 1: Sensex Daily Chart
across global cues and traded with immense volatily
throughout the day to give a close in the neagative territory.
On the sector front IT, Capital Goods and Teck counters
were among the major losers whereas Realty sector ended
with a marginal gain. The advance decline ratio was in
favor of declining counters (A=773 D=2083). (Source -
Formation
The ADX (14) line for Sensex / Nifty continues to
move up from the last week’s level of 21.07 /
20.75 to the current week’s level of 23.15 / 22.85
along with
- DI (Negative Directional Index)
Source: Falcon
moving upwards.
The Daily chart depicts a candlestick pattern which
resembles a “Bullish Hammer”. This pattern needs
This possible upside rally can only be construed as a
a confirmation.
bounce back of the fall which can be used as exit
opportunity for the traders. Also, due to Derivative expiry,
Trading strategy:
the coming week is likely to trade with extreme volatility. On
Our benchmark indices tumbled from a high of 17036 /
the downside, a violation of Friday’s low of 15987 / 4796
5132 during the week and Nifty closed well below the
can take indices to lower levels of 15650 - 15330 / 4675 -
psychological level of 5000. As expected and mentioned in
4540.
our previous reports, markets fell down to test lower level of
16000 / 4800 on Friday’s session. The ADX (14) indicator
continues to move up with the rising
- DI (Negative
Directional Index) which indicates strength in the negative
trend in coming weeks. On the other hand, we are
witnessing a candlestick pattern which resembles a “Bullish
Hammer” coupled with oversold condition of momentum
oscillators indicate a possibility of minor bounce back in
coming sessions if indices manage to trade above the
Friday’s high 16288 / 4894. In this case, indices may test
16450 - 16750 / 4950 - 5050 levels. The said pattern will
be negated if indices break low of the candle.
For Private Circulation Only |
1
Technical Report
RESEARCH TEAM
Shardul Kulkarni
Head - Technicals
Sameet Chavan
Technical Analyst
Sacchitanand Uttekar
Technical Analyst
Mehul Kothari
Technical Analyst
Ankur Lakhotia
Technical Analyst
Research Team: 022-3935 7600
DISCLAIMER: This document is not for public distribution and has been furnished to you solely for your information
and must not be reproduced or redistributed to any other person. Persons into whose possession this document may
come are required to observe these restrictions.
Opinion expressed is our current opinion as of the date appearing on this material only. While we endeavor to update
on a reasonable basis the information discussed in this material, there may be regulatory, compliance, or other reasons
that prevent us from doing so. Prospective investors and others are cautioned that any forward-looking statements are
not predictions and may be subject to change without notice. Our proprietary trading and investment businesses may
make investment decisions that are inconsistent with the recommendations expressed herein.
The information in this document has been printed on the basis of publicly available information, internal data and
other reliable sources believed to be true and are for general guidance only. While every effort is made to ensure the
accuracy and completeness of information contained, the company takes no guarantee and assumes no liability for any
errors or omissions of the information. No one can use the information as the basis for any claim, demand or cause of
action.
Recipients of this material should rely on their own investigations and take their own professional advice. Each recipient
of this document should make such investigations as it deems necessary to arrive at an independent evaluation of an
investment in the securities of companies referred to in this document (including the merits and risks involved), and
should consult their own advisors to determine the merits and risks of such an investment. Price and value of the
investments referred to in this material may go up or down. Past performance is not a guide for future performance.
Certain transactions - futures, options and other derivatives as well as non-investment grade securities - involve
substantial risks and are not suitable for all investors. Reports based on technical analysis centers on studying charts of a
stock's price movement and trading volume, as opposed to focusing on a company's fundamentals and as such, may
not match with a report on a company's fundamentals.
We do not undertake to advise you as to any change of our views expressed in this document. While we would
endeavor to update the information herein on a reasonable basis, Angel Broking, its subsidiaries and associated
companies, their directors and employees are under no obligation to update or keep the information current. Also there
may be regulatory, compliance, or other reasons that may prevent Angel Broking and affiliates from doing so.
Prospective investors and others are cautioned that any forward-looking statements are not predictions and may be
subject to change without notice.
Angel Broking Limited and affiliates, including the analyst who has issued this report, may, on the date of this report,
and from time to time, have long or short positions in, and buy or sell the securities of the companies mentioned herein
or engage in any other transaction involving such securities and earn brokerage or compensation or act as advisor or
have other potential conflict of interest with respect to company/ies mentioned herein or inconsistent with any
recommendation and related information and opinions.
Angel Broking Limited and affiliates may seek to provide or have engaged in providing corporate finance, investment
banking or other advisory services in a merger or specific transaction to the companies referred to in this report, as on
the date of this report or in the past.
Sebi Registration No : INB 010996539
For Private Circulation Only |
3