Technical Research | June 15, 2011
Daily Technical Report
Sensex (18309) / Nifty (5500)
Markets opened higher and traded in a narrow range
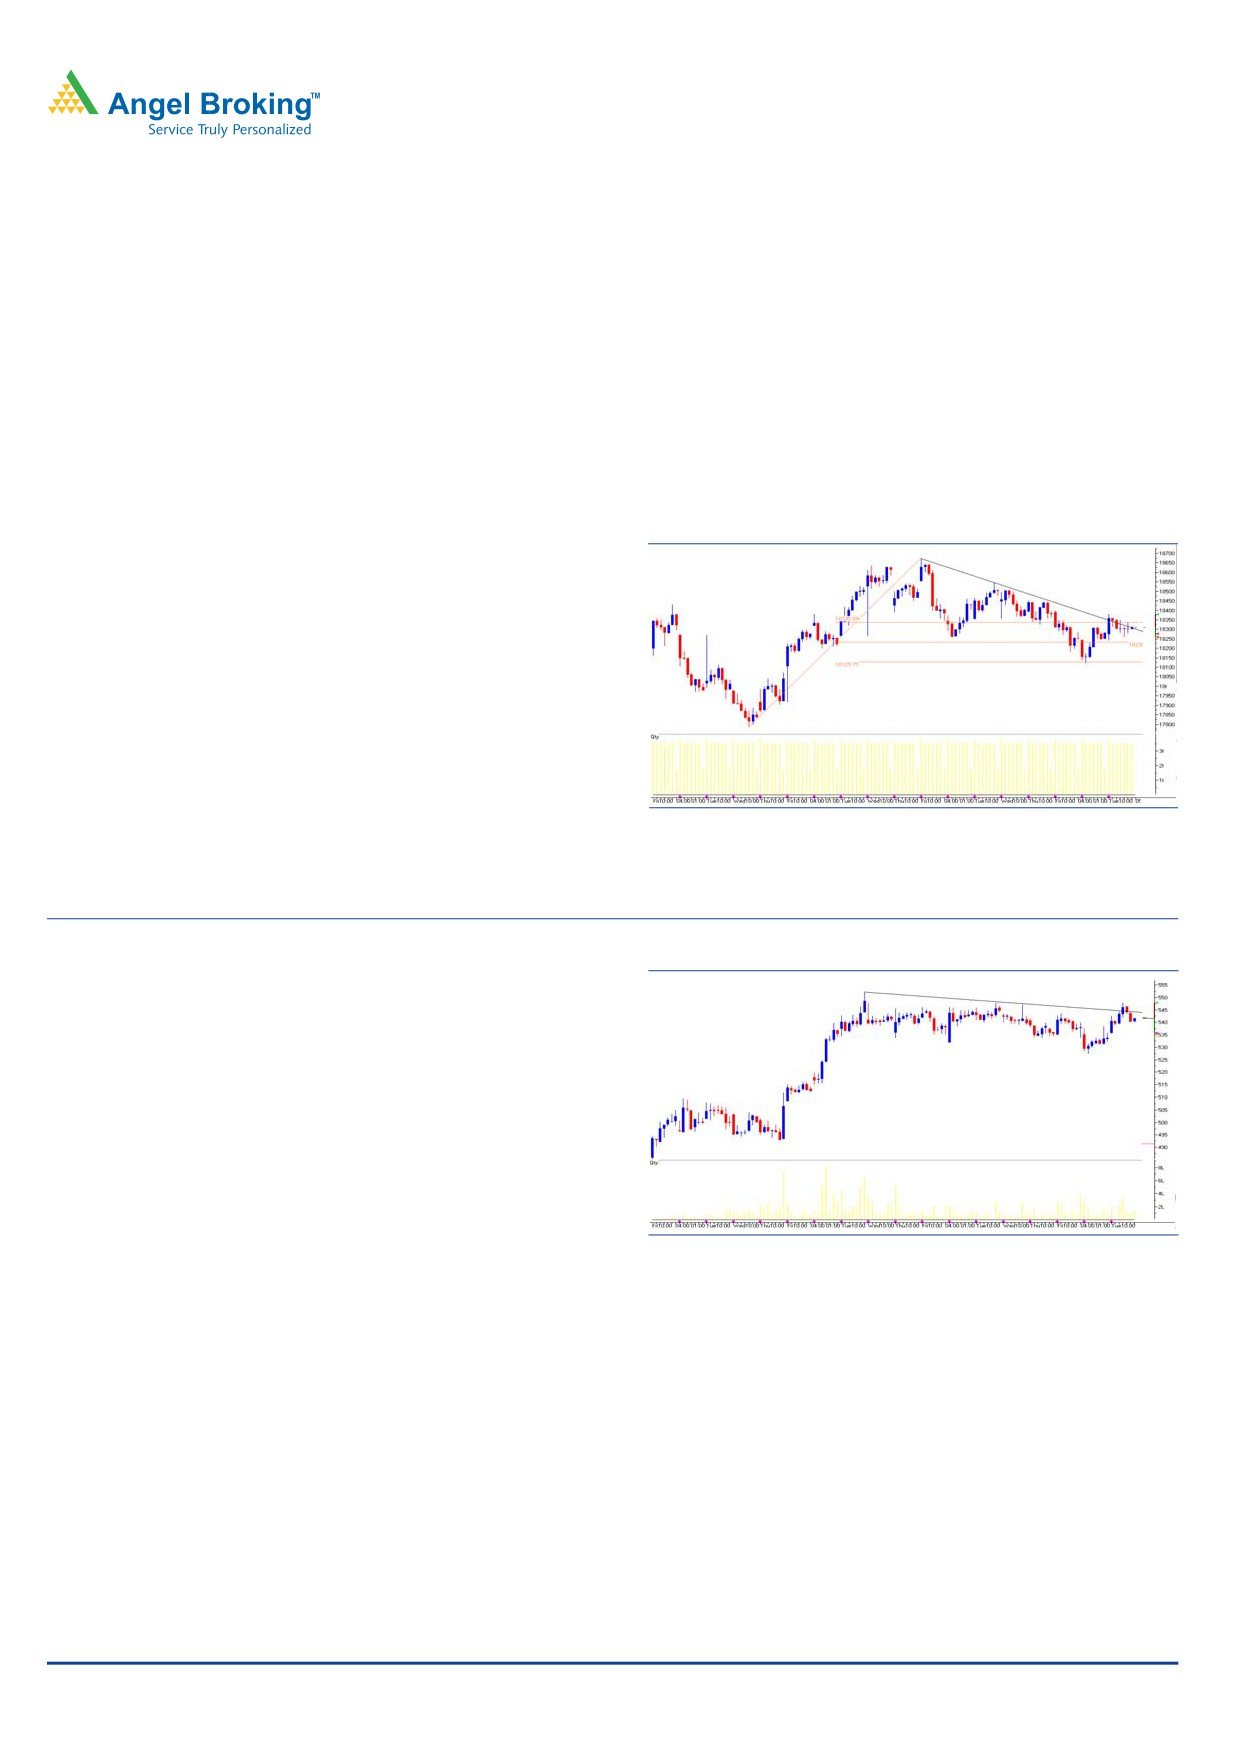
sloping trend line and trade above 18380 / 5520 levels then
throughout the day to close marginally in green. On the sector
they are likely to test 18545 - 18630 / 5570 - 5600 levels. On
front, Consumer Goods, Power and FMCG were among the
the downside, 18240 - 18120 - 17940 / 5470 - 5436 - 5400
gainers whereas Consumer Durable, Oil & GAS and Auto ended
are support levels for the day.
with minor losses. The advance decline ratio was in favor of
Exhibit 1: Sensex Hourly Chart
advancing counters (A=1627 D=1249). (Source - Iris software)
Formation
As shown in the exhibit, on the Hourly chart we are
observing that prices after taking support at 61.8% Fibonacci
retracement level have managed to close higher. Presently the
indices face minor resistance at the downward sloping trend
line.
Trading strategy:
Source: Falcon
The current price action on the Hourly charts suggests that on
the upside, if indices cross the resistance of the downward
Stock Recommendations:
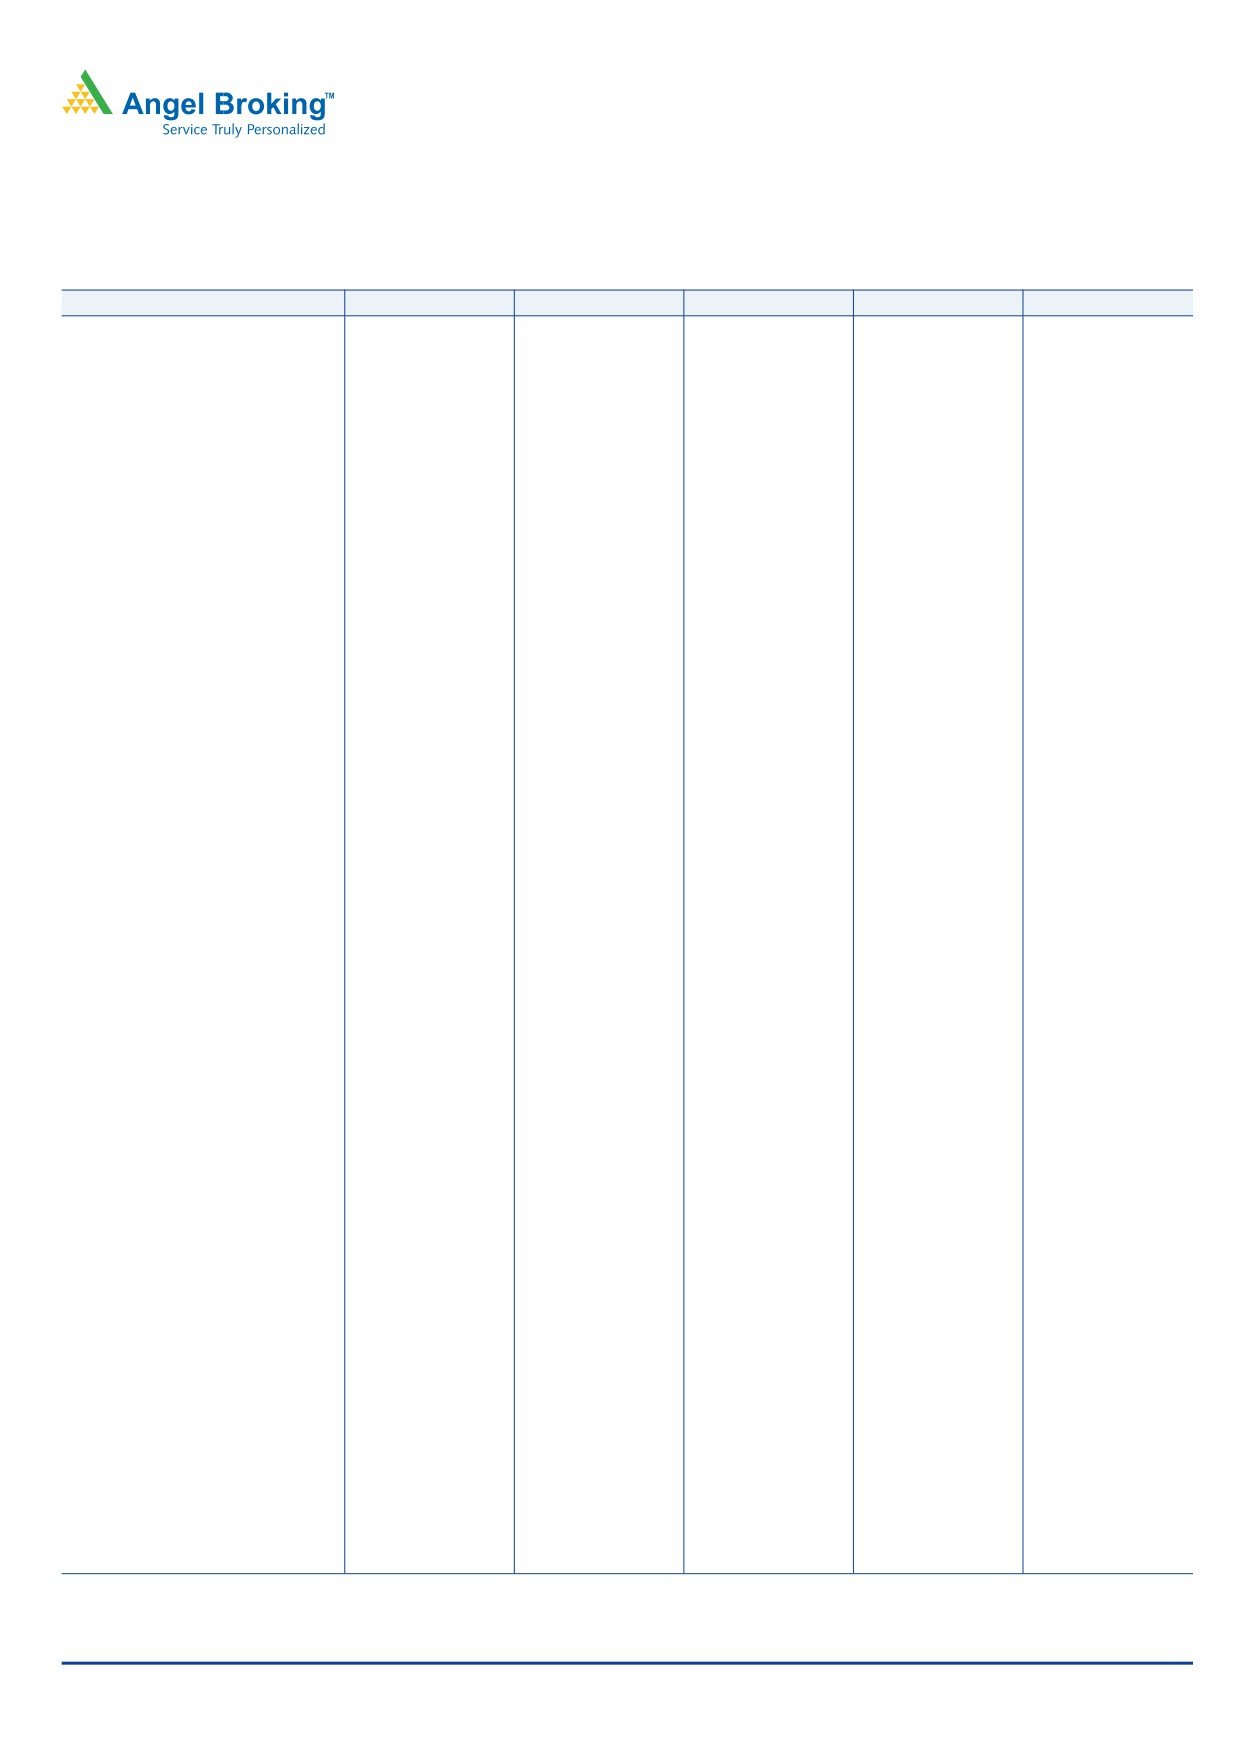
Exhibit 2: Ranbaxy (June Futures) - Hourly Chart
Stock - Ranbaxy (June Futures)
Action - Buy
Range
:
`544.50 - 543.50
Stop Loss :
`538.45
Target
:
`560.00
Source: Falcon
For Private Circulation Only | Angel Broking Ltd: BSE Sebi Regn No : INB 010996539 / CDSL Regn No: IN - DP - CDSL - 234 - 2004 / PMS Regn Code: PM/INP00000154 6 Angel Securities Ltd:BSE: INB010994639/INF010994639 NSE: INB230994635/INF230994635 Membership numbers: BSE 028/NSE:09946
1
Technical Report
RESEARCH TEAM
Shardul Kulkarni
Head - Technicals
Mileen Vasudeo
Technical Analyst
Sameet Chavan
Technical Analyst
Sacchitanand Uttekar
Technical Analyst
Mehul Kothari
Technical Analyst
Research Team: 022-3952 6600
DISCLAIMER: This document is not for public distribution and has been furnished to you solely for your information and must
not be reproduced or redistributed to any other person. Persons into whose possession this document may come are required
to observe these restrictions.
Opinion expressed is our current opinion as of the date appearing on this material only. While we endeavor to update on a
reasonable basis the information discussed in this material, there may be regulatory, compliance, or other reasons that prevent
us from doing so. Prospective investors and others are cautioned that any forward-looking statements are not predictions and
may be subject to change without notice. Our proprietary trading and investment businesses may make investment decisions
that are inconsistent with the recommendations expressed herein.
The information in this document has been printed on the basis of publicly available information, internal data and other
reliable sources believed to be true and are for general guidance only. While every effort is made to ensure the accuracy and
completeness of information contained, the company takes no guarantee and assumes no liability for any errors or omissions
of the information. No one can use the information as the basis for any claim, demand or cause of action.
Recipients of this material should rely on their own investigations and take their own professional advice. Each recipient of this
document should make such investigations as it deems necessary to arrive at an independent evaluation of an investment in the
securities of companies referred to in this document (including the merits and risks involved), and should consult their own
advisors to determine the merits and risks of such an investment. Price and value of the investments referred to in this material
may go up or down. Past performance is not a guide for future performance. Certain transactions - futures, options and other
derivatives as well as non-investment grade securities - involve substantial risks and are not suitable for all investors. Reports
based on technical analysis centers on studying charts of a stock's price movement and trading volume, as opposed to focusing
on a company's fundamentals and as such, may not match with a report on a company's fundamentals.
We do not undertake to advise you as to any change of our views expressed in this document. While we would endeavor to
update the information herein on a reasonable basis, Angel Broking, its subsidiaries and associated companies, their directors
and employees are under no obligation to update or keep the information current. Also there may be regulatory, compliance,
or other reasons that may prevent Angel Broking and affiliates from doing so. Prospective investors and others are cautioned
that any forward-looking statements are not predictions and may be subject to change without notice.
Angel Broking Limited and affiliates, including the analyst who has issued this report, may, on the date of this report, and from
time to time, have long or short positions in, and buy or sell the securities of the companies mentioned herein or engage in any
other transaction involving such securities and earn brokerage or compensation or act as advisor or have other potential
conflict of interest with respect to company/ies mentioned herein or inconsistent with any recommendation and related infor-
mation and opinions.
Angel Broking Limited and affiliates may seek to provide or have engaged in providing corporate finance, investment banking
or other advisory services in a merger or specific transaction to the companies referred to in this report, as on the date of this
report or in the past.
Sebi Registration No : INB 010996539
For Private Circulation Only | Angel Broking Ltd: BSE Sebi Regn No : INB 010996539 / CDSL Regn No: IN - DP - CDSL - 234 - 2004 / PMS Regn Code: PM/INP00000154 6 Angel Securities Ltd:BSE: INB010994639/INF010994639 NSE: INB230994635/INF230994635 Membership numbers: BSE 028/NSE:09946