Technical Research | November 11, 2011
Daily Technical Report
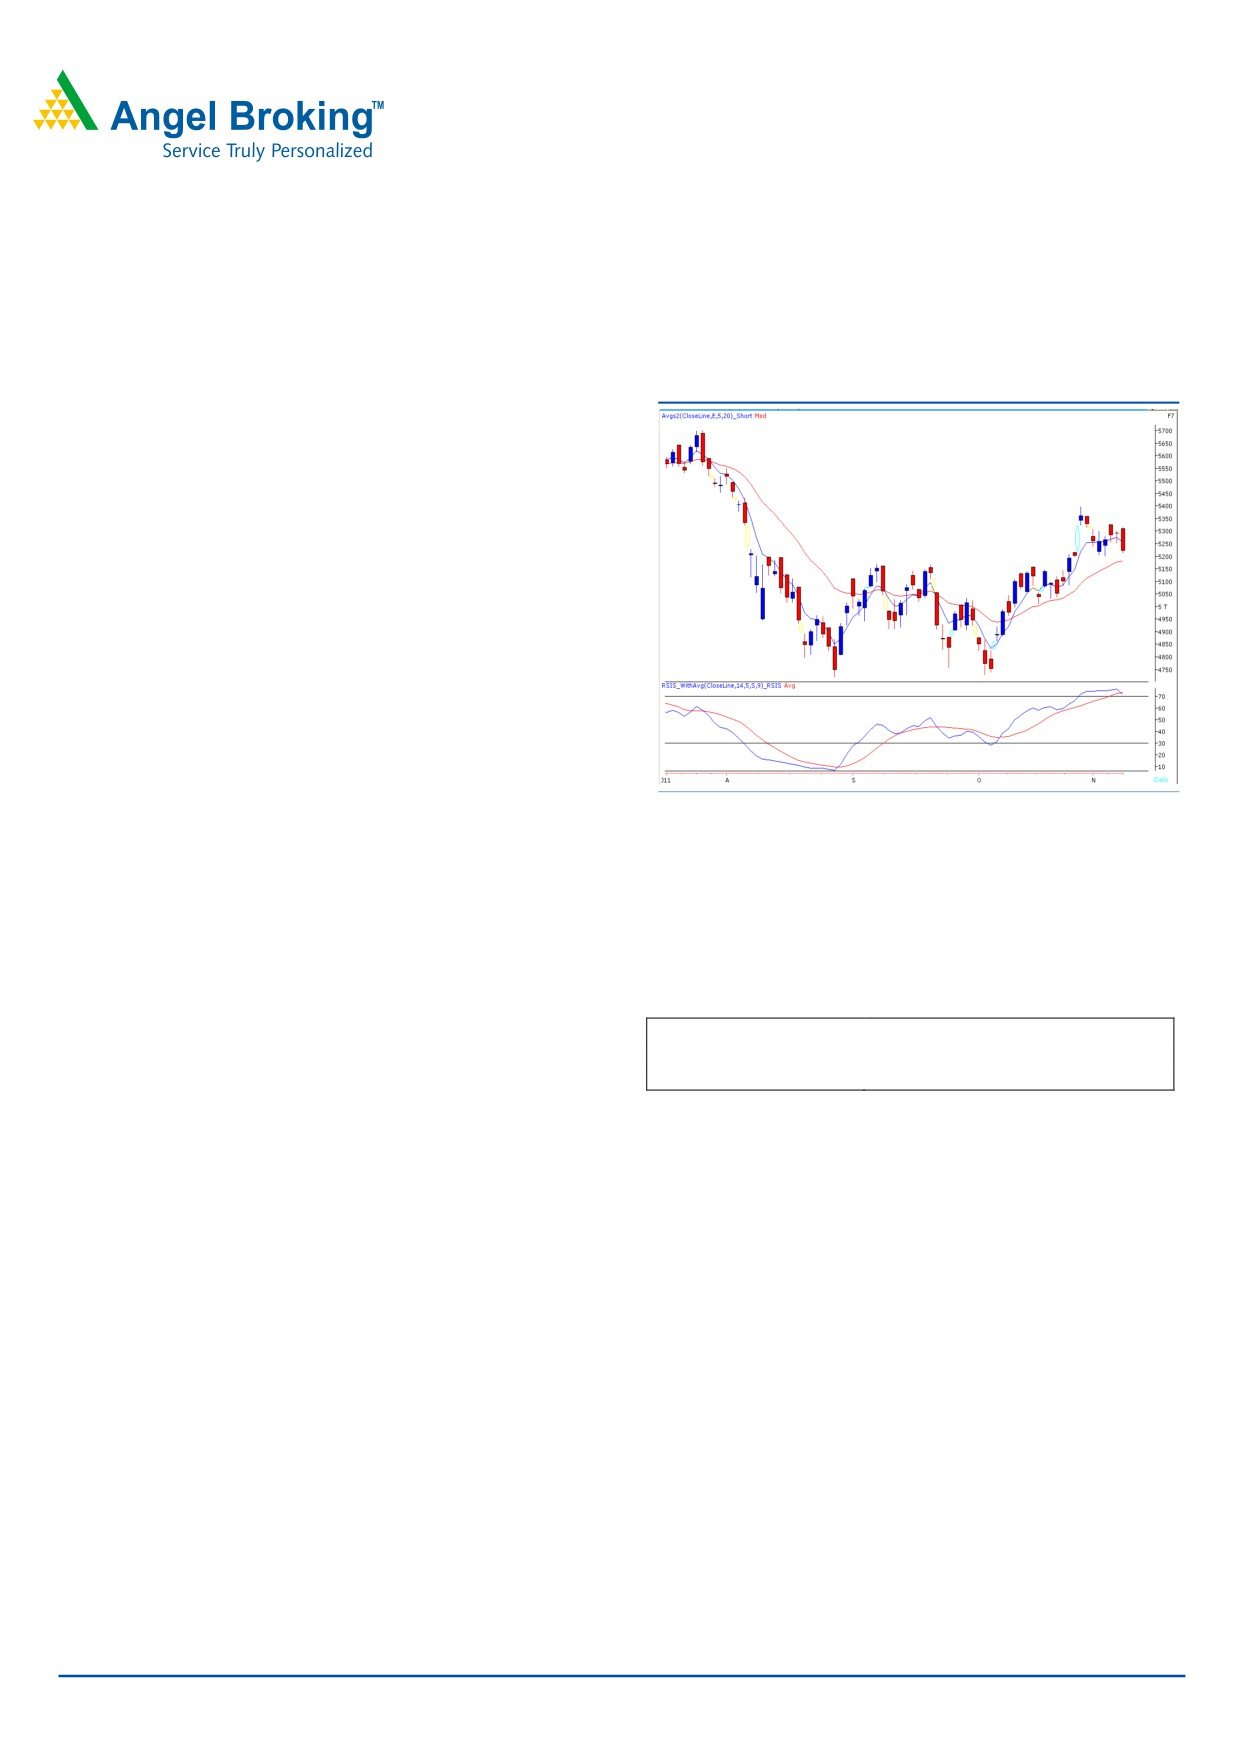
Sensex (17362) / NIFTY (5221)
Exhibit 1: Nifty Daily Chart
On Wednesday, markets opened marginally higher and
traded in a narrow range in the initial part of the session.
Immense selling pressure during the latter part of the day
dragged indices sharply lower to close marginally above the
support level of 17300 / 5200. On the sector front, the
Banking, Metal and Realty counters were among the major
losers in Wednesday’s fall whereas FMCG sector ended on
a positive note. The advance decline ratio was strongly in
favor of declining counters (A=991 D=1879). (Source -
Formation
• The “20 EMA” on the Daily and Weekly chart is placed
at 17165 / 5165 and 17300 / 5200, respectively.
Source: Falcon
• We are observing a negative crossover in “RSI
-
Smoothened” oscillator on Daily chart.
Trading strategy:
Actionable points:
Markets were struggling since last couple of sessions to
cross immediate resistance level of 17702 / 5326. On
View
Neutral
Resistance Levels
5326 - 5365
Wednesday, markets made an attempt but again failed to
Support Levels
5200 - 5160
cross this level and corrected sharply from the day’s high.
Going forward, as mentioned in earlier reports also, 17300
- 17165 / 5200 - 5160 may act as support levels. We are
now observing a negative crossover in daily “RSI
-
Smoothened” oscillator which indicates negativity. A breach
of 17165 / 5160 would attract further selling pressure
which could drag indices to test crucial support levels of
16900 - 16669 / 5085 - 5011. On the upside, 17700 /
5326 level remains to be a strong resistance.
For Private Circulation Only |
1
Technical Research | November 11, 2011
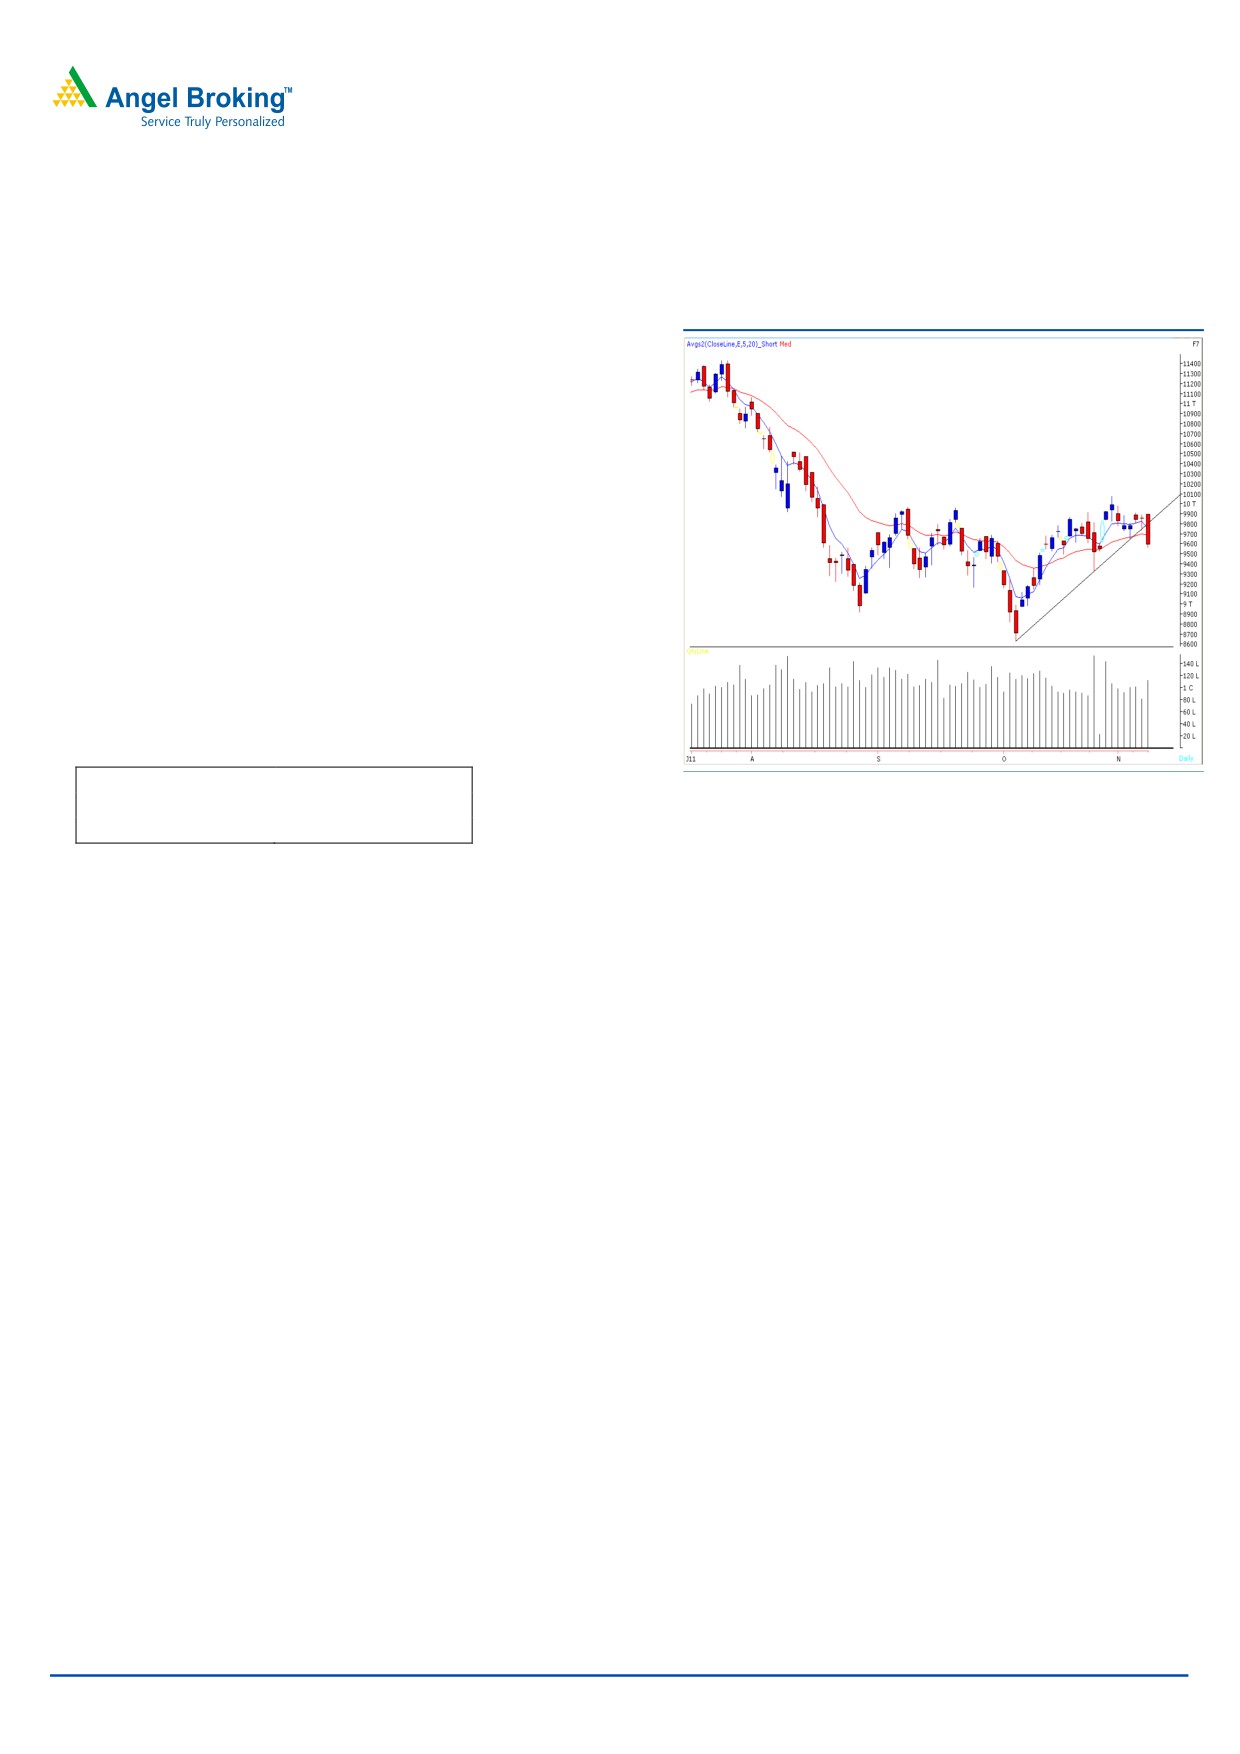
Bank Nifty Outlook - (9593)
Exhibit 2: Bank Nifty Daily Chart
In Wednesday’s session Bank nifty opened near our
mentioned resistance level of 9914 and traded in a narrow
range during first half of the session. During the second half
we witnessed immense selling pressure which led the index
lower and close below both our mentioned support levels.
We are witnessing a trend line breakdown at 9785 level
coupled with negative positioning of the momentum
oscillators on daily chart. If Bank Nifty breaches
Wednesday’s low of 9565 then it is likely to test 9323 -
9166 levels.
On the upside, 9896 - 9914 levels may act as resistance
levels for the day.
Actionable points:
View
Neutral
Source: Falcon
Resistance Levels
9896 - 9914
Support Levels
9323 - 9166
For Private Circulation Only |
2
Technical Research | November 11, 2011
Positive Bias:
Stock Name
5 Day EMA
20 Day EMA
Expected Target
Remarks
HINDUNILVR
383.3
360
410
View will change below 375
Wipro
372.5
363.4
390
View will change below 367
Negative Bias:
Stock Name
5 Day EMA
20 Day EMA
Expected Target
Remarks
Arvind
105.4
104.6
95
View will change above 108.4
DLF
239.5
233.9
220
View will change above 245
SBI
1922.5
1908.2
1830
View will change above 1955
For Private Circulation Only |
3
Technical Research | November 11, 2011
Daily Pivot Levels for Nifty 50 Stocks
SCRIPS
S2
S1
PIVOT
R1
R2
SENSEX
17,123
17,243
17,451
17,570
17,778
NIFTY
5,144
5,183
5,250
5,288
5,356
BANKNIFTY
9,354
9,473
9,685
9,804
10,016
ACC
1,183
1,195
1,211
1,223
1,238
AMBUJACEM
158
160
161
163
164
AXISBANK
1,075
1,094
1,122
1,140
1,169
BAJAJ-AUTO
1,679
1,697
1,722
1,740
1,765
BHARTIARTL
387
391
397
401
406
BHEL
321
325
332
336
343
BPCL
541
555
581
595
621
CAIRN
302
308
316
321
330
CIPLA
284
286
289
292
295
DLF
224
229
236
241
249
DRREDDY
1,581
1,593
1,613
1,625
1,645
GAIL
408
412
418
422
428
HCLTECH
418
422
429
433
440
HDFC
675
679
683
687
691
HDFCBANK
469
473
479
484
490
HEROMOTOCO
2,103
2,121
2,144
2,163
2,186
HINDALCO
128
131
137
140
145
HINDUNILVR
375
384
391
400
407
ICICIBANK
838
850
870
882
902
IDFC
117
120
125
128
133
INFY
2,800
2,818
2,843
2,860
2,885
ITC
208
210
212
214
217
JINDALSTEL
550
559
572
581
594
JPASSOCIAT
77
78
79
79
80
KOTAKBANK
485
489
496
501
508
LT
1,349
1,362
1,381
1,394
1,413
M&M
791
802
821
832
851
MARUTI
1,035
1,056
1,092
1,113
1,150
NTPC
170
172
176
178
181
ONGC
265
268
274
277
283
PNB
943
955
970
981
996
POWERGRID
103
103
104
104
105
RANBAXY
454
465
480
490
505
RCOM
80
82
85
87
90
RELCAPITAL
339
349
366
376
392
RELIANCE
841
853
873
885
904
RELINFRA
449
459
475
485
501
RPOWER
100
101
104
105
108
SAIL
103
105
108
110
113
SBIN
1,745
1,804
1,911
1,969
2,076
SESAGOA
200
204
209
212
217
SIEMENS
809
820
837
848
865
STER
115
118
121
124
128
SUNPHARMA
482
486
493
497
504
SUZLON
34
35
36
37
38
TATAMOTORS
179
182
187
190
195
TATAPOWER
100
101
103
104
105
TATASTEEL
424
436
456
467
487
TCS
1,085
1,104
1,125
1,144
1,165
WIPRO
364
370
375
382
387
Technical Research Team
For Private Circulation Only |
4
Technical Report
RESEARCH TEAM
Shardul Kulkarni
Head - Technicals
Sameet Chavan
Technical Analyst
Sacchitanand Uttekar
Technical Analyst
Mehul Kothari
Technical Analyst
Ankur Lakhotia
Technical Analyst
Research Team: 022-3952 6600
DISCLAIMER: This document is not for public distribution and has been furnished to you solely for your information and must not
be reproduced or redistributed to any other person. Persons into whose possession this document may come are required to observe
these restrictions.
Opinion expressed is our current opinion as of the date appearing on this material only. While we endeavor to update on a
reasonable basis the information discussed in this material, there may be regulatory, compliance, or other reasons that prevent us
from doing so. Prospective investors and others are cautioned that any forward-looking statements are not predictions and may be
subject to change without notice. Our proprietary trading and investment businesses may make investment decisions that are
inconsistent with the recommendations expressed herein.
The information in this document has been printed on the basis of publicly available information, internal data and other reliable
sources believed to be true and are for general guidance only. While every effort is made to ensure the accuracy and completeness of
information contained, the company takes no guarantee and assumes no liability for any errors or omissions of the information. No
one can use the information as the basis for any claim, demand or cause of action.
Recipients of this material should rely on their own investigations and take their own professional advice. Each recipient of this
document should make such investigations as it deems necessary to arrive at an independent evaluation of an investment in the
securities of companies referred to in this document (including the merits and risks involved), and should consult their own advisors to
determine the merits and risks of such an investment. Price and value of the investments referred to in this material may go up or
down. Past performance is not a guide for future performance. Certain transactions - futures, options and other derivatives as well as
non-investment grade securities - involve substantial risks and are not suitable for all investors. Reports based on technical analysis
centers on studying charts of a stock's price movement and trading volume, as opposed to focusing on a company's fundamentals
and as such, may not match with a report on a company's fundamentals.
We do not undertake to advise you as to any change of our views expressed in this document. While we would endeavor to update
the information herein on a reasonable basis, Angel Broking, its subsidiaries and associated companies, their directors and
employees are under no obligation to update or keep the information current. Also there may be regulatory, compliance, or other
reasons that may prevent Angel Broking and affiliates from doing so. Prospective investors and others are cautioned that any
forward-looking statements are not predictions and may be subject to change without notice.
Angel Broking Limited and affiliates, including the analyst who has issued this report, may, on the date of this report, and from time
to time, have long or short positions in, and buy or sell the securities of the companies mentioned herein or engage in any other
transaction involving such securities and earn brokerage or compensation or act as advisor or have other potential conflict of interest
with respect to company/ies mentioned herein or inconsistent with any recommendation and related information and opinions.
Angel Broking Limited and affiliates may seek to provide or have engaged in providing corporate finance, investment banking or
other advisory services in a merger or specific transaction to the companies referred to in this report, as on the date of this report or
in the past.
Sebi Registration No: INB 010996539
For Private Circulation Only |