Technical Research | November 08, 2011
Daily Technical Report
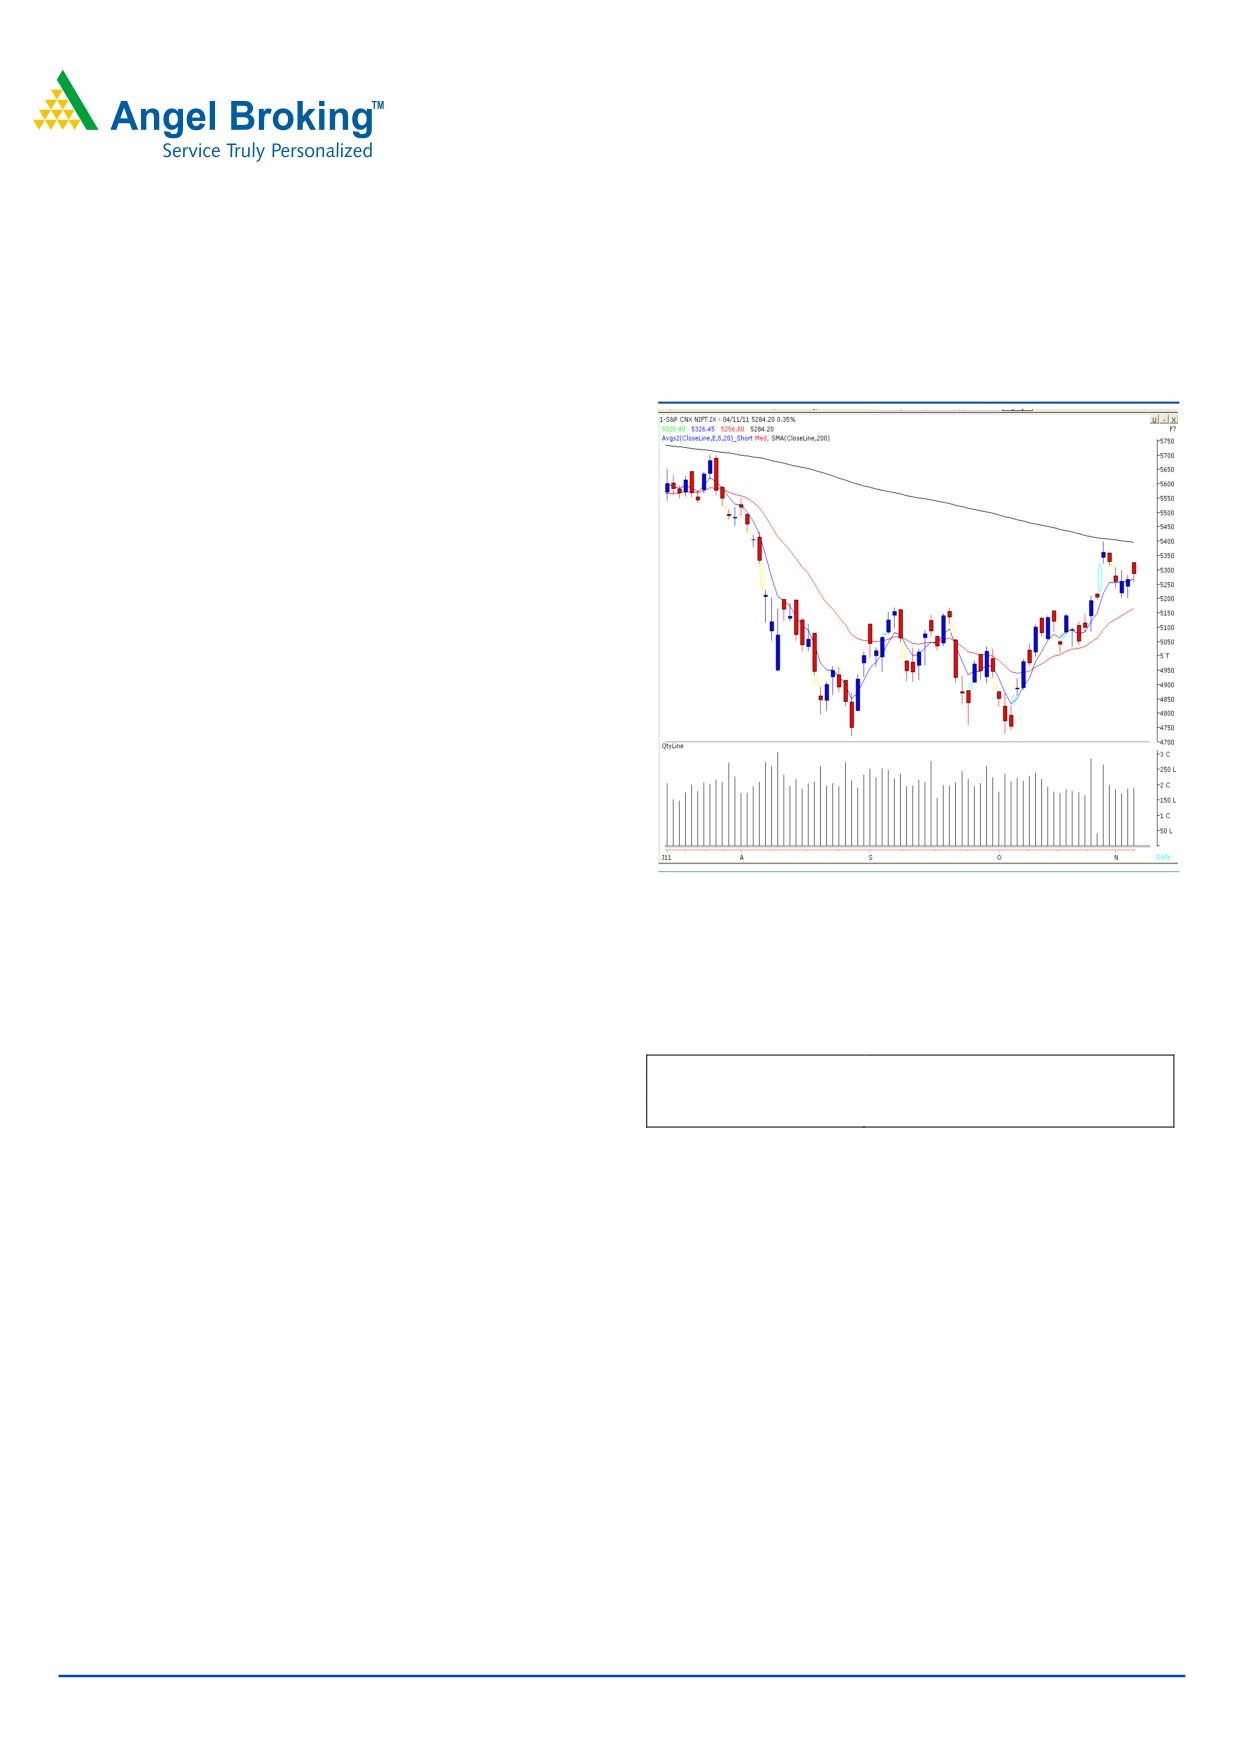
Sensex (17563) / NIFTY (5284)
Exhibit 1: Nifty Daily Chart
We witnessed a gap up opening on Friday’s session due to
strong overnight cues from US and European markets.
However, the selling pressure near day’s high dragged
indices lower to close marginally below 17600 / 5300
mark. On the sectoral front, the Metal, Capital Goods and
Realty counters were among the major gainers whereas Oil
& Gas sector ended with a nominal loss. The advance
decline ratio was strongly in favor of advancing counters
Formation
• On the Weekly chart, the “Downward Sloping Trend
Line” is now placed around the 18100 / 5450 level.
• The Daily “200 SMA” is placed at 18000 / 5400 level.
• The “20 EMA” on the Daily and Weekly chart is placed
at 17165 / 5165 and 17300 / 5200, respectively.
Source: Falcon
• The positive crossover in the Weekly ADX (9) indicator is
still intact.
Actionable points:
Trading strategy:
Going forward, indices are likely to face resistance near the
View
Neutral
“Downward Sloping Trend Line” level of 18100 / 5450 and
Resistance Levels
5400 - 5450
“200-Day SMA” which is placed at 18000 / 5400 level.
Support Levels
5200 - 5160
However, the impact of positive crossover in the Weekly
Broadly speaking, indices are trading in the range of 18100
ADX (9) indicator would come into action if indices manage
to 17165 / 5450 to 5160. A breakout from this range on
to break the 18100 / 5450 level. In this scenario, we may
either side would set the direction for our benchmark
witness a strong buying interest, which would push indices
indices.
higher to test the next resistance level of 18300 - 18440 /
Therefore, we reiterate our view that traders should stay
5500 - 5550. On the downside, our benchmark indices
light on positions and continue to adopt a stock - specific
have a decent support in the range of 17300 - 17165 /
approach.
5200 - 5160. These levels coincide with the “20 EMA” on
the Weekly as well as Daily chart. A breach of 17165 /
5160 level may attract selling pressure, which may then
drag indices lower to test crucial support levels of 16900 -
16669 / 5085 - 5011.
For Private Circulation Only |
1
Technical Research | November 08, 2011
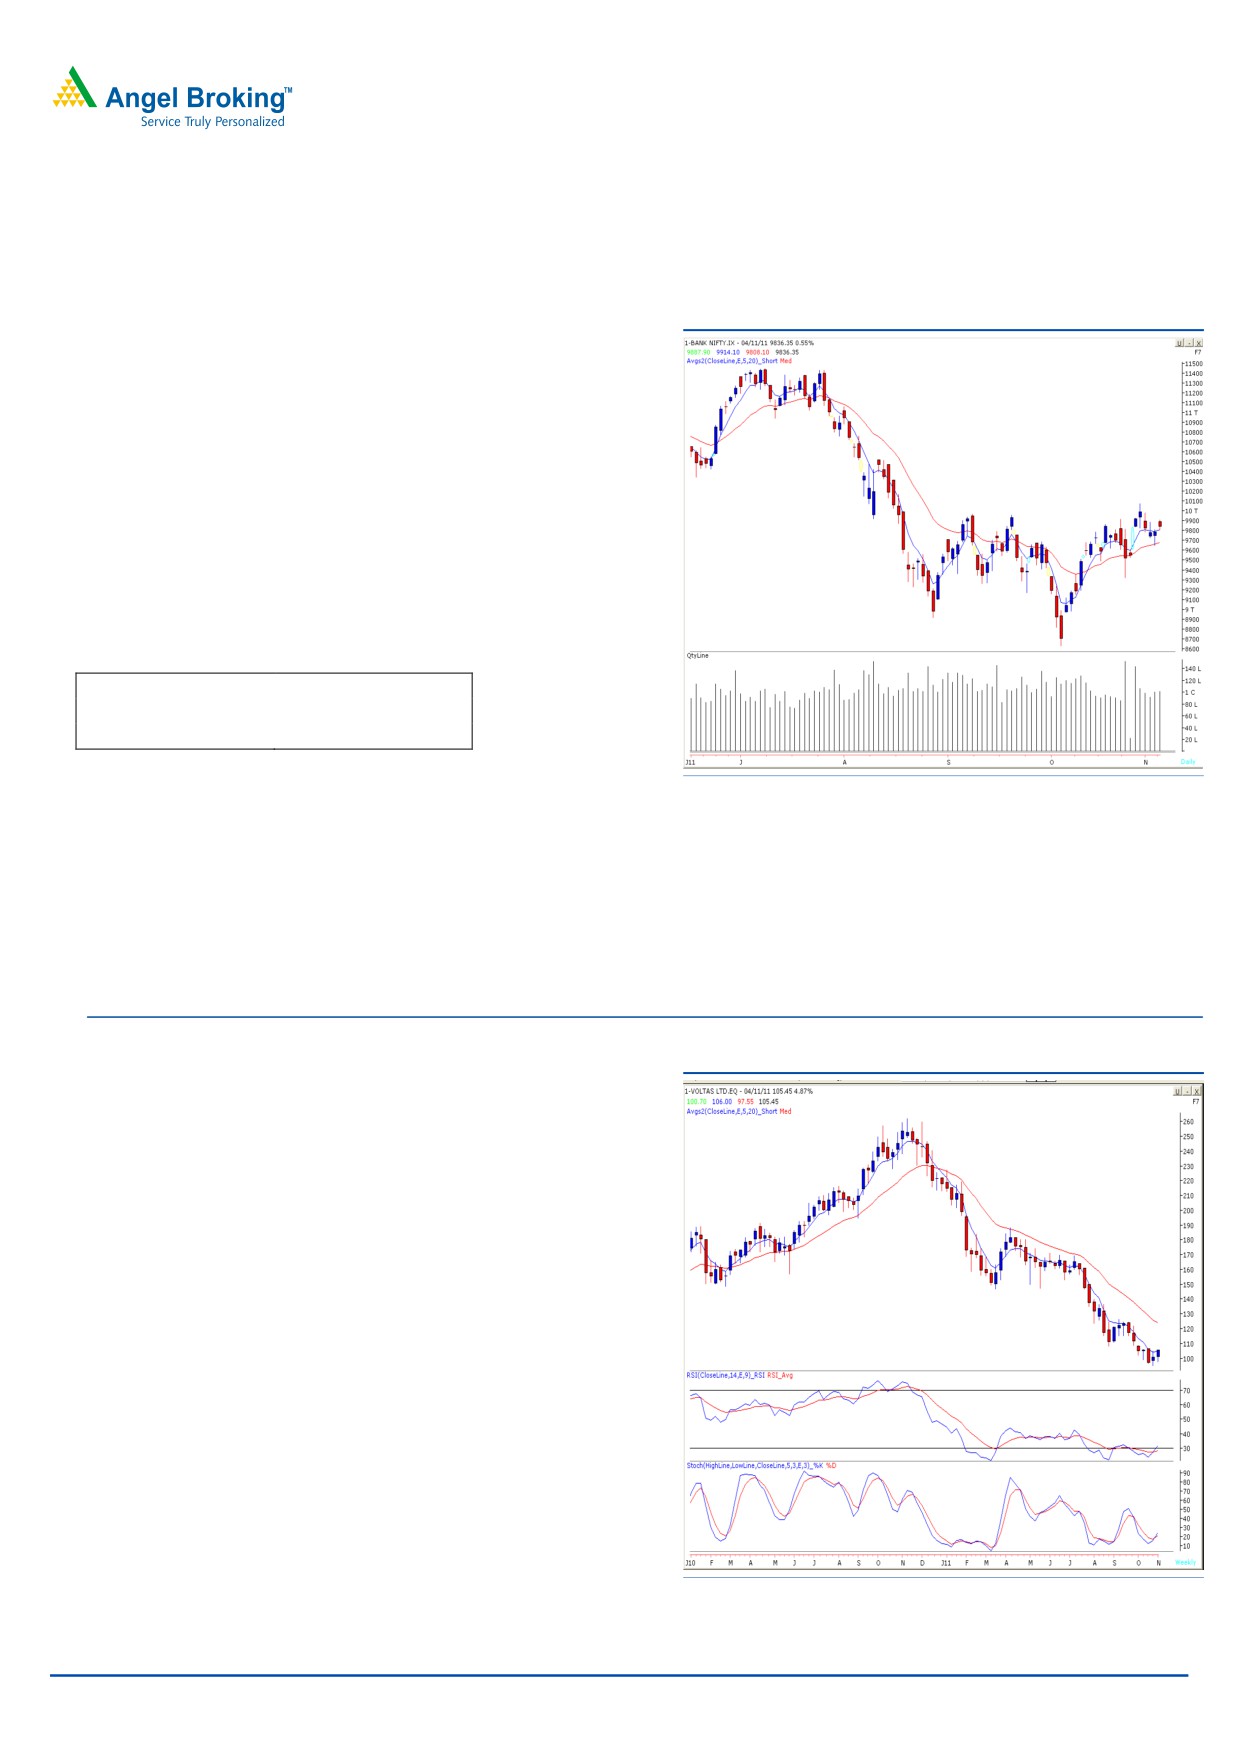
Bank Nifty Outlook - (9836)
Exhibit 2: Bank Nifty Daily Chart
Bank nifty opened with a minor upside gap and tested our
mentioned resistance level of 9890. The selling pressure
near day’s high dragged index lower to close marginally
below 9800 mark. We are now witnessing a narrow range
body formation, which is a sign of indecisiveness at current
levels. Only a sustainable move above Friday’s high of 9914
may push the index to test the next resistance level of 10080.
On the downside, 9647- 9500 levels may act as support
levels for the day.
Actionable points:
View
Neutral
Resistance Level
9914
Support Levels
9647 - 9500
Source: Falcon
Stock Recommendations:
Exhibit 3:Voltas (NSE Cash) Weekly chart
Stock - Voltas (NSE Cash)
Action - Buy
Last close - ` 105.45
Buying Range - ` 105.50 - ` 101.50
Stop Loss - ` 98
Target
- ` 115
Justification - The stock has given a confirmation of “Bullish
Harami” Japanese candlestick pattern on weekly chart
which is a price reversal pattern. We are also witnessing a
positive crossover in momentum oscillator’s viz. the RSI and
the Stochastic. Buy this stock in a range of `105.50 -
`101.50 for a target of `115 in coming 2-3 weeks.
Source: Falcon
For Private Circulation Only |
2
Technical Research | November 08, 2011
Positive Bias:
Stock Name
5 Day EMA
20 Day EMA
Expected Target
Remarks
BF Utilities
493.8
478.5
530
View will change below 482
Delta Corp
98.7
99.4
107
View will change below 95.5
Voltas
101.4
102.2
114
View will change below 98
Negative Bias:
Stock Name
5 Day EMA
20 Day EMA
Expected Target
Remarks
Bombay Dyeing
419
404
380
View will change above 437
Ranbaxy
508.5
506.7
485
View will change above 518
For Private Circulation Only |
3
Technical Research | November 08, 2011
Daily Pivot Levels for Nifty 50 Stocks
SCRIPS
S2
S1
PIVOT
R1
R2
SENSEX
17,352
17,457
17,580
17,685
17,808
NIFTY
5,220
5,252
5,289
5,322
5,359
BANKNIFTY
9,747
9,792
9,853
9,898
9,959
ACC
1,200
1,212
1,222
1,233
1,243
AMBUJACEM
155
158
160
163
165
AXISBANK
1,111
1,120
1,132
1,141
1,154
BAJAJ-AUTO
1,682
1,713
1,741
1,773
1,801
BHARTIARTL
379
388
394
404
410
BHEL
328
331
335
338
342
BPCL
608
616
629
637
650
CAIRN
297
302
305
310
313
CIPLA
290
292
293
295
297
DLF
241
244
248
251
255
DRREDDY
1,563
1,593
1,624
1,653
1,684
GAIL
415
420
425
430
435
HCLTECH
430
434
440
445
451
HDFC
672
678
684
690
695
HDFCBANK
476
480
484
487
491
HEROMOTOCO
2,062
2,088
2,111
2,137
2,159
HINDALCO
136
138
139
140
141
HINDUNILVR
373
376
380
383
387
ICICIBANK
872
878
885
891
898
IDFC
126
127
130
131
133
INFY
2,763
2,795
2,823
2,854
2,882
ITC
209
210
211
211
213
JINDALSTEL
562
570
576
584
590
JPASSOCIAT
78
78
79
80
81
KOTAKBANK
491
497
503
509
515
LT
1,376
1,385
1,395
1,404
1,415
M&M
821
829
839
847
858
MARUTI
1,095
1,109
1,131
1,144
1,166
NTPC
176
178
180
181
183
ONGC
271
274
279
282
287
PNB
958
968
985
996
1,013
POWERGRID
102
103
104
105
106
RANBAXY
491
498
509
515
526
RCOM
81
82
84
85
86
RELCAPITAL
364
369
375
380
386
RELIANCE
854
867
886
899
918
RELINFRA
431
444
459
472
487
RPOWER
97
99
100
101
102
SAIL
109
110
111
112
113
SBIN
1,939
1,953
1,967
1,980
1,995
SESAGOA
203
207
212
215
220
SIEMENS
848
855
862
869
876
STER
120
121
124
125
127
SUNPHARMA
501
507
511
517
521
SUZLON
36
37
37
37
38
TATAMOTORS
181
185
189
193
197
TATAPOWER
101
102
104
105
107
TATASTEEL
458
463
470
474
481
TCS
1,066
1,083
1,104
1,121
1,142
WIPRO
364
368
372
376
381
Technical Research Team
For Private Circulation Only |
4
Technical Report
RESEARCH TEAM
Shardul Kulkarni
Head - Technicals
Sameet Chavan
Technical Analyst
Sacchitanand Uttekar
Technical Analyst
Mehul Kothari
Technical Analyst
Ankur Lakhotia
Technical Analyst
Research Team: 022-3952 6600
DISCLAIMER: This document is not for public distribution and has been furnished to you solely for your information and must not
be reproduced or redistributed to any other person. Persons into whose possession this document may come are required to observe
these restrictions.
Opinion expressed is our current opinion as of the date appearing on this material only. While we endeavor to update on a
reasonable basis the information discussed in this material, there may be regulatory, compliance, or other reasons that prevent us
from doing so. Prospective investors and others are cautioned that any forward-looking statements are not predictions and may be
subject to change without notice. Our proprietary trading and investment businesses may make investment decisions that are
inconsistent with the recommendations expressed herein.
The information in this document has been printed on the basis of publicly available information, internal data and other reliable
sources believed to be true and are for general guidance only. While every effort is made to ensure the accuracy and completeness of
information contained, the company takes no guarantee and assumes no liability for any errors or omissions of the information. No
one can use the information as the basis for any claim, demand or cause of action.
Recipients of this material should rely on their own investigations and take their own professional advice. Each recipient of this
document should make such investigations as it deems necessary to arrive at an independent evaluation of an investment in the
securities of companies referred to in this document (including the merits and risks involved), and should consult their own advisors to
determine the merits and risks of such an investment. Price and value of the investments referred to in this material may go up or
down. Past performance is not a guide for future performance. Certain transactions - futures, options and other derivatives as well as
non-investment grade securities - involve substantial risks and are not suitable for all investors. Reports based on technical analysis
centers on studying charts of a stock's price movement and trading volume, as opposed to focusing on a company's fundamentals
and as such, may not match with a report on a company's fundamentals.
We do not undertake to advise you as to any change of our views expressed in this document. While we would endeavor to update
the information herein on a reasonable basis, Angel Broking, its subsidiaries and associated companies, their directors and
employees are under no obligation to update or keep the information current. Also there may be regulatory, compliance, or other
reasons that may prevent Angel Broking and affiliates from doing so. Prospective investors and others are cautioned that any
forward-looking statements are not predictions and may be subject to change without notice.
Angel Broking Limited and affiliates, including the analyst who has issued this report, may, on the date of this report, and from time
to time, have long or short positions in, and buy or sell the securities of the companies mentioned herein or engage in any other
transaction involving such securities and earn brokerage or compensation or act as advisor or have other potential conflict of interest
with respect to company/ies mentioned herein or inconsistent with any recommendation and related information and opinions.
Angel Broking Limited and affiliates may seek to provide or have engaged in providing corporate finance, investment banking or
other advisory services in a merger or specific transaction to the companies referred to in this report, as on the date of this report or
in the past.
Sebi Registration No: INB 010996539
For Private Circulation Only |