Technical Research | August 8, 2011
Daily Technical Report
Sensex (17306) / NIFTY (5211)
Markets opened with a massive downside gap of more than
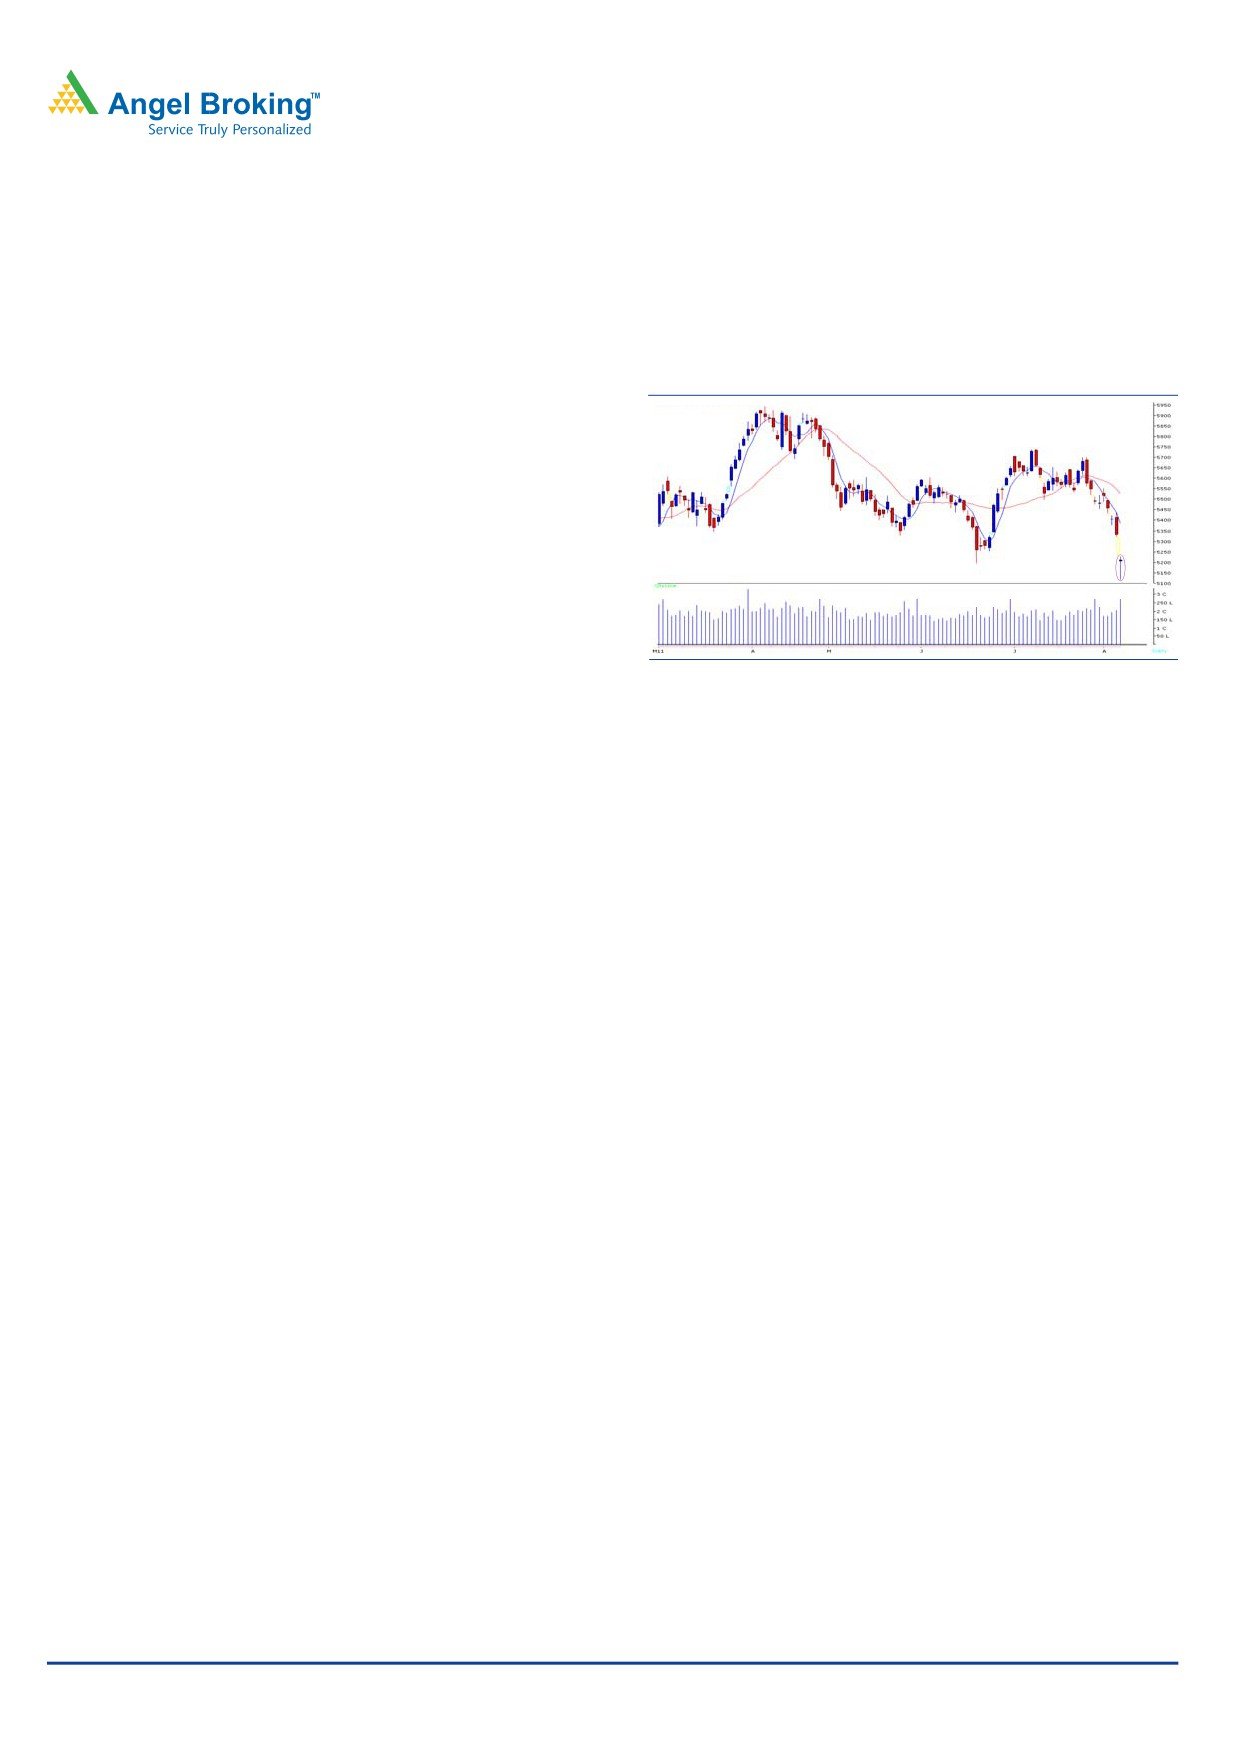
Exhibit 1: Sensex Daily Chart
2% on Friday's session mainly due to a sell-off in the Global
indices to give a Weekly close well below its intraday supports.
On the sector front, IT, Teck and Realty were among the major
losers. The advance decline ratio was in favor of declining
Bullish Hammer
Formation
We are witnessing a Weekly close below 5300 level
after nearly 11 months (Last weekly close below 5300 was on
Source: Falcon
July 2, 2010).
to open down by more than 2% and close well below 5300
The ADX (14) indicator on the Weekly chart is showing
after nearly a year. On the positive side, looking at the "Bullish
some possibility of a further weakness in the coming weeks.
Hammer" on the Daily chart, there is a possibility of a bounce
The - DI (negative directional index) is moving upwards
during the initial part of the week if indices manage to cross
supported by the ADX line, which is around 19-20 level. The
Friday's high of 17358 / 5230. In such a scenario, they may
ADX rising from 15 to 25 from lower levels indicates that the
test 17500 - 17750 / 5260 - 5345 levels. On the downside, if
trend is strengthening. The ADX line moving above the 25 level
Friday's low of 19991 / 5116 is breached after a consolidation
along with - DI is a sign of negative momentum accelerating in
or a minor bounce, then strong negative momentum is likely to
the coming weeks.
be witnessed in the coming trading sessions, which can drag
indices to lower levels of 16750 - 16650 / 5050 - 4950. In a
The Daily chart depicts a "Bullish Hammer", which requires
worse-case scenario, if our markets fail to hold these support
a confirmation.
levels, then they may test 16000 / 4800 level.
Trading strategy:
We advise traders to stay light on their positions and trade
Our Benchmark indices opened marginally higher during the
with proper stop losses. Investors can use the dip towards 4800
initial part of the week but could not sustain at higher levels.
to enter (partial buying advised) in counters with strong
This was mainly due to financial uncertainties across global
fundamentals and good long-term prospects.
markets, which dampened the sentiments during the week. On
Friday's session, a huge sell-off in global indices led our markets
For Private Circulation Only | Angel Broking Ltd: BSE Sebi Regn No : INB 010996539 / CDSL Regn No: IN - DP - CDSL - 234 - 2004 / PMS Regn Code: PM/INP00000154 6 Angel Securities Ltd:BSE: INB010994639/INF010994639 NSE: INB230994635/INF230994635 Membership numbers: BSE 028/NSE:09946
1
Technical Report
RESEARCH TEAM
Shardul Kulkarni
Head - Technicals
Sameet Chavan
Technical Analyst
Sacchitanand Uttekar
Technical Analyst
Mehul Kothari
Technical Analyst
Research Team: 022-3952 6600
DISCLAIMER: This document is not for public distribution and has been furnished to you solely for your information and must
not be reproduced or redistributed to any other person. Persons into whose possession this document may come are required
to observe these restrictions.
Opinion expressed is our current opinion as of the date appearing on this material only. While we endeavor to update on a
reasonable basis the information discussed in this material, there may be regulatory, compliance, or other reasons that prevent
us from doing so. Prospective investors and others are cautioned that any forward-looking statements are not predictions and
may be subject to change without notice. Our proprietary trading and investment businesses may make investment decisions
that are inconsistent with the recommendations expressed herein.
The information in this document has been printed on the basis of publicly available information, internal data and other
reliable sources believed to be true and are for general guidance only. While every effort is made to ensure the accuracy and
completeness of information contained, the company takes no guarantee and assumes no liability for any errors or omissions
of the information. No one can use the information as the basis for any claim, demand or cause of action.
Recipients of this material should rely on their own investigations and take their own professional advice. Each recipient of this
document should make such investigations as it deems necessary to arrive at an independent evaluation of an investment in the
securities of companies referred to in this document (including the merits and risks involved), and should consult their own
advisors to determine the merits and risks of such an investment. Price and value of the investments referred to in this material
may go up or down. Past performance is not a guide for future performance. Certain transactions - futures, options and other
derivatives as well as non-investment grade securities - involve substantial risks and are not suitable for all investors. Reports
based on technical analysis centers on studying charts of a stock's price movement and trading volume, as opposed to focusing
on a company's fundamentals and as such, may not match with a report on a company's fundamentals.
We do not undertake to advise you as to any change of our views expressed in this document. While we would endeavor to
update the information herein on a reasonable basis, Angel Broking, its subsidiaries and associated companies, their directors
and employees are under no obligation to update or keep the information current. Also there may be regulatory, compliance,
or other reasons that may prevent Angel Broking and affiliates from doing so. Prospective investors and others are cautioned
that any forward-looking statements are not predictions and may be subject to change without notice.
Angel Broking Limited and affiliates, including the analyst who has issued this report, may, on the date of this report, and from
time to time, have long or short positions in, and buy or sell the securities of the companies mentioned herein or engage in any
other transaction involving such securities and earn brokerage or compensation or act as advisor or have other potential
conflict of interest with respect to company/ies mentioned herein or inconsistent with any recommendation and related infor-
mation and opinions.
Angel Broking Limited and affiliates may seek to provide or have engaged in providing corporate finance, investment banking
or other advisory services in a merger or specific transaction to the companies referred to in this report, as on the date of this
report or in the past.
Sebi Registration No : INB 010996539
For Private Circulation Only | Angel Broking Ltd: BSE Sebi Regn No : INB 010996539 / CDSL Regn No: IN - DP - CDSL - 234 - 2004 / PMS Regn Code: PM/INP00000154 6 Angel Securities Ltd:BSE: INB010994639/INF010994639 NSE: INB230994635/INF230994635 Membership numbers: BSE 028/NSE:09946