Technical Research | November 03, 2011
Daily Technical Report
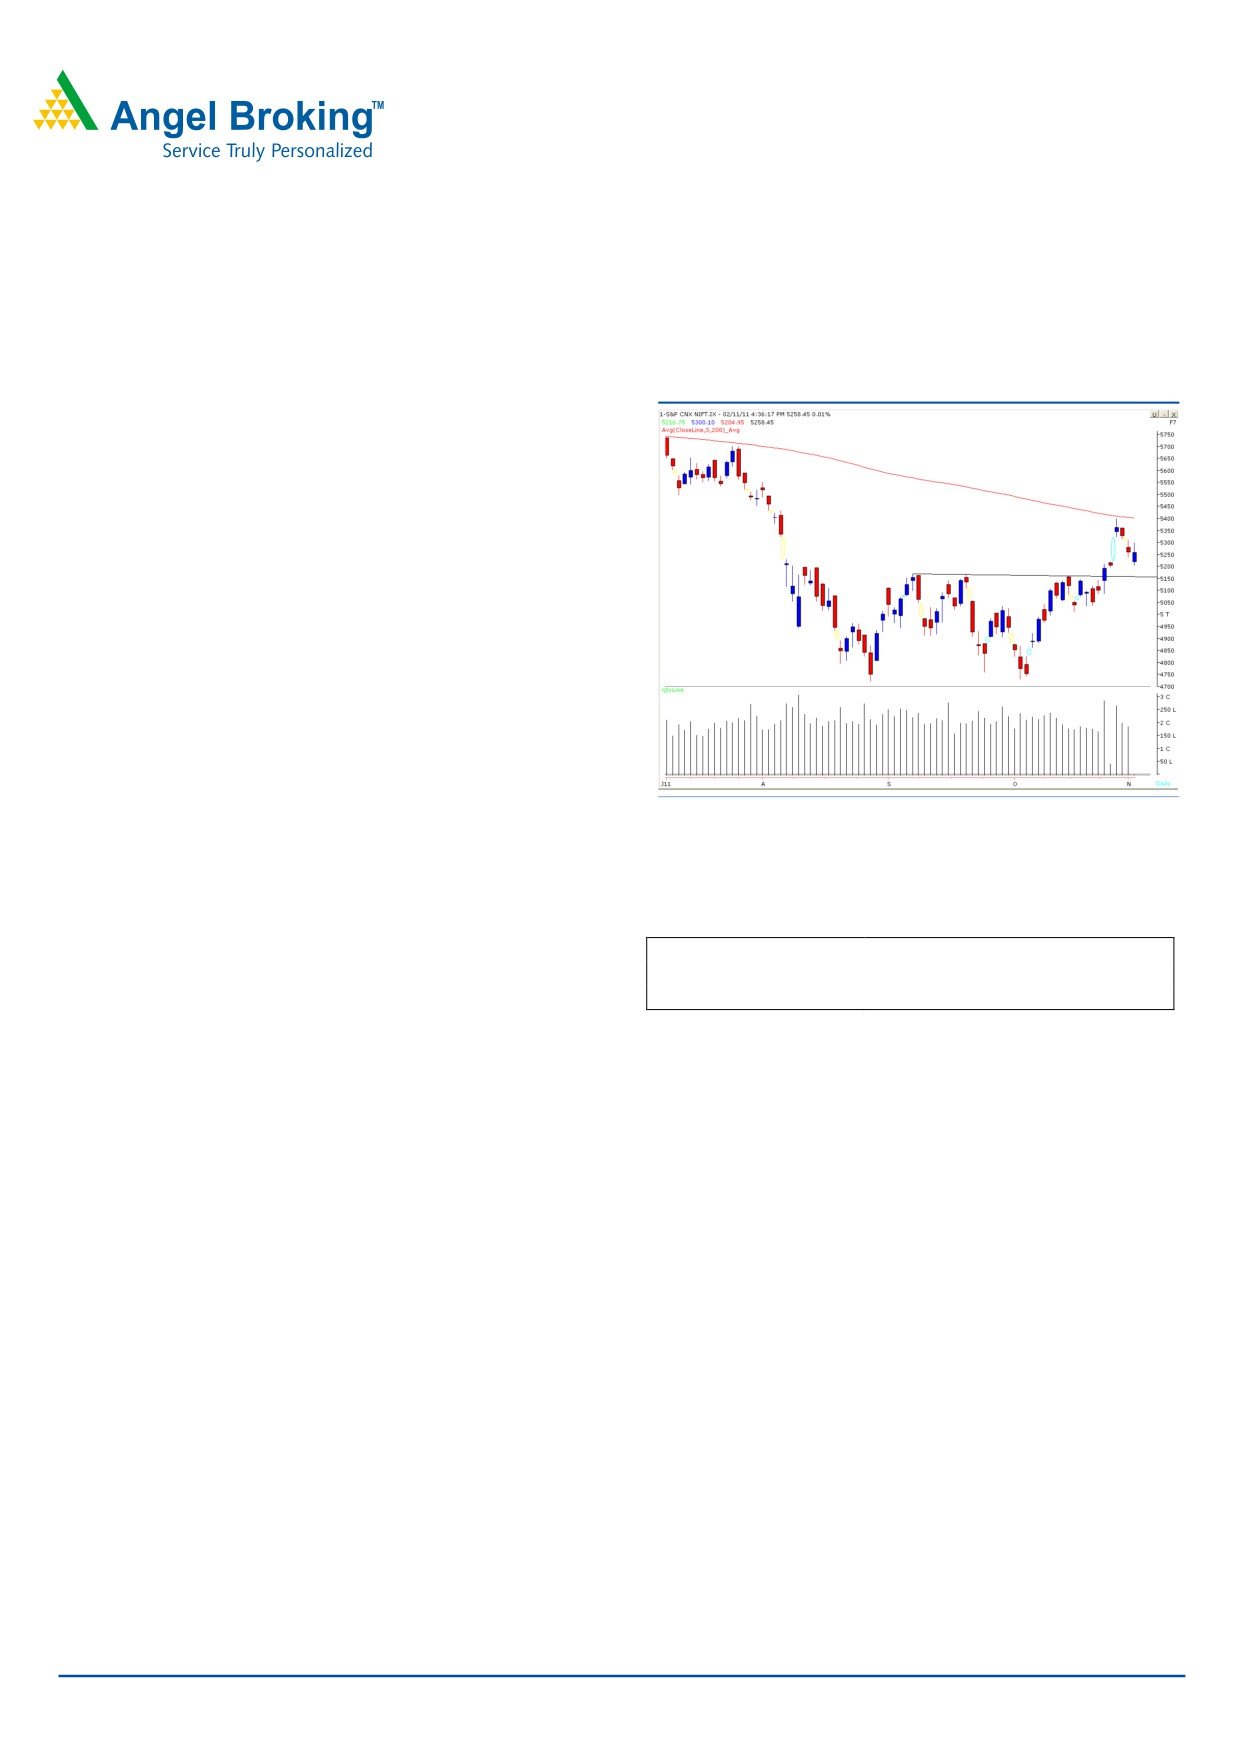
Sensex (17465) / NIFTY (5258)
Exhibit 1: Nifty Daily Chart
Indices opened lower for the second consecutive session
and bounced sharply from the day’s low. However, selling
pressure intensified during the last hour of trade which
dragged indices lower to close on a flat note. On the sector
front, Oil & Gas and Health Care counters ended
marginally in the positive territory whereas Auto and
Banking sectors ended with a nominal loss. The advance
decline ratio was in favor of declining counters (A=1359
Formation
• The Daily “200 SMA” is placed at the 18020 / 5410
level.
Source: Falcon
Trading strategy:
Actionable points:
Yesterday’s session also opened on a pessimistic note due
to increasing financial uncertainty across global markets.
View
Neutral
However, indices managed to hold the key support level of
Resistance Levels
5300 - 5366
17273 / 5196 and bounced sharply from day’s low. Going
Support Levels
5196 - 5160
forward, yesterday’s high of 17616 / 5300 may act as
strong resistance level. If indices manage to sustain above
this level then they are likely to rally towards 17671 -
17821 / 5322 - 5366 levels. On the downside, 17273 -
17188 / 5196 - 5160 levels remain to act as a strong
support zone in coming trading session.
For Private Circulation Only |
1
Technical Research | November 03, 2011
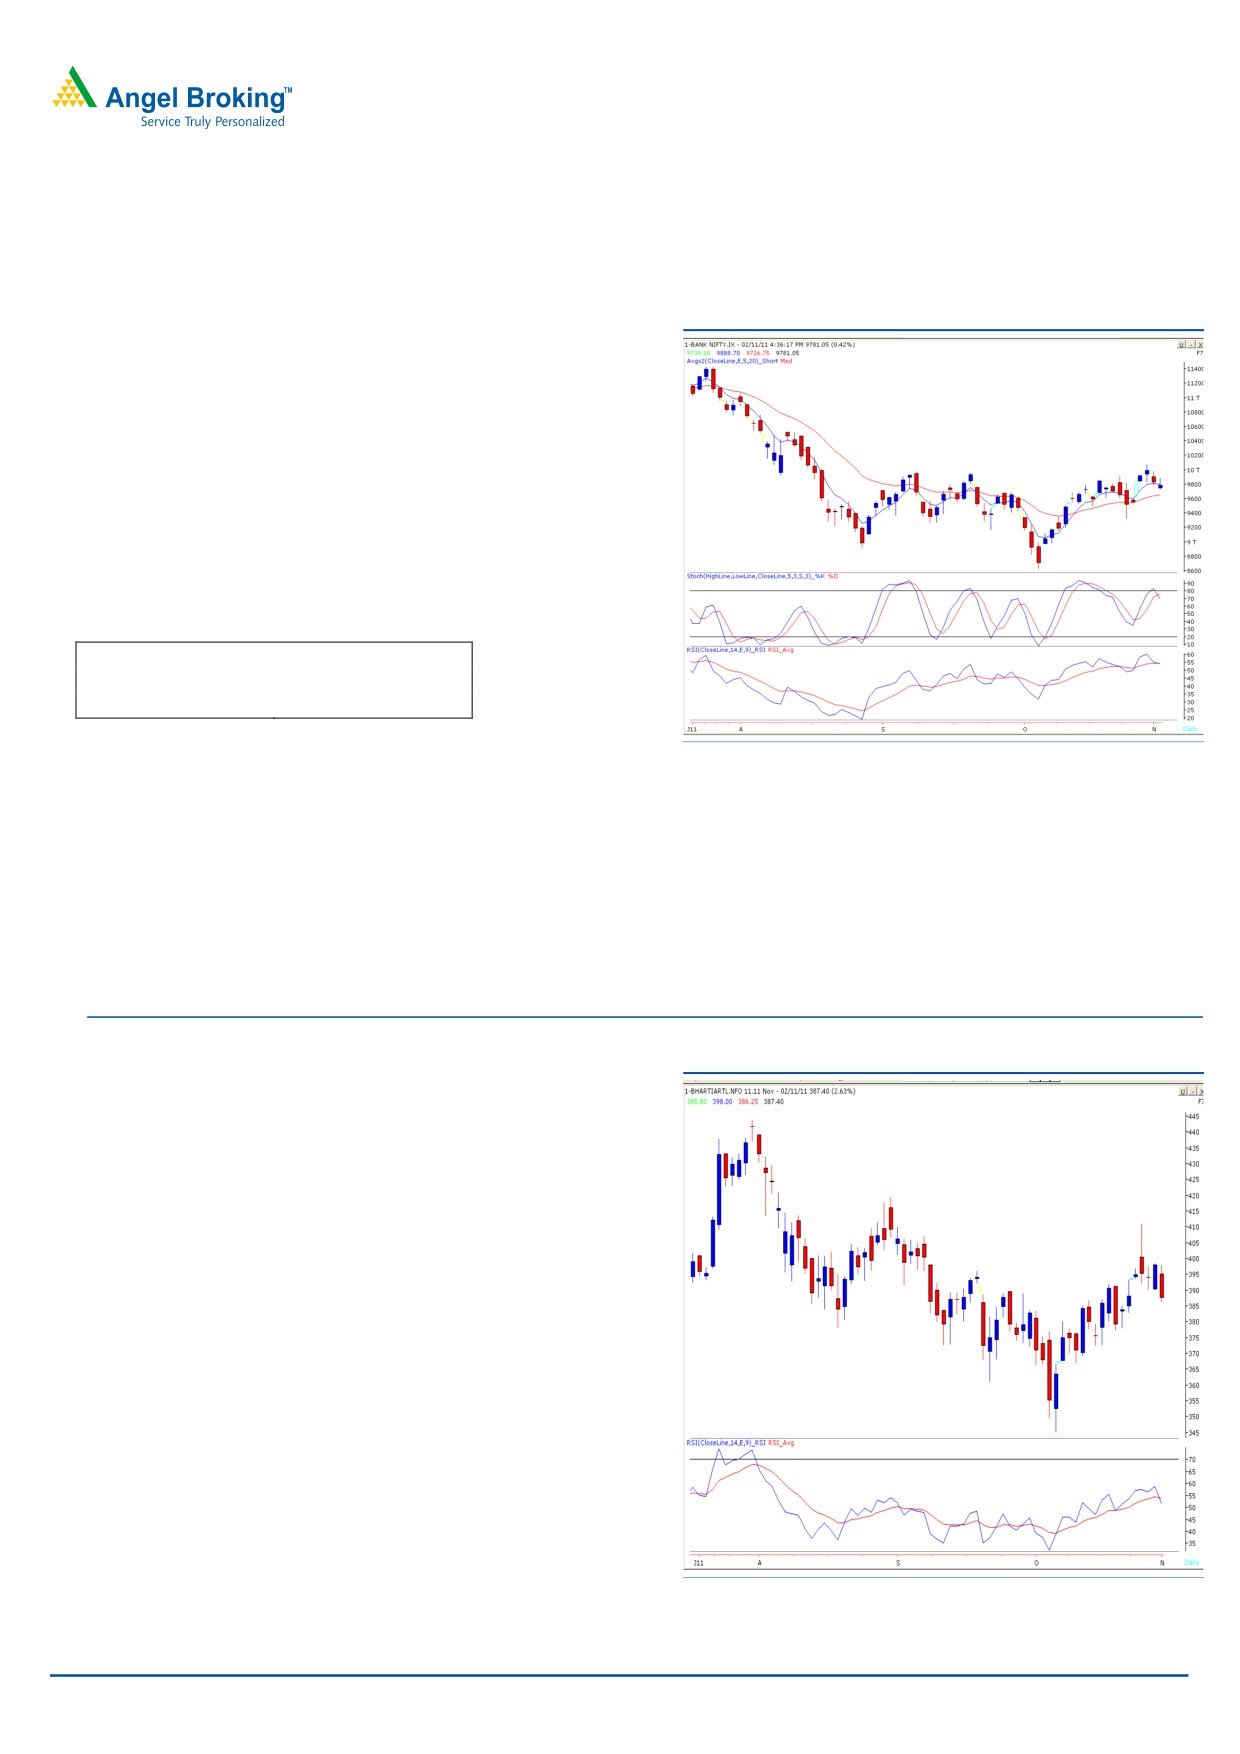
Bank Nifty Outlook - (9781)
Exhibit 2: Bank Nifty Daily Chart
Bank nifty opened with a negative bias and traded with
extreme volatility throughout the session. We are witnessing
a negative crossover in momentum oscillators. As a result if
Bank Nifty sustains below yesterday’s low of 9727, it is likely
to drift towards the multiple support zone of 9607- 9500
levels.
On the upside, 9890 - 10080 levels may act as resistance
level for the day.
Actionable points:
View
Neutral
Resistance Levels
9890 - 10080
Support Levels
9607 - 9500
Source: Falcon
Stock Recommendations:
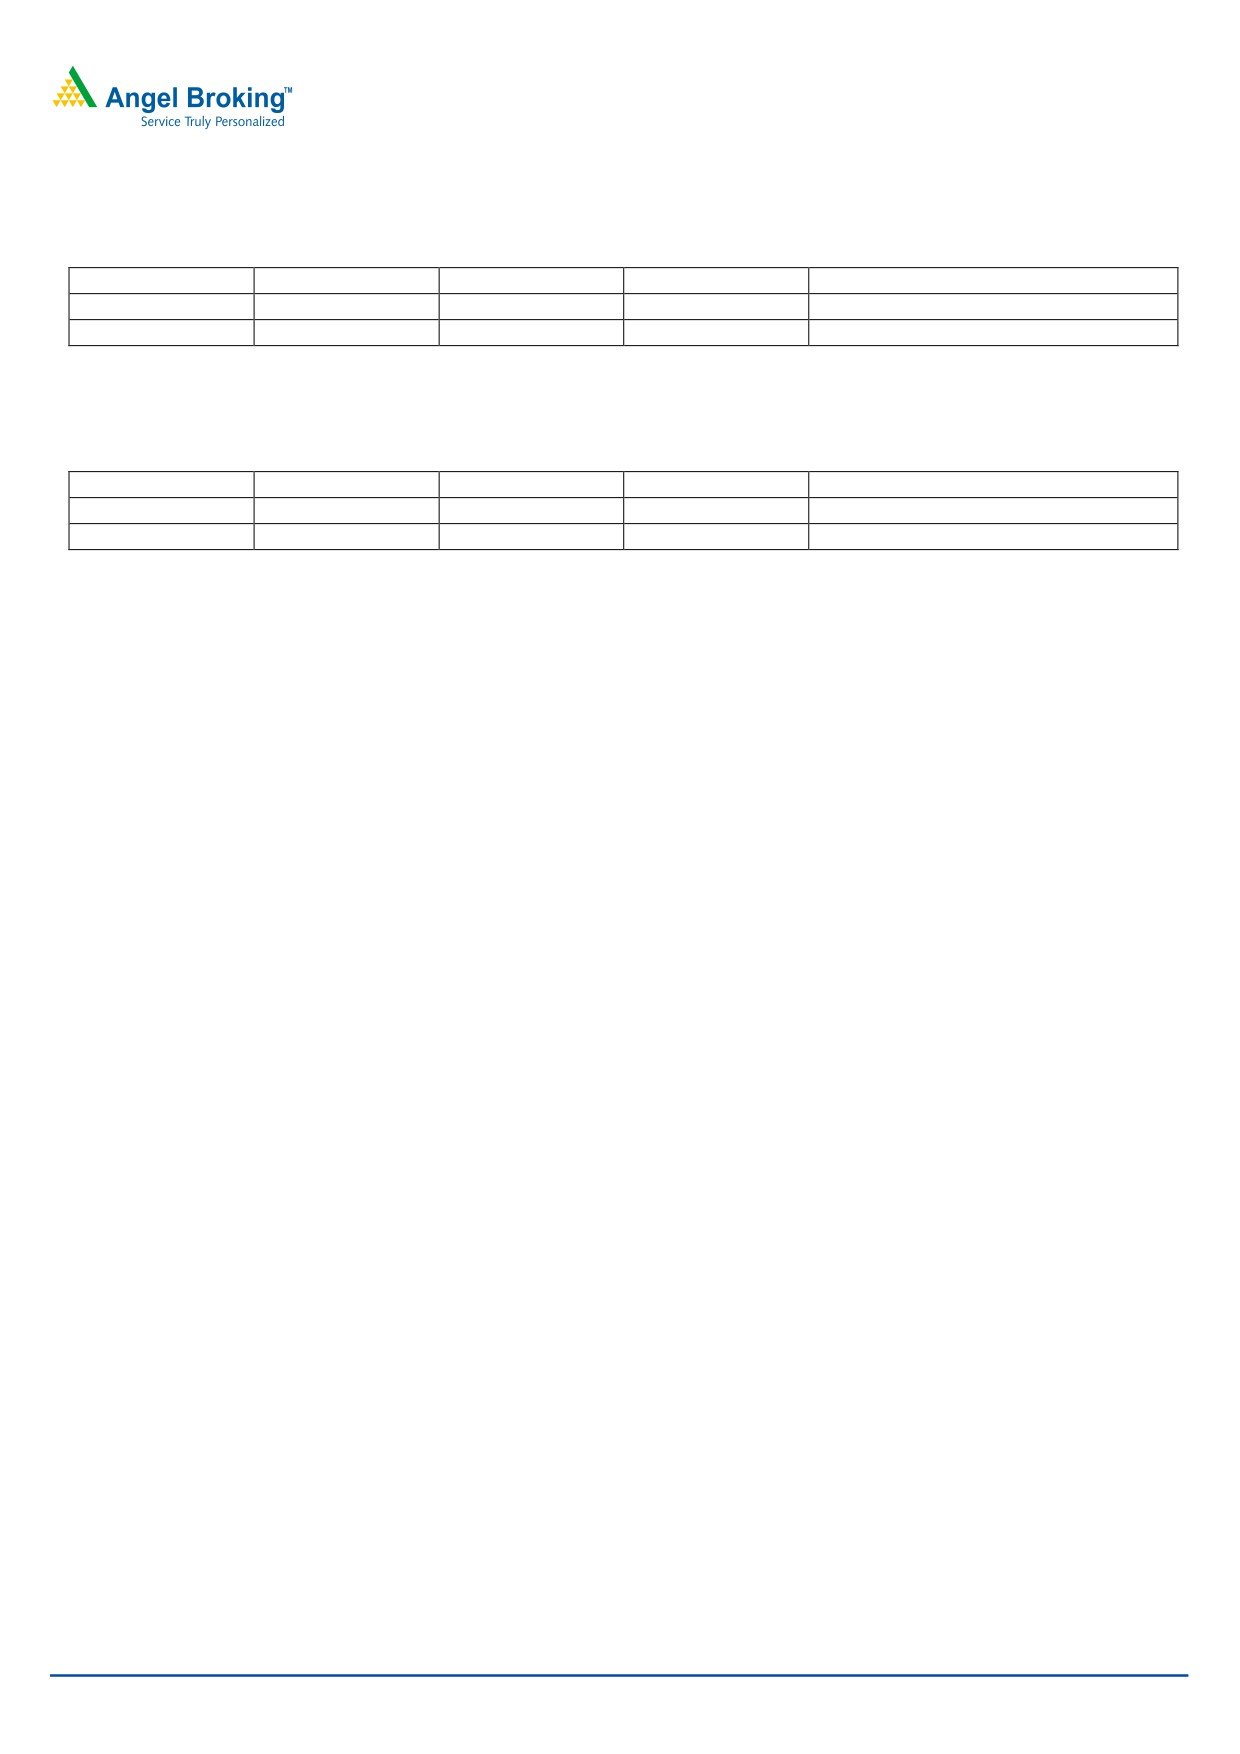
Exhibit 3:Bharti Airtel(Nov Fut) Daily chart
Stock - Bharti Airtel (Nov.Fut.)
Action - Sell
Last close - ` 386.40
Selling Range - ` 388 - ` 391
Stop Loss - ` 394.05
Target
- ` 376
Justification - We are observing a trend line break down in
hourly chart at ` 390 coupled with negative crossover of
“RSI” momentum oscillator on Daily chart. Above technical
evidences indicate possibility of a negative momentum in
coming trading sessions. Consequently, we advise selling
this stock in a range of ` 388 to ` 391 for a target of ` 376
in coming 3 - 4 trading sessions.
Source: Falcon
For Private Circulation Only |
2
Technical Research | November 03, 2011
Positive Bias:
Positive Bias:
Stock Name
5 Day EMA
20 Day EMA
Expected Target
Remarks
Dena Bank
79.4
77.1
86
View will change below 79.3
Recltd
181.7
176.7
195
View will change below 178.7
Negative Bias:
Stock Name
5 Day EMA
20 Day EMA
Expected Target
Remarks
Vip Inds
171.5
178.7
155
View will change above 179
Bata India
717
693
695
View will change above 730
For Private Circulation Only |
3
Technical Research | November 03, 2011
Daily Pivot Levels for Nifty 50 Stocks
SCRIPS
S2
S1
PIVOT
R1
R2
SENSEX
17,195
17,330
17,473
17,608
17,751
NIFTY
5,159
5,209
5,255
5,304
5,350
BANKNIFTY
9,637
9,709
9,799
9,871
9,961
ACC
1,162
1,174
1,185
1,197
1,208
AMBUJACEM
149
153
155
159
162
AXISBANK
1,105
1,115
1,128
1,138
1,150
BAJAJ-AUTO
1,674
1,696
1,722
1,744
1,770
BHARTIARTL
375
380
388
392
400
BHEL
311
313
317
320
323
BPCL
619
624
631
636
643
CAIRN
293
297
300
304
307
CIPLA
285
287
289
291
292
DLF
228
232
236
239
243
DRREDDY
1,576
1,607
1,630
1,661
1,683
GAIL
410
414
422
427
435
HCLTECH
415
426
434
445
453
HDFC
674
678
684
688
693
HDFCBANK
472
478
483
488
493
HEROMOTOCO
2,029
2,059
2,100
2,130
2,170
HINDALCO
131
134
136
138
141
HINDUNILVR
380
385
388
394
397
ICICIBANK
838
861
883
906
927
IDFC
126
129
133
136
139
INFY
2,799
2,817
2,835
2,853
2,872
ITC
206
208
209
211
213
JINDALSTEL
530
545
555
570
580
JPASSOCIAT
74
75
76
78
79
KOTAKBANK
492
497
502
507
513
LT
1,353
1,371
1,385
1,404
1,418
M&M
820
830
840
850
860
MARUTI
1,105
1,115
1,125
1,135
1,145
NTPC
173
174
177
179
181
ONGC
273
276
279
282
286
PNB
956
967
978
990
1,001
POWERGRID
102
102
103
104
105
RANBAXY
497
505
510
518
523
RCOM
76
79
81
84
86
RELCAPITAL
347
357
365
374
383
RELIANCE
843
858
869
884
895
RELINFRA
428
442
454
468
480
RPOWER
90
94
97
102
105
SAIL
107
110
112
115
117
SBIN
1,867
1,888
1,906
1,928
1,946
SESAGOA
203
205
208
210
212
SIEMENS
832
842
850
860
868
STER
119
121
123
125
127
SUNPHARMA
500
505
509
513
517
SUZLON
36
36
37
37
38
TATAMOTORS
184
188
192
197
201
TATAPOWER
99
100
102
103
105
TATASTEEL
453
460
466
474
480
TCS
1,088
1,097
1,110
1,119
1,131
WIPRO
359
367
372
379
384
Technical Research Team
For Private Circulation Only |
4
Technical Report
RESEARCH TEAM
Shardul Kulkarni
Head - Technicals
Sameet Chavan
Technical Analyst
Sacchitanand Uttekar
Technical Analyst
Mehul Kothari
Technical Analyst
Ankur Lakhotia
Technical Analyst
Research Team: 022-3952 6600
DISCLAIMER: This document is not for public distribution and has been furnished to you solely for your information and must not
be reproduced or redistributed to any other person. Persons into whose possession this document may come are required to observe
these restrictions.
Opinion expressed is our current opinion as of the date appearing on this material only. While we endeavor to update on a
reasonable basis the information discussed in this material, there may be regulatory, compliance, or other reasons that prevent us
from doing so. Prospective investors and others are cautioned that any forward-looking statements are not predictions and may be
subject to change without notice. Our proprietary trading and investment businesses may make investment decisions that are
inconsistent with the recommendations expressed herein.
The information in this document has been printed on the basis of publicly available information, internal data and other reliable
sources believed to be true and are for general guidance only. While every effort is made to ensure the accuracy and completeness of
information contained, the company takes no guarantee and assumes no liability for any errors or omissions of the information. No
one can use the information as the basis for any claim, demand or cause of action.
Recipients of this material should rely on their own investigations and take their own professional advice. Each recipient of this
document should make such investigations as it deems necessary to arrive at an independent evaluation of an investment in the
securities of companies referred to in this document (including the merits and risks involved), and should consult their own advisors to
determine the merits and risks of such an investment. Price and value of the investments referred to in this material may go up or
down. Past performance is not a guide for future performance. Certain transactions - futures, options and other derivatives as well as
non-investment grade securities - involve substantial risks and are not suitable for all investors. Reports based on technical analysis
centers on studying charts of a stock's price movement and trading volume, as opposed to focusing on a company's fundamentals
and as such, may not match with a report on a company's fundamentals.
We do not undertake to advise you as to any change of our views expressed in this document. While we would endeavor to update
the information herein on a reasonable basis, Angel Broking, its subsidiaries and associated companies, their directors and
employees are under no obligation to update or keep the information current. Also there may be regulatory, compliance, or other
reasons that may prevent Angel Broking and affiliates from doing so. Prospective investors and others are cautioned that any
forward-looking statements are not predictions and may be subject to change without notice.
Angel Broking Limited and affiliates, including the analyst who has issued this report, may, on the date of this report, and from time
to time, have long or short positions in, and buy or sell the securities of the companies mentioned herein or engage in any other
transaction involving such securities and earn brokerage or compensation or act as advisor or have other potential conflict of interest
with respect to company/ies mentioned herein or inconsistent with any recommendation and related information and opinions.
Angel Broking Limited and affiliates may seek to provide or have engaged in providing corporate finance, investment banking or
other advisory services in a merger or specific transaction to the companies referred to in this report, as on the date of this report or
in the past.
Sebi Registration No: INB 010996539
For Private Circulation Only |