Technical Research | November 1, 2011
Daily Technical Report
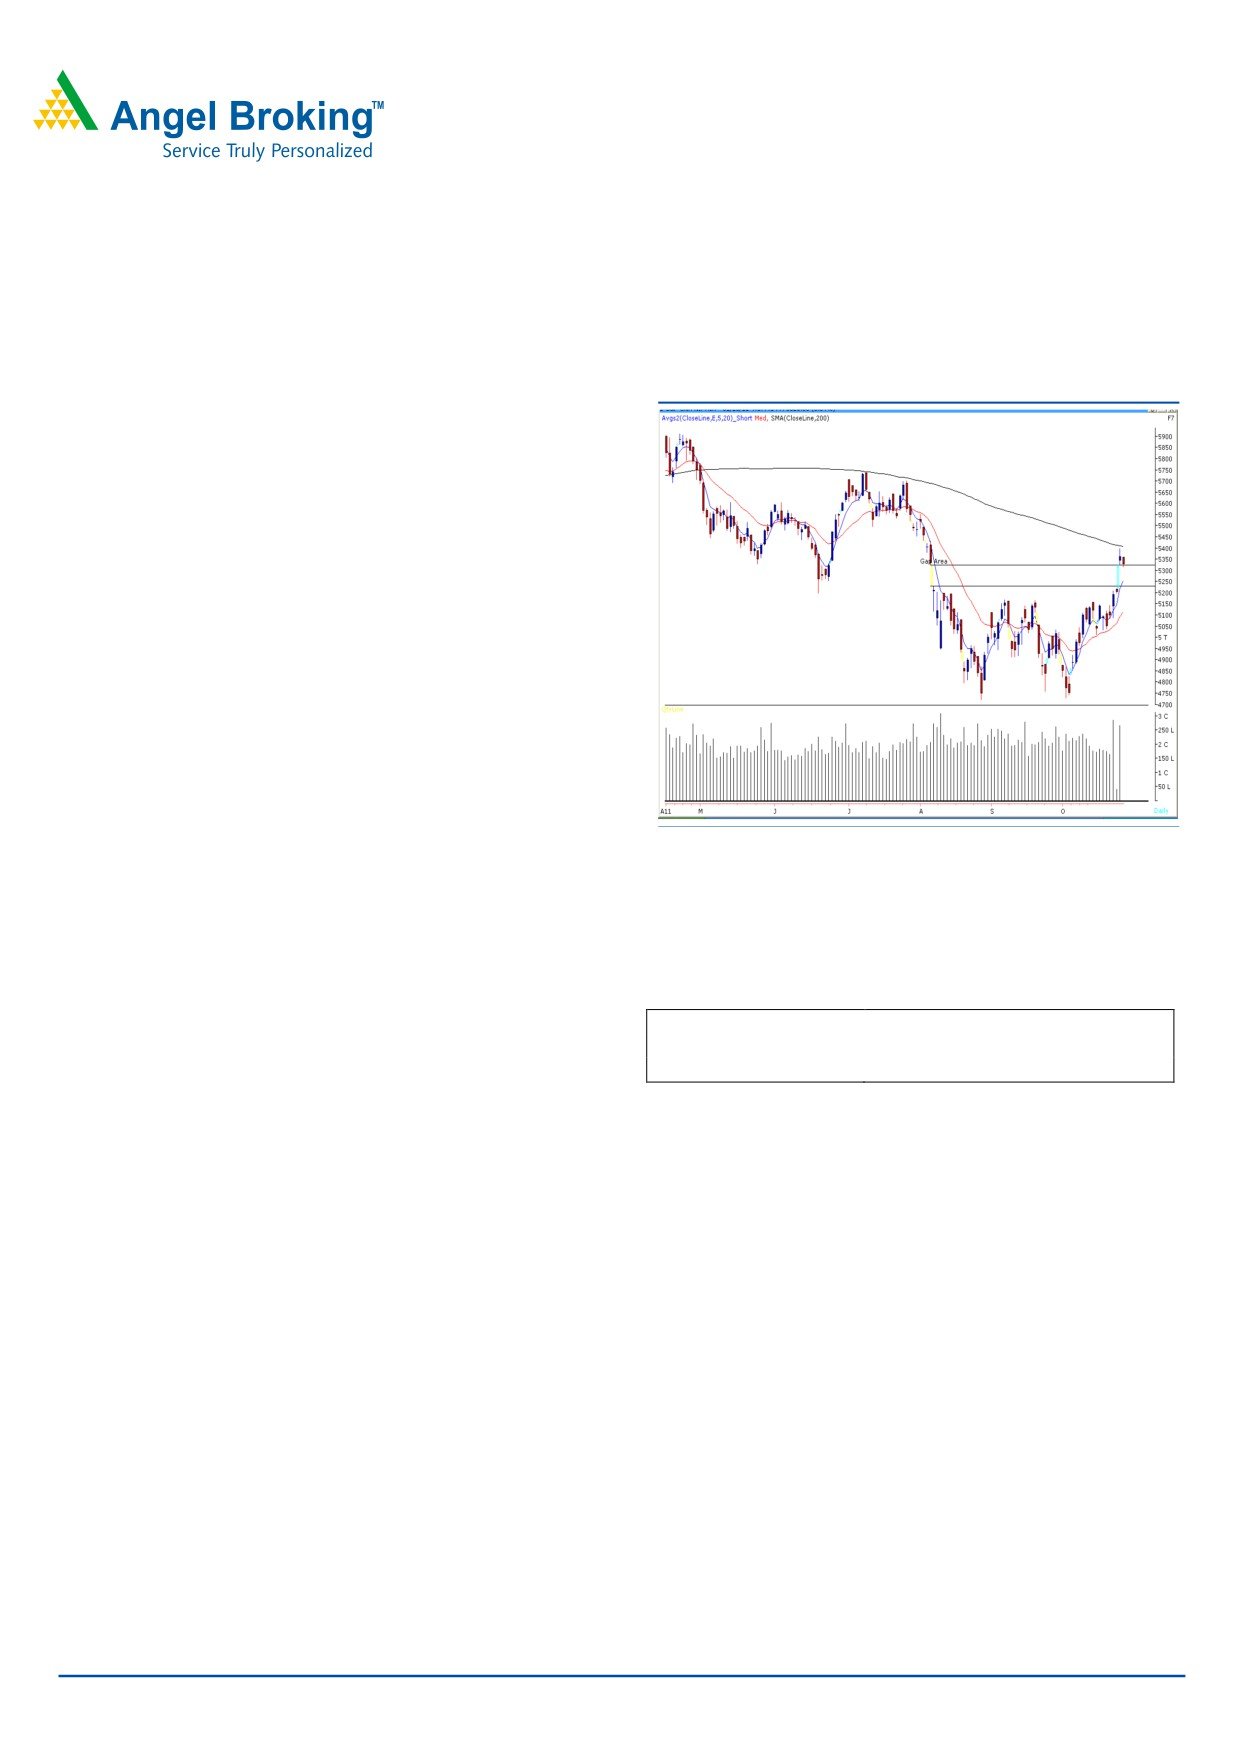
Sensex (17705) / NIFTY (5327)
We witnessed a flat opening in yesterday’s session and then
Exhibit 1: Nifty Daily Chart
indices moved in a narrow range to close marginally above
the support level of 17671 / 5322. On the sector front, Oil
& Gas and Metal counters were among the major losers
whereas FMCG and Banking counters ended on a positive
note. The advance decline ratio was marginally in favor of
advancing counters (A=1485 D=1351).
(Source
-
Formation
• On the Weekly chart, the “Downward Sloping Trend
Line” is placed around the 18150 / 5475 level.
• The Daily “200 SMA” is placed at the 18020 / 5410
level.
• We are witnessing a downside gap area of 17671 to
Source: Falcon
17350 / 5322 to 5219 created on October 28, 2011.
Actionable points:
Trading strategy:
In our earlier report, we had stated that the “Narrow range”
View
Neutral
body formation on the Daily chart indicates possibility of a
Resistance Levels
5410 - 5475
consolidation or a minor pull back. As expected, yesterday
Support Levels
5314 - 5219
indices traded in a narrow range throughout the session
and closed marginally above the support level of 17671 /
5322. We reiterate our view that indices may face supply
pressure near 18020 - 18150 / 5410 - 5475 levels.
Considering the Global clues today morning, it is likely that
our indices open in the red. Thus, a sustainable move below
yesterday’s low of 17668 / 5314 level may result in a minor
correction to fill the gap area of 17671 to 17350 / 5322 to
5219 created on October 28, 2011.
For Private Circulation Only |
1
Technical Research | November 1, 2011
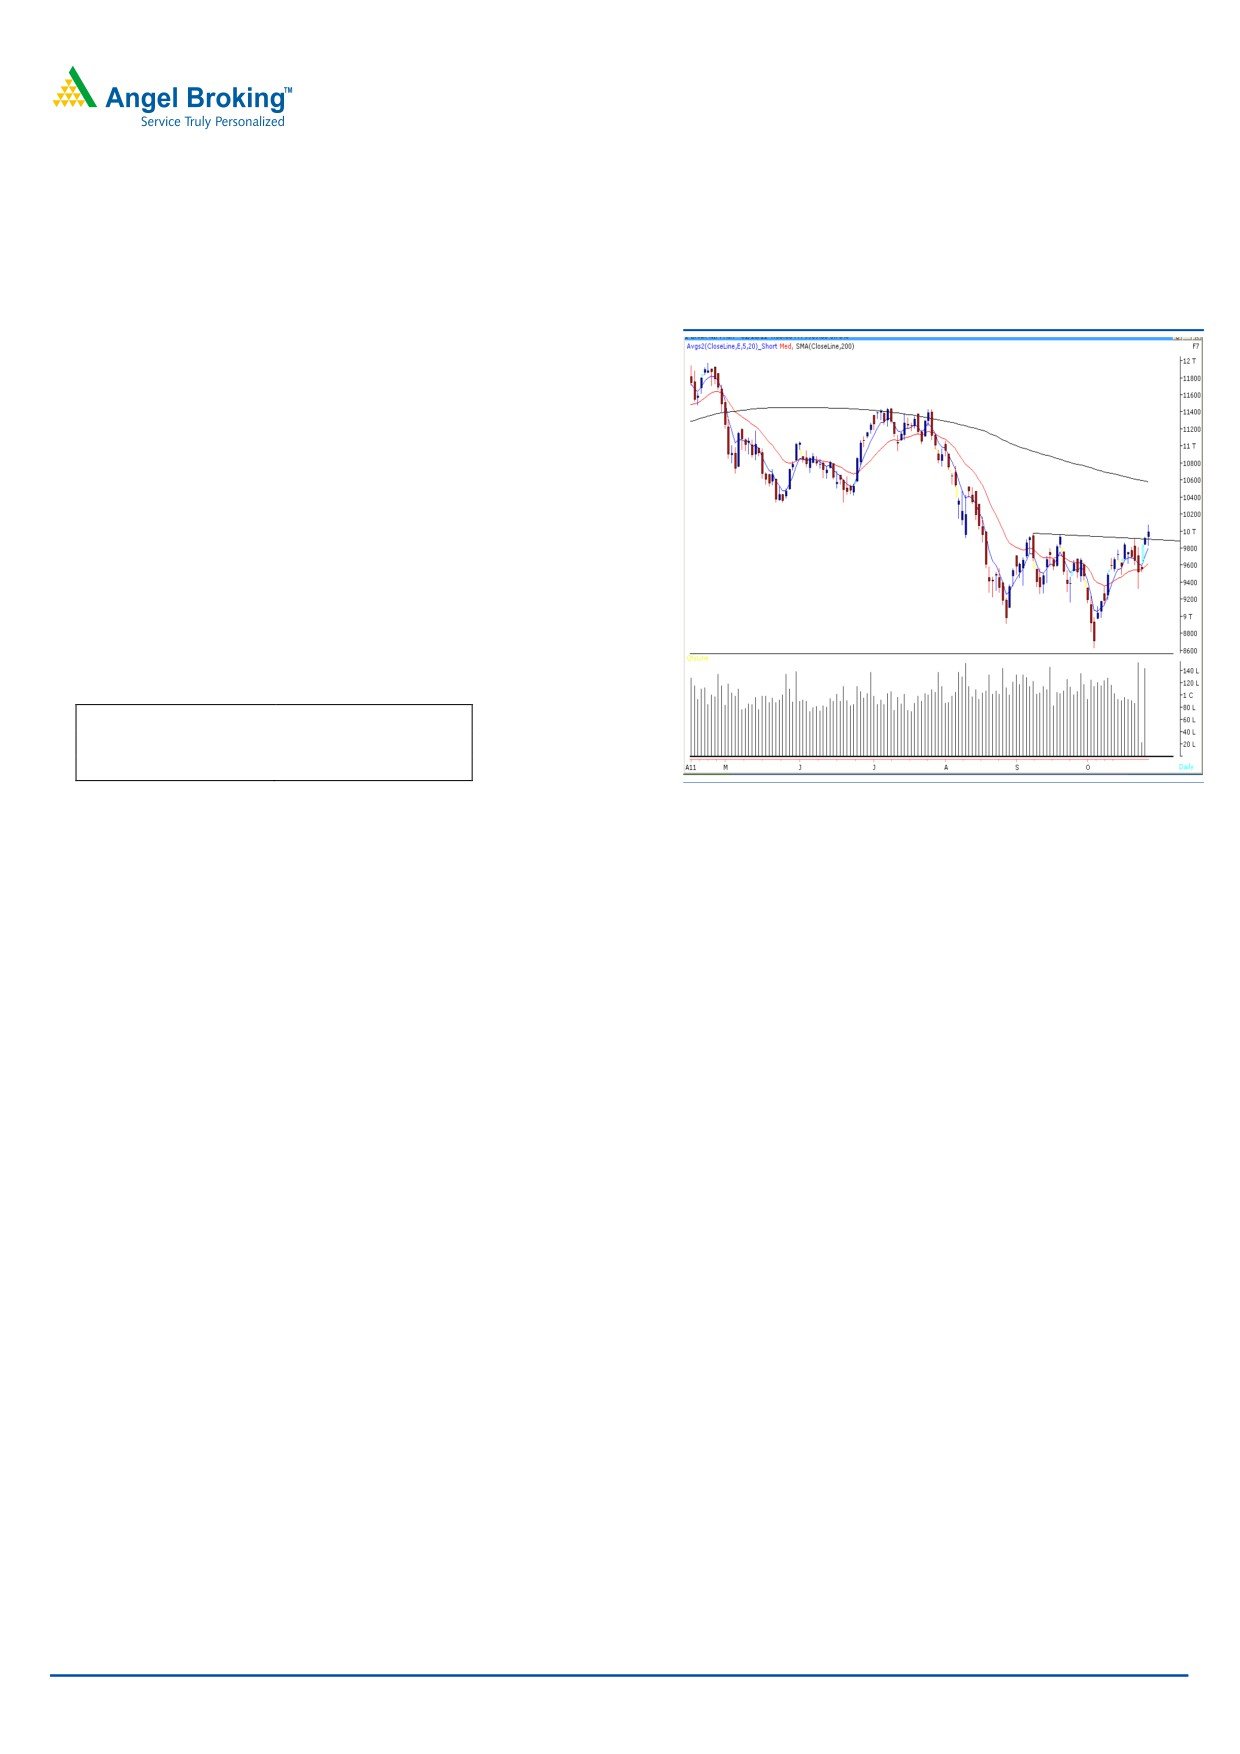
Bank Nifty Outlook - (9990)
Exhibit 2: Bank Nifty Daily Chart
Yesterday, Bank nifty managed to cross the mentioned
resistance level of 9970 - 10030 during the day trade, but
failed to give a close above the second resistance level. We
are observing a trend line breakout on daily chart, but the
candle formed is a “Spinning Top” which indicates
indecisiveness at current levels. Therefore, only if bank nifty
sustains above yesterday’s high of 10080 then it is likely to
test 10300 - 10350 levels.
On the downside, 9826 - 9607 levels may act as support
level for the day.
Actionable points:
View
Neutral
Resistance Levels
10080 - 10300
Support Level
9826 - 9607
Source: Falcon
For Private Circulation Only |
2
Technical Research | November 1, 2011
Positive Bias:
Stock Name
5 Day EMA
20 Day EMA
Expected Target
Remarks
Aptech
119
117.7
129
View will change below 116.50
BankBaroda
746.2
749.4
800
View will change below 729
Negative Bias:
Stock Name
5 Day EMA
20 Day EMA
Expected Target
Remarks
Jubilant Food
835
844
780
View will change above 834
ONGC
277.5
271
270
View will change above 285
For Private Circulation Only |
3
Technical Research | November 1, 2011
Daily Pivot Levels for Nifty 50 Stocks
SCRIPS
S2
S1
PIVOT
R1
R2
SENSEX
17,584
17,644
17,729
17,789
17,874
NIFTY
5,288
5,307
5,334
5,353
5,379
BANKNIFTY
9,712
9,851
9,965
10,104
10,219
ACC
1,169
1,182
1,203
1,216
1,237
AMBUJACEM
149
152
156
160
164
AXISBANK
1,132
1,146
1,155
1,168
1,178
BAJAJ-AUTO
1,692
1,711
1,740
1,759
1,789
BHARTIARTL
385
388
392
395
399
BHEL
309
314
321
326
333
BPCL
599
611
628
639
656
CAIRN
291
295
300
304
309
CIPLA
288
292
296
299
303
DLF
235
239
244
247
252
DRREDDY
1,636
1,653
1,664
1,681
1,692
GAIL
414
418
425
430
437
HCLTECH
433
439
446
451
459
HDFC
670
680
687
697
704
HDFCBANK
472
481
486
495
501
HEROMOTOCO
2,133
2,157
2,174
2,198
2,215
HINDALCO
131
134
137
140
143
HINDUNILVR
338
357
367
387
397
ICICIBANK
903
917
935
949
968
IDFC
128
130
133
135
137
INFY
2,835
2,856
2,877
2,898
2,919
ITC
210
211
213
215
217
JINDALSTEL
545
554
568
577
591
JPASSOCIAT
76
77
78
79
80
KOTAKBANK
499
506
509
516
520
LT
1,388
1,401
1,415
1,427
1,441
M&M
840
853
864
877
888
MARUTI
1,033
1,079
1,106
1,152
1,179
NTPC
175
177
180
182
186
ONGC
271
274
280
283
289
PNB
938
957
968
987
998
POWERGRID
102
104
105
106
107
RANBAXY
489
495
507
513
524
RCOM
77
78
80
81
83
RELCAPITAL
358
364
370
376
382
RELIANCE
856
867
883
894
910
RELINFRA
443
454
463
473
482
RPOWER
92
94
95
97
98
SAIL
109
110
113
115
118
SBIN
1,858
1,882
1,902
1,926
1,946
SESAGOA
200
204
207
211
214
SIEMENS
840
848
860
867
880
STER
123
125
129
131
134
SUNPHARMA
493
499
504
510
515
SUZLON
37
38
38
39
40
TATAMOTORS
193
196
201
203
208
TATAPOWER
97
99
101
103
105
TATASTEEL
469
476
482
489
496
TCS
1,100
1,108
1,120
1,128
1,140
WIPRO
350
358
372
380
393
Technical Research Team
For Private Circulation Only |
4
Technical Report
RESEARCH TEAM
Shardul Kulkarni
Head - Technicals
Sameet Chavan
Technical Analyst
Sacchitanand Uttekar
Technical Analyst
Mehul Kothari
Technical Analyst
Ankur Lakhotia
Technical Analyst
Research Team: 022-3952 6600
DISCLAIMER: This document is not for public distribution and has been furnished to you solely for your information and must not
be reproduced or redistributed to any other person. Persons into whose possession this document may come are required to observe
these restrictions.
Opinion expressed is our current opinion as of the date appearing on this material only. While we endeavor to update on a
reasonable basis the information discussed in this material, there may be regulatory, compliance, or other reasons that prevent us
from doing so. Prospective investors and others are cautioned that any forward-looking statements are not predictions and may be
subject to change without notice. Our proprietary trading and investment businesses may make investment decisions that are
inconsistent with the recommendations expressed herein.
The information in this document has been printed on the basis of publicly available information, internal data and other reliable
sources believed to be true and are for general guidance only. While every effort is made to ensure the accuracy and completeness of
information contained, the company takes no guarantee and assumes no liability for any errors or omissions of the information. No
one can use the information as the basis for any claim, demand or cause of action.
Recipients of this material should rely on their own investigations and take their own professional advice. Each recipient of this
document should make such investigations as it deems necessary to arrive at an independent evaluation of an investment in the
securities of companies referred to in this document (including the merits and risks involved), and should consult their own advisors to
determine the merits and risks of such an investment. Price and value of the investments referred to in this material may go up or
down. Past performance is not a guide for future performance. Certain transactions - futures, options and other derivatives as well as
non-investment grade securities - involve substantial risks and are not suitable for all investors. Reports based on technical analysis
centers on studying charts of a stock's price movement and trading volume, as opposed to focusing on a company's fundamentals
and as such, may not match with a report on a company's fundamentals.
We do not undertake to advise you as to any change of our views expressed in this document. While we would endeavor to update
the information herein on a reasonable basis, Angel Broking, its subsidiaries and associated companies, their directors and
employees are under no obligation to update or keep the information current. Also there may be regulatory, compliance, or other
reasons that may prevent Angel Broking and affiliates from doing so. Prospective investors and others are cautioned that any
forward-looking statements are not predictions and may be subject to change without notice.
Angel Broking Limited and affiliates, including the analyst who has issued this report, may, on the date of this report, and from time
to time, have long or short positions in, and buy or sell the securities of the companies mentioned herein or engage in any other
transaction involving such securities and earn brokerage or compensation or act as advisor or have other potential conflict of interest
with respect to company/ies mentioned herein or inconsistent with any recommendation and related information and opinions.
Angel Broking Limited and affiliates may seek to provide or have engaged in providing corporate finance, investment banking or
other advisory services in a merger or specific transaction to the companies referred to in this report, as on the date of this report or
in the past.
Sebi Registration No : INB 010996539
For Private Circulation Only |