Initiating coverage | Credit Rating
January 10, 2010
CRISIL
BUY
CMP
`5,979
Well Rated
Target Price
`7,584
CRISIL is the largest credit rating agency with a market share of around 65% and is
Investment Period
12 Months
one of the biggest research houses in India. With the recent acquisition of Pipal
Sector
Credit R ating
Research Corp. (Pipal), robust credit demand and strong infrastructure-spend, we
Market Cap (` cr)
4,245
expect strong growth across all the segments of the company. The company has
Beta
0.3
also recently finished a buyback of 1.3lakh shares worth `80cr at an average price
of `6,200. We Initiate Coverage on the stock with a Buy rating.
52 Week High / Low
6350/4290
Avg. Daily Volume
1,198
Acquisition of Pipal to boost research revenue: Pipal is a strong player providing
Face Value (`)
10
offshore research services to the corporate sector, while CRISIL's Irevna is a leading
offshore research provider to the financial sector. The synergy between the two
BSE Sensex
19,224
firms will help CRISIL to service its clients better and further expand its client base,
Nifty
5,763
resulting in strong growth going ahead. Post the acquisition with the combined
R euters Code
CR S L.BO
strength of the two firms we expect a 22% CAGR in the research segment's revenue
Bloomberg Code
CR ISIL@IN
over CY2010-12.
Robust growth in credit ratings to continue on strong credit demand: We believe
credit demand will continue to grow at a faster rate than India's nominal GDP as
Shareholding P attern (% )
financial depth continues to increase. The need for large capital formation of 30-
P romoters
52.4
35% of GDP for sustaining 8%+ GDP growth in India is well acknowledged;
MF / B anks / Indian Fls
19.4
hence, we expect credit demand to witness
20% CAGR over CY2010-14,
considering the actual and latent credit demand in India. CRISIL has been growing
F II / NR Is / OCBs
10.4
at ~2x India's credit growth since CY2005. Further, the company will continue to
Indian P ublic / Others
17.8
benefit from Basel-II norms, as a large number of entities are still to be rated.
CRISIL, being the market leader with 65% market share in credit rating and 50%
share in bank loan rating (BLR), will continue to benefit greatly from India's strong
Abs . (% )
3m 1yr
3yr
credit growth. We conservatively expect the segment to register 21% revenue CAGR
Sensex
(5.1)
9.6
(6.6)
over CY2010-12.
CR IS IL
0.8
24.3
70.8
Outlook and valuation: We expect CRISIL to post 21.5% CAGR in revenues over
CY2010-12 and continue to maintain its leadership position. CRISIL benefits from
its asset-light business model, which is high on intellectual assets (employee cost-
to-sales is around 40%). Further, the company is debt free and has 40% plus RoE.
Additionally, CRISIL enjoys strong parentage (Standard and Poor's). Currently, the
stock is available at 17.3x CY2012E earnings, which is at the lower end of its
historical range of 16.4-29.9x one-year forward EPS. We Initiate Coverage on the
stock with a Buy rating and a Target Price of `7,584, valuing it at its five-year
median of 22x CY2012E earnings and implying an upside of 27%.
Key financials (Consolidated)
Y/E Dec. (` cr)
CY2009 CY2010E CY2011E CY2012E
Net sales
537
629
767
927
% chg
4.4
17.0
22.0
20.0
Adj. Net profit
161
157
200
245
% chg
14.4
(2.5)
27.7
22.3
FDEPS (`)
223
284
282
345
EBITDA margin (%)
37.1
33.3
34.3
34.8
P/E (x)
26.9
21.0
21.2
17.3
RoE (%)
40.6
37.2
44.9
46.8
RoCE (%)
46.6
44.6
53.6
56.8
P/BV (x)
10.0
10.4
8.8
7.6
Sharan Lillaney
EV/Sales (x)
7.6
6.6
5.3
4.3
022- 3935 7800 Ext.: 6811
EV/EBITDA (x)
20.5
20.0
15.6
12.4
Source: Company, Angel Research
Please refer to important disclosures at the end of this report
1
CRISIL | Initiating coverage
Investment arguments
CRISIL witnessed robust growth in the first three quarters of CY2010 on the back of
strong credit growth and global economic recovery, which going ahead is
expected to further improve. The company recently acquired Pipal Research, which
will lend to a boost to their research portfolio and result in robust growth in the
ensuing years. The advisory segment is expected to revert to high growth
tracjectory on the back of the strong infra spends. Overall, we expect all the
segments of the company to register high growth and conservatively expect total
revenues to register 21.5% CAGR over CY2010-12.
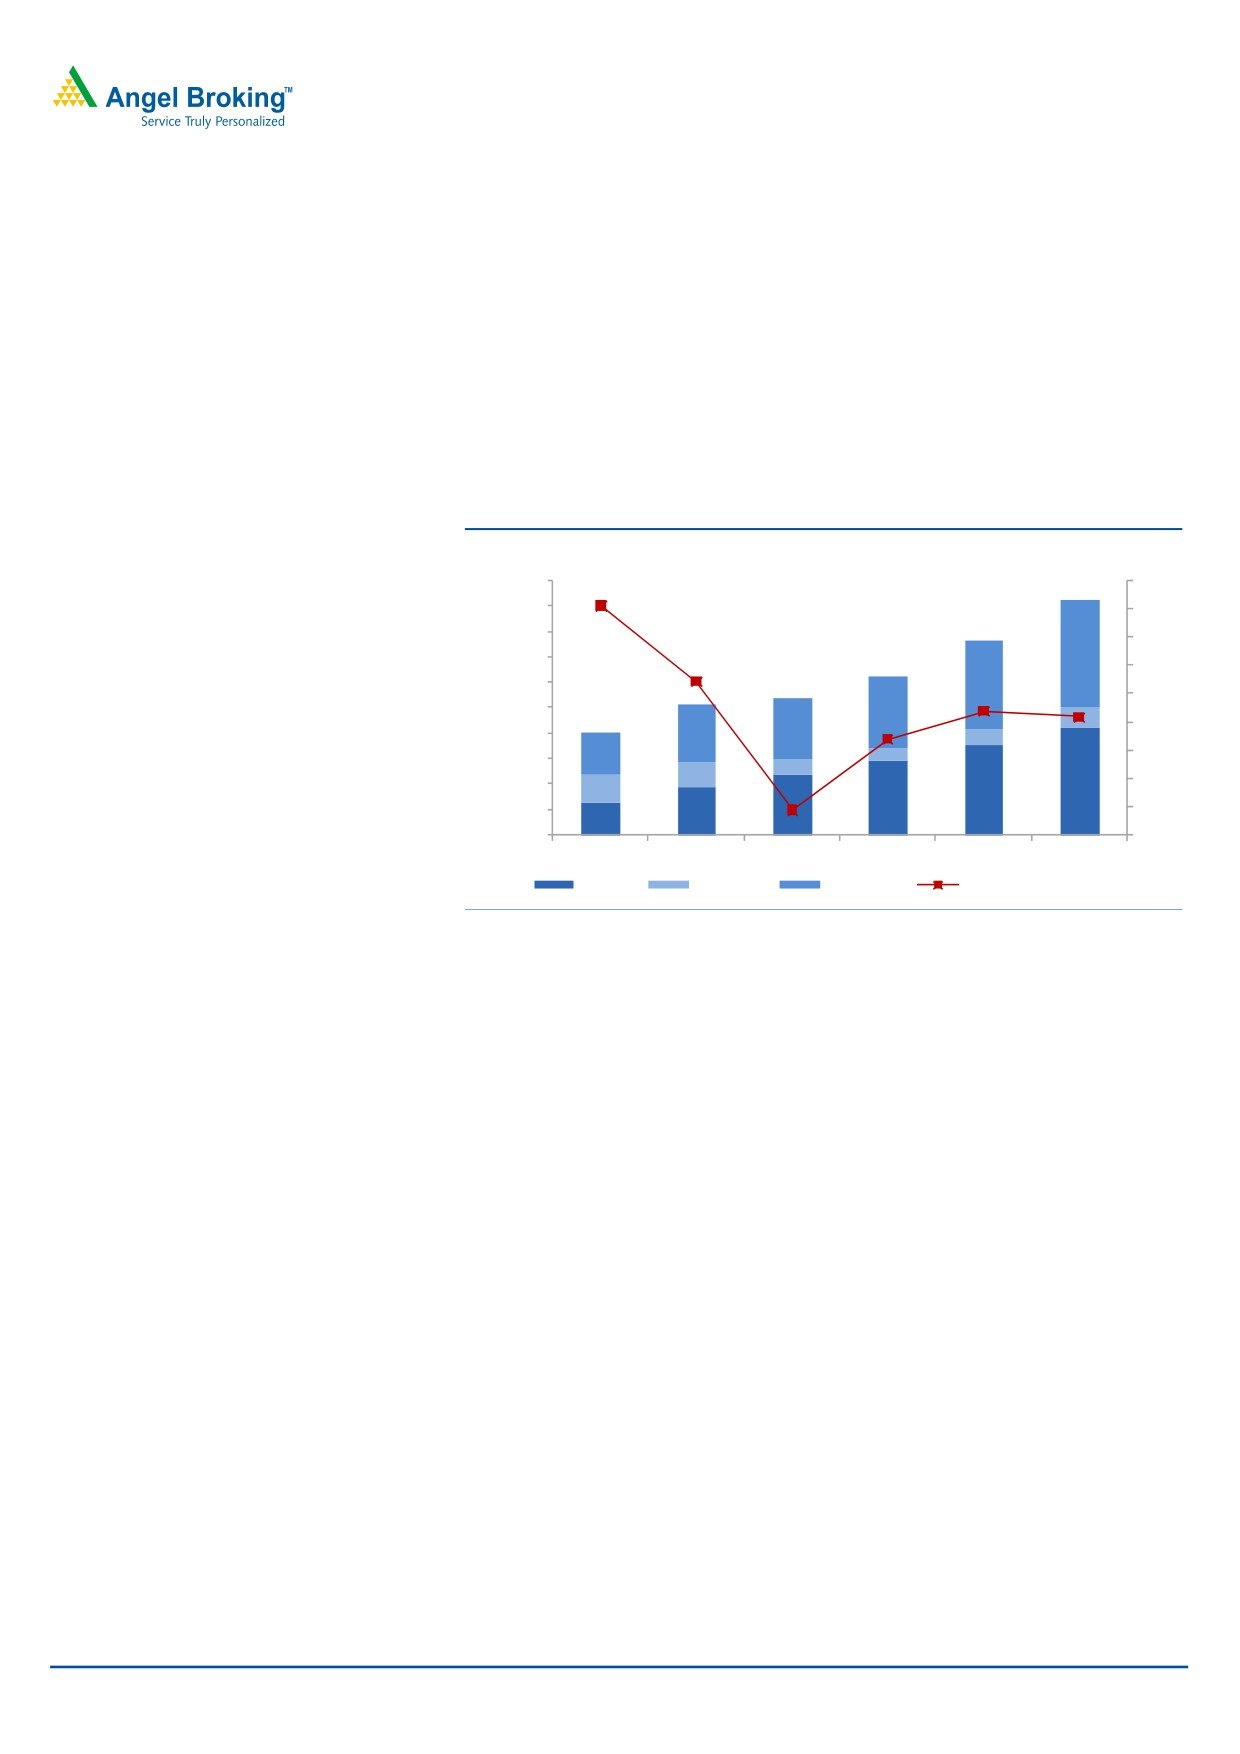
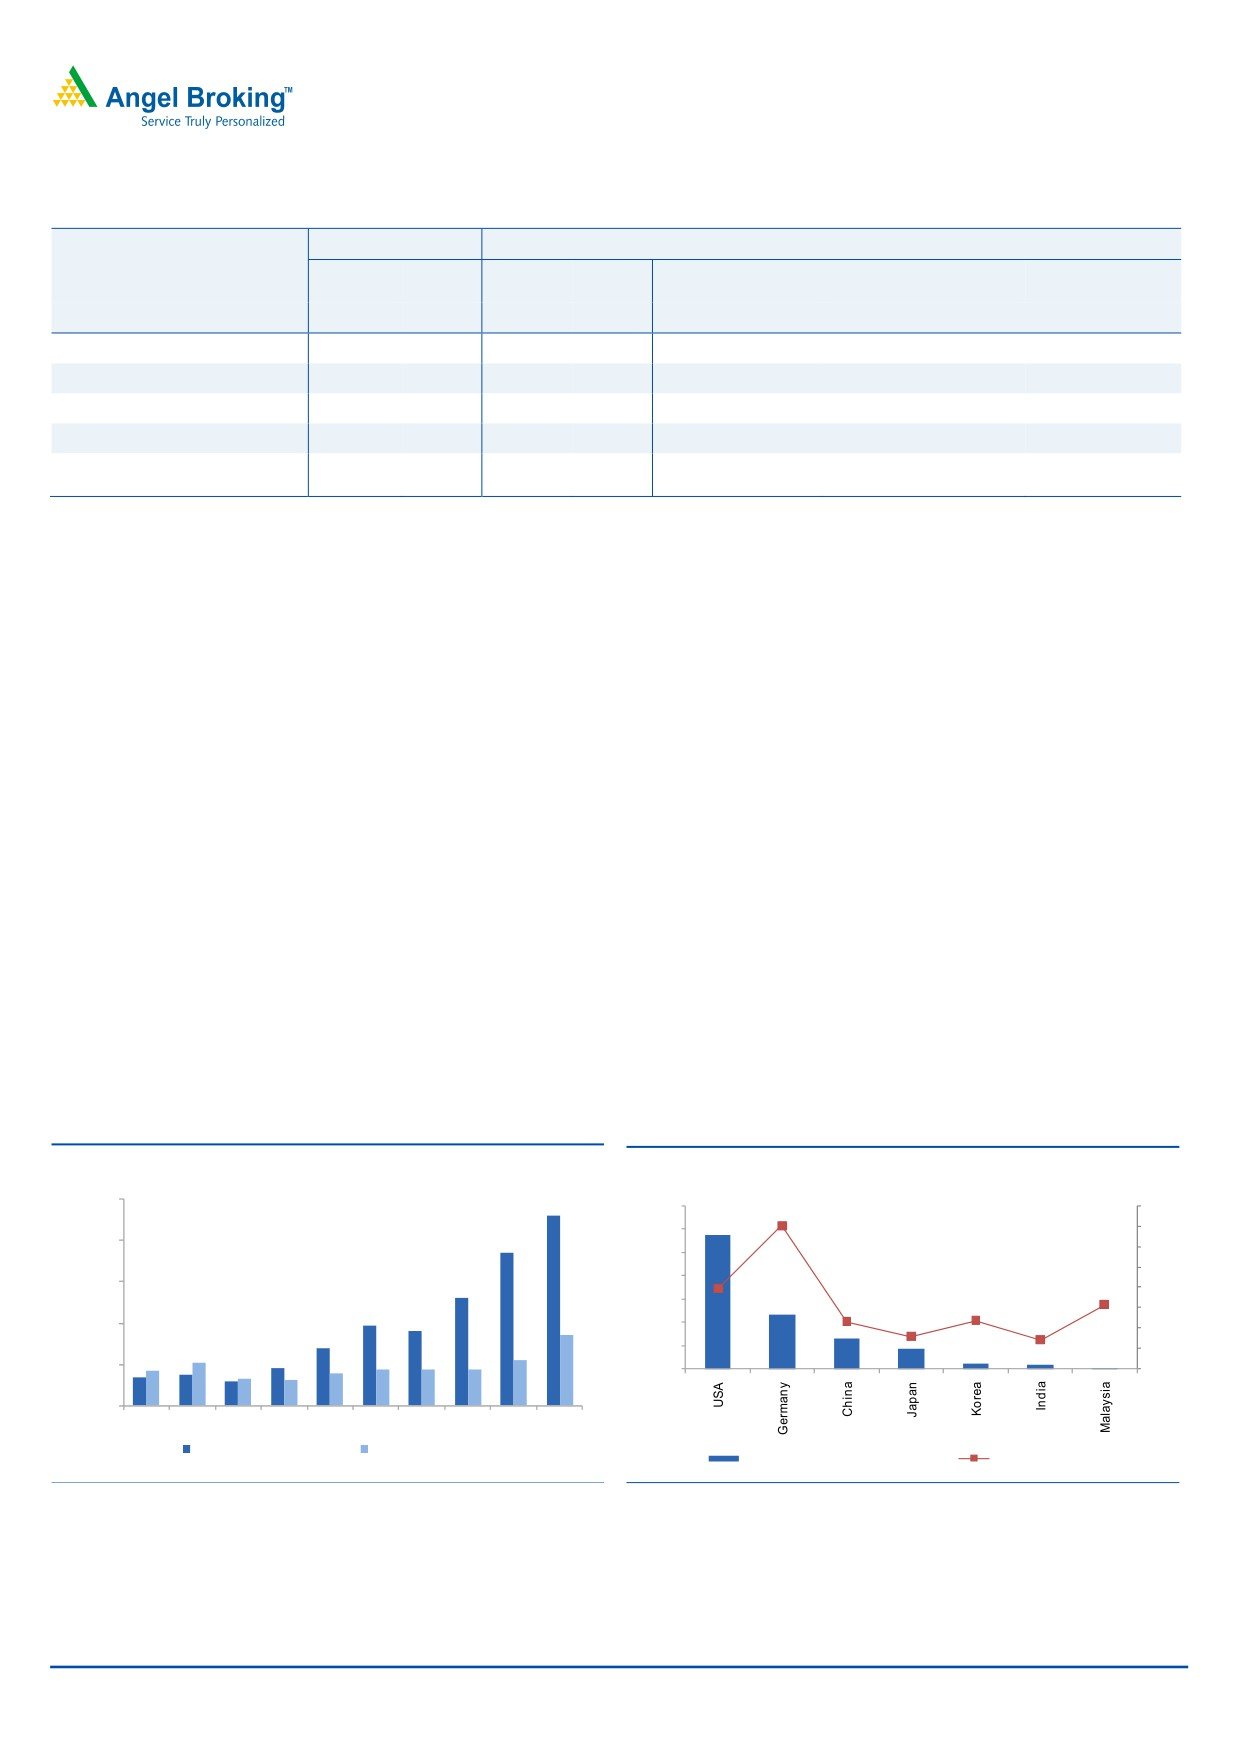
Exhibit 1: Segmental revenue breakup
(` cr)
(%)
1,000
45
900
40
800
35
700
427
30
600
352
25
500
286
75
20
400
226
238
62
168
51
15
300
60
100
10
200
425
107
353
292
239
5
100
189
130
0
0
CY07
CY08
CY09
CY10E
CY11E
CY12E
Rating
Advisory
Research
Total Revenue Growth
Source: Company, Angel Research
Strong growth to continue on the back of acquisition Pipal
CRISIL has a history of acquiring small companies and scaling their operations by
leveraging their strong clientele, skills and processes. CRISIL acquired Irevna in
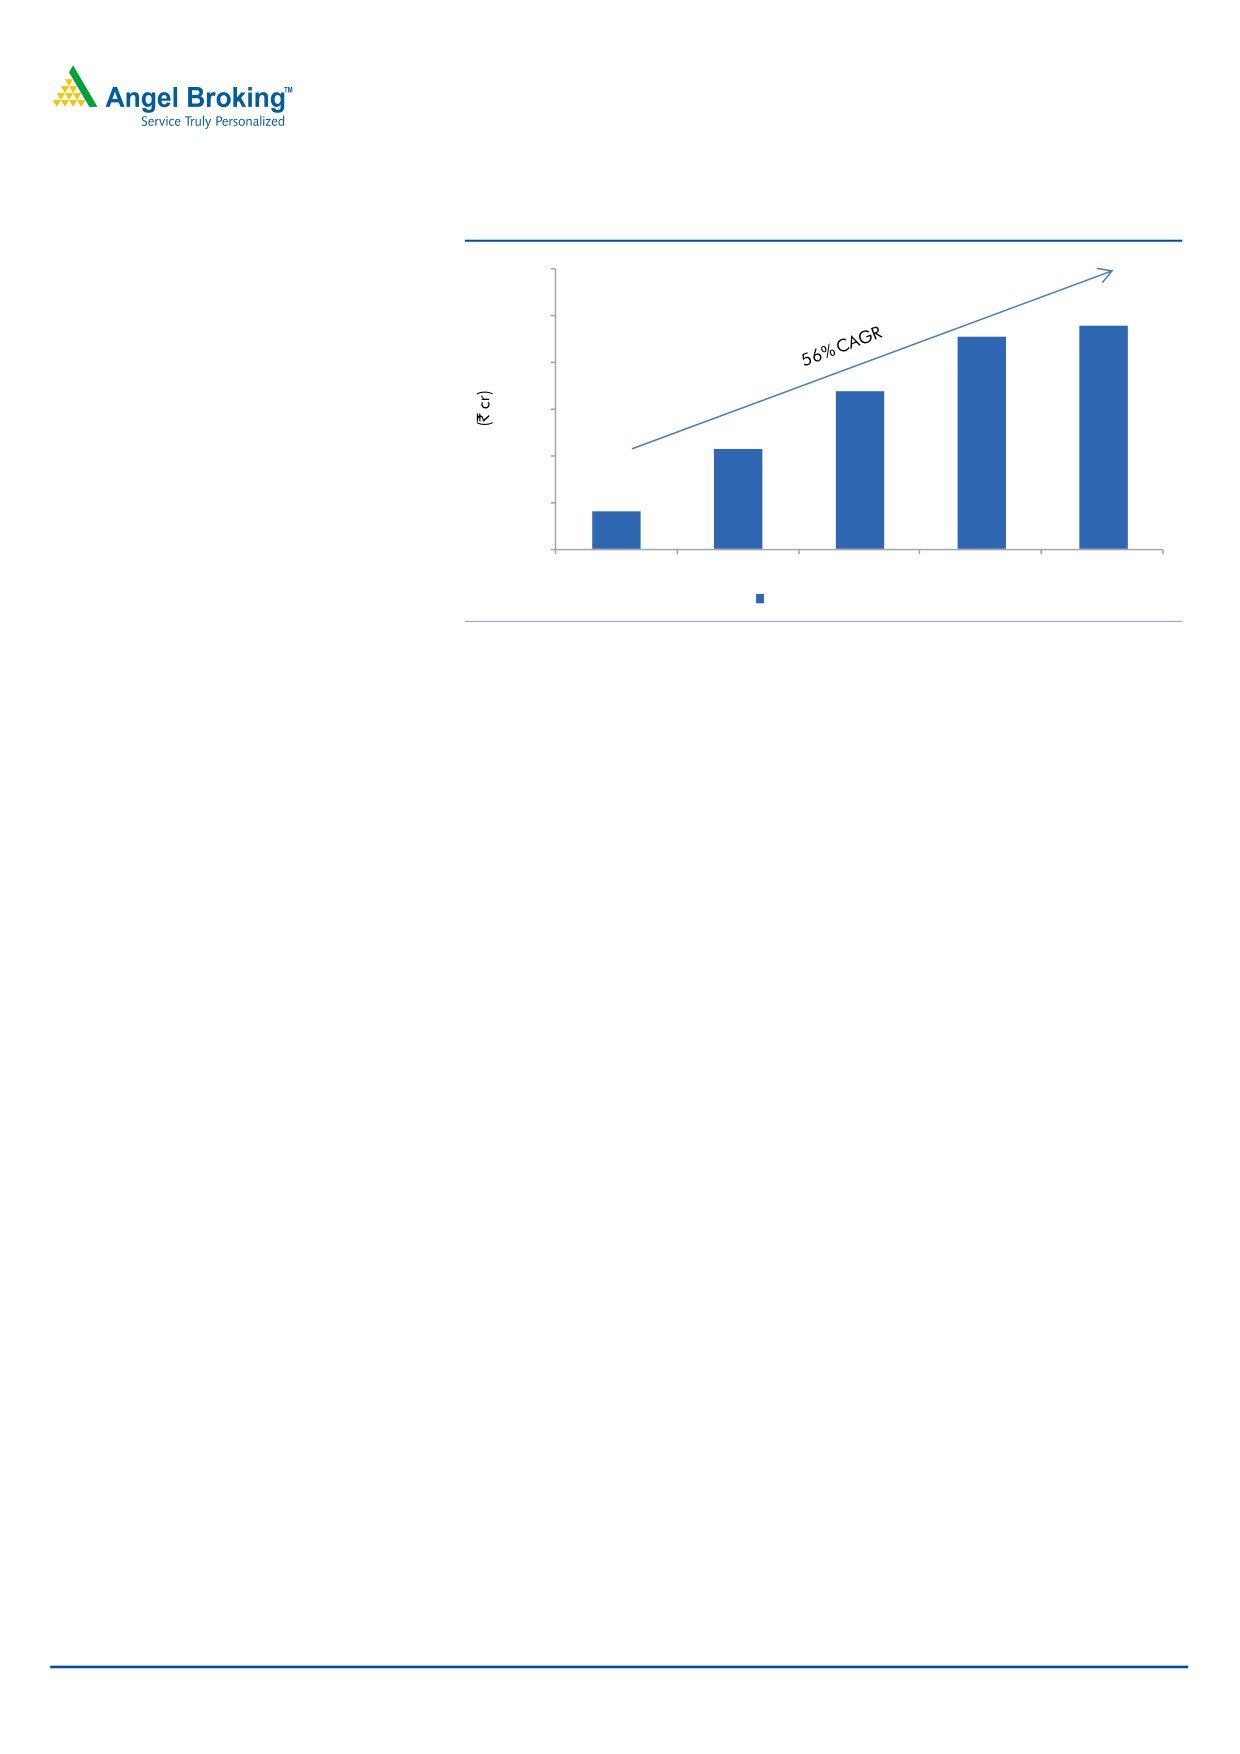
CY2005 for `73.1cr, which was valued at ~2.2x EV/Sales (`33.1cr sales). Post the
acquisition, CRISIL’s research segment’s revenue increased from `41cr in CY2005
to `238cr in CY2009, witnessing a 55.7% CAGR in revenue over CY2005-09,
contributing nearly 45% to the total revenue in CY2009 from 29% in CY2005.
In CY2009, Datamonitor’s The Black Book of Outsourcing for Financial Research
ranked Irevna as the number one research house in the country.
January 10, 2010
2
CRISIL | Initiating coverage
Exhibit 2: Strong revenue growth post Irevna’s acquisition
300
250
200
150
100
50
41
107
168
226
238
0
CY05
CY06
CY07
CY08
CY09
Research Revenue
Source: Company, Angel Research
CRISIL recently acquired Chicago-based Pipal Research Corp., one of the leading
players in the knowledge process outsourcing (KPO) industry, from First Source
Solution for US $12.75mn (around `58cr), at 1.6x EV/Sales . Pipal has a strong
presence in the corporate sector mainly in North America and Europe and
reported revenue of US $8.1mn (around `37cr) in FY2010. Pipal’s client base
includes leading telecommunications, technology, consumer packaged goods and
industrial companies.
Currently, CRISIL is a leader in the high-end KPO space. With this acquisition,
CRISIL, which provides services from Chennai, Mumbai, Buenos Aires and
Wroclaw (Poland), will now have presence in Gurgaon, Noida, Bangalore and
Chicago. The acquisition will also strengthen its position in the market. Pipal has
strong presence in the corporate sector, while Irevna’s strong presence lies in the
financial sector. The synergy between the two firms will help the company to
service clients better and expand its client base, which will result in a strong
platform for growth in the coming years.
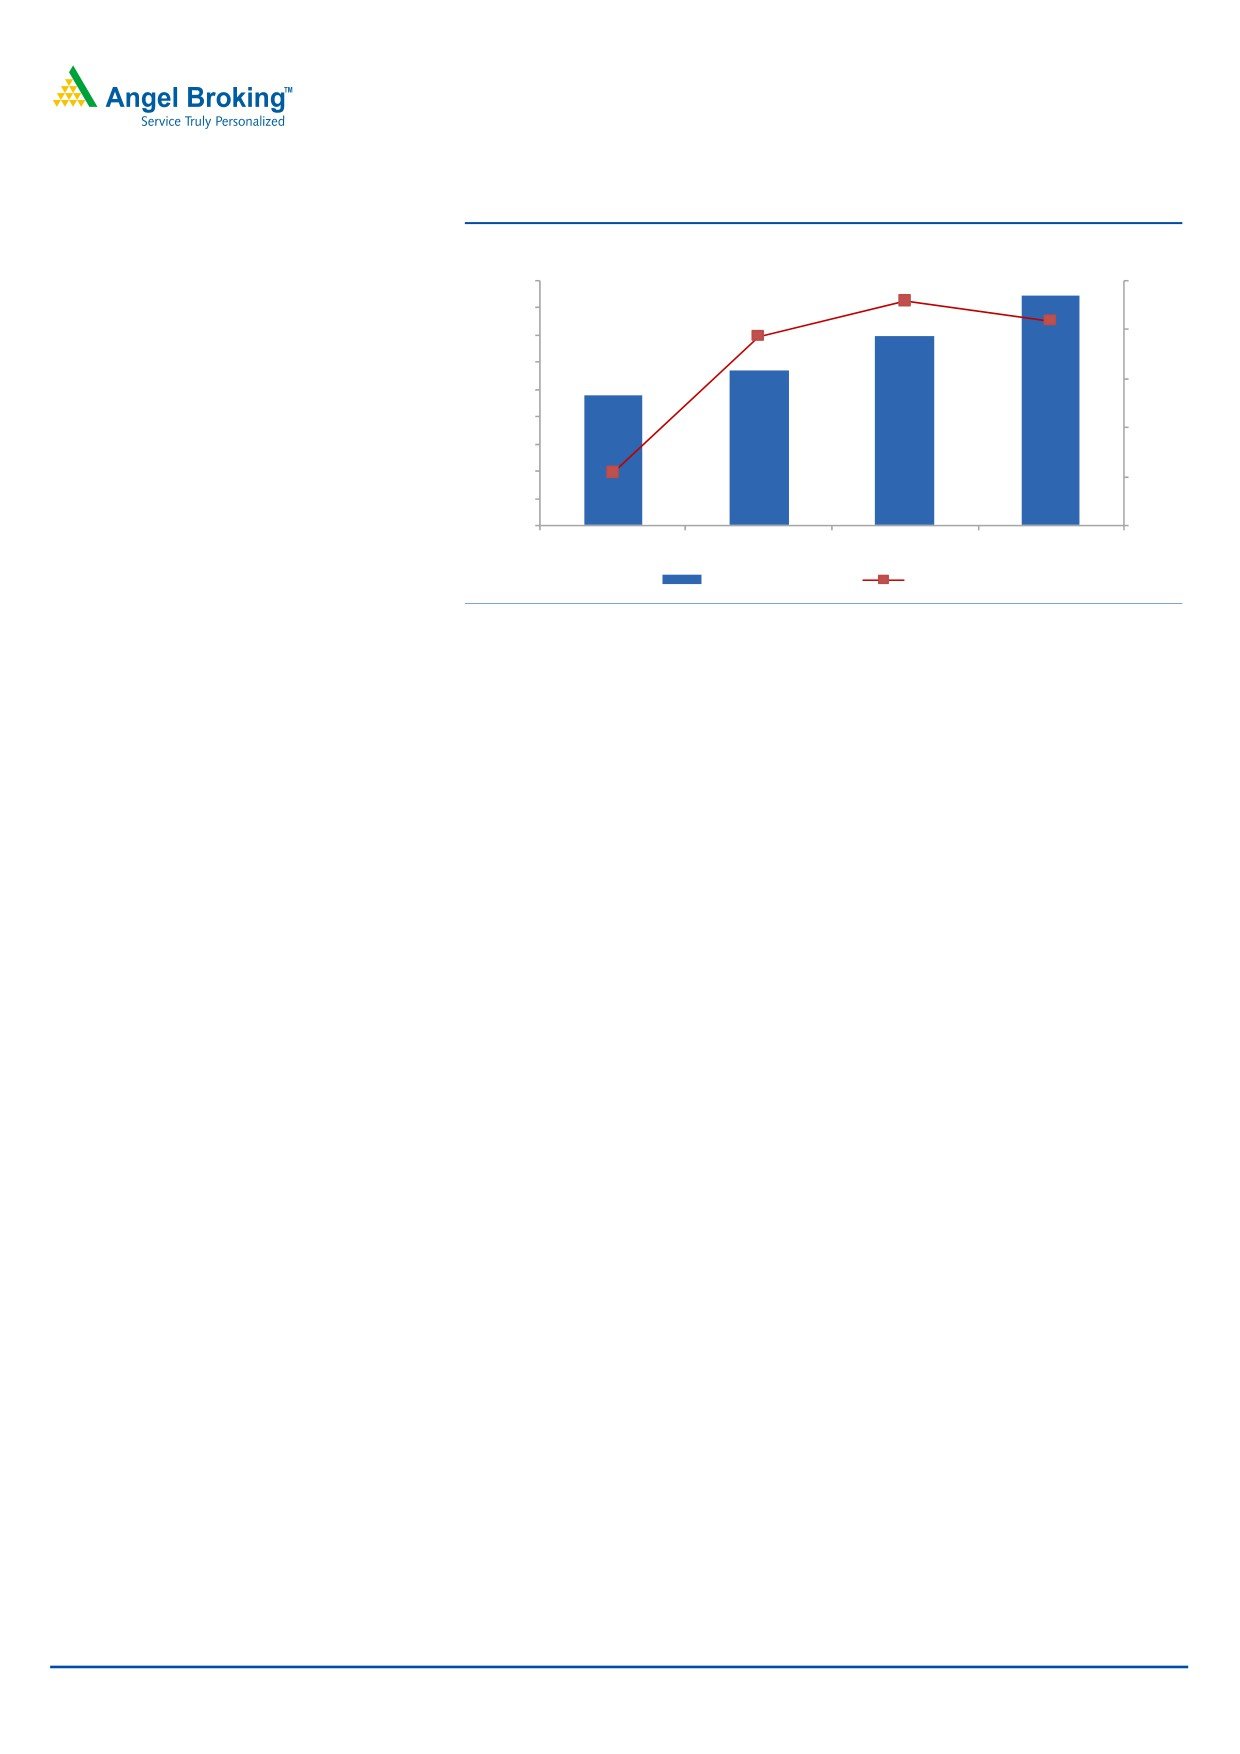
Going ahead, we expect CRISIL’s research segment to grow further, as it did post
the acquisition of Irevna, registering a 22% CAGR over CY2010-12E.
January 10, 2010
3
CRISIL | Initiating coverage
Exhibit 3: Robust growth to continue post Pipal’s acquisition
(`
cr)
(%)
450
23
25
21
400
19
350
20
300
15
250
200
10
150
5
100
5
50
238
285
350
424
-
-
CY09
CY10E
CY11E
CY12E
Research Revenue
Growth (yoy)
Source: Company, Angel Research
Robust growth in credit ratings to continue on strong credit demand
The Indian economy is on the cusp of an upturn in its capex cycle, and early signs
of a pronounced capex upswing are already emerging. GDP growth has averaged
at about 8% over the last five years and is expected to grow at 8-9% over the next
few years.
We believe macro indicators such as huge project announcements, improving
utilisation levels, improved business confidence, increasing end-product prices and
expectation of significant demand improvement will lead to growth in the capex
cycle. Funds raised by companies grew by 20.5% in FY2010 compared to 18% in
FY2009. The capex cycle, which started in 2004, took a breather between 2008
and 2009 as the world faced liquidity constraints.
After the interruption seen over the last two years, the capex cycle has resumed
and is expected to further improve going ahead. Rising economic growth
momentum, improving domestic demand prospects and growing capacity
utilisation since FY2009 have translated into recent growth in capacity expansion
plans as well as in actual project implementation. Moreover, the continuous flow of
investment announcements reflects the confidence of industries in sustaining the
current upsurge in demand. More importantly, the current investment boom is not
triggered by the government but by companies that are optimistic about the
economy’s growth potential and are investing willingly. This is evident from the fact
that the share of private sector in outstanding investment has been rising steadily
from 39% in 2004 to 58% in 2010.
We believe credit demand will continue to grow at a faster rate than India's
nominal GDP as financial depth continues to increase. The need for large capital
formation of 30-35% of GDP for sustaining 8%+ GDP growth in India is well
acknowledged; hence, we expect credit demand to witness a 20% CAGR over
CY2010-14, considering the actual and latent credit demand in India.
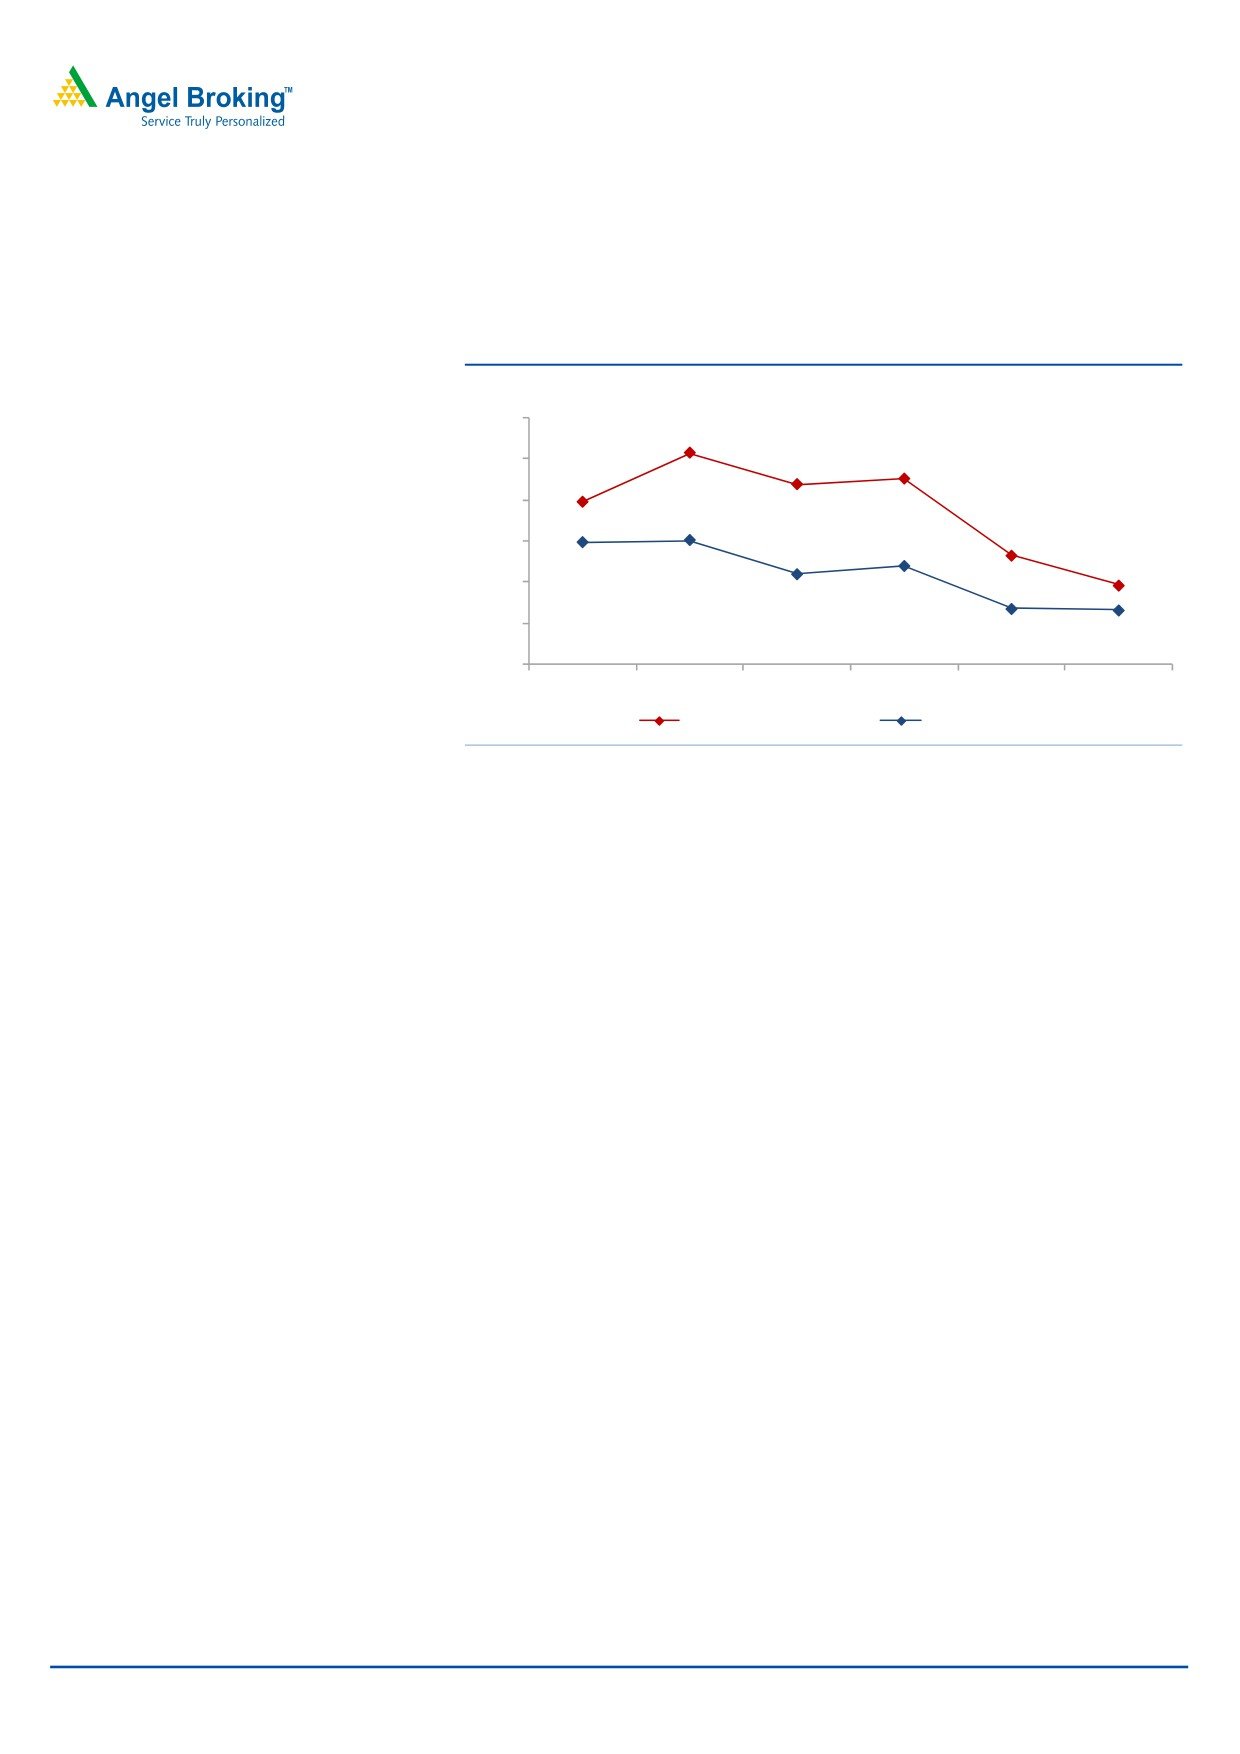
CRISIL has been growing at ~2x India's credit growth since CY2005. Further, the
company will continue to benefit from Basel II norms, as the number of entities to
be rated will increase further. CRISIL, being the market leader with 65% market
January 10, 2010
4
CRISIL | Initiating coverage
share in credit rating, will continue to benefit greatly from India's strong credit
growth. As of September 30, 2010, CRISIL had more than 10,941 ratings
(including 6030 SMEs) outstanding. We conservatively expect the rating business to
register 21% revenue CAGR over CY2010-12.
Exhibit 4: Credit rating business growing on the back of credit growth
(%)
60
51
50
44
45
40
40
27
30
30
30
19
20
24
22
10
14
13.3
-
CY05
CY06
CY07
CY08
CY09
9MCY10
Crisil Ratings Growth
Indian Credit Growth
Source: Company, Angel Research
Robust growth in BLR to continue post Basel II
Post Basel II, CRISIL has seen strong growth in its credit rating segment due to a
boost in bank loan rating (BLR). The company’s credit rating segment witnessed a
38.2% CAGR in revenue over CY2006-09. Till 3QCY2010, CRISIL had 5,017
BLRs, making it the market leader with a market share of 50%.
The BLR market is a much larger market compared to the bond market given the
wide reach of banks and large funds at their disposal vis-à-vis the capital market
participants. There are several incentives for entities to get rated, as they can avail
loans at cheaper rates based on their ratings. On the other hand, banks also stand
to benefit, as they now only need to hold capital reserves to the extent of the risks
they are exposed to, in turn freeing vital capital and reducing costs. Thus, given the
large size of the SME sector and high number of unrated entities under Base II
norms, we believe that the BLR market presents a strong growth opportunity.
January 10, 2010
5
CRISIL | Initiating coverage
Exhibit 5: Potential savings in interest rates on getting rated
Rating
Basel I
Basel II
Capital
Capital
PBT required by
PBT required by bank
Potential reduction
Risk
required
Risk
required
bank
due to lower risk weight
in interest rates
weight (%)
(` cr)
weight (%)
(` cr)
(% to assets)
AAA
100
9
20
1.8
1.4
0.3
1.1
AA
100
9
30
2.7
1.4
0.4
1.0
A
100
9
50
4.5
1.4
0.7
0.7
BBB
100
9
100
9.0
1.4
1.4
-
BB and below/
100
9
150
13.5
1.4
2.1
(0.7)
or unrated exposure
Source: RBI, Note1: Calculations made assuming a bank would like to make a profit of `1cr on a `100cr loan i.e. 1% RoA. Note 2: Unrated exposure above
`10cr will attract 150% risk weight on full transition to Basel II, irrespective of an entity’s actual creditworthiness.
Post 2014, the RBI may shift to the advanced internal ratings methodology under
Basel II norms, where banks can themselves rate entities. However, it is better for
an entity to get rated from a single, well-accepted external agency than getting
rated by multiple banks and increase its cost of rating. Hence, CRISIL being the
market leader will benefit the most from the growing BLR market.
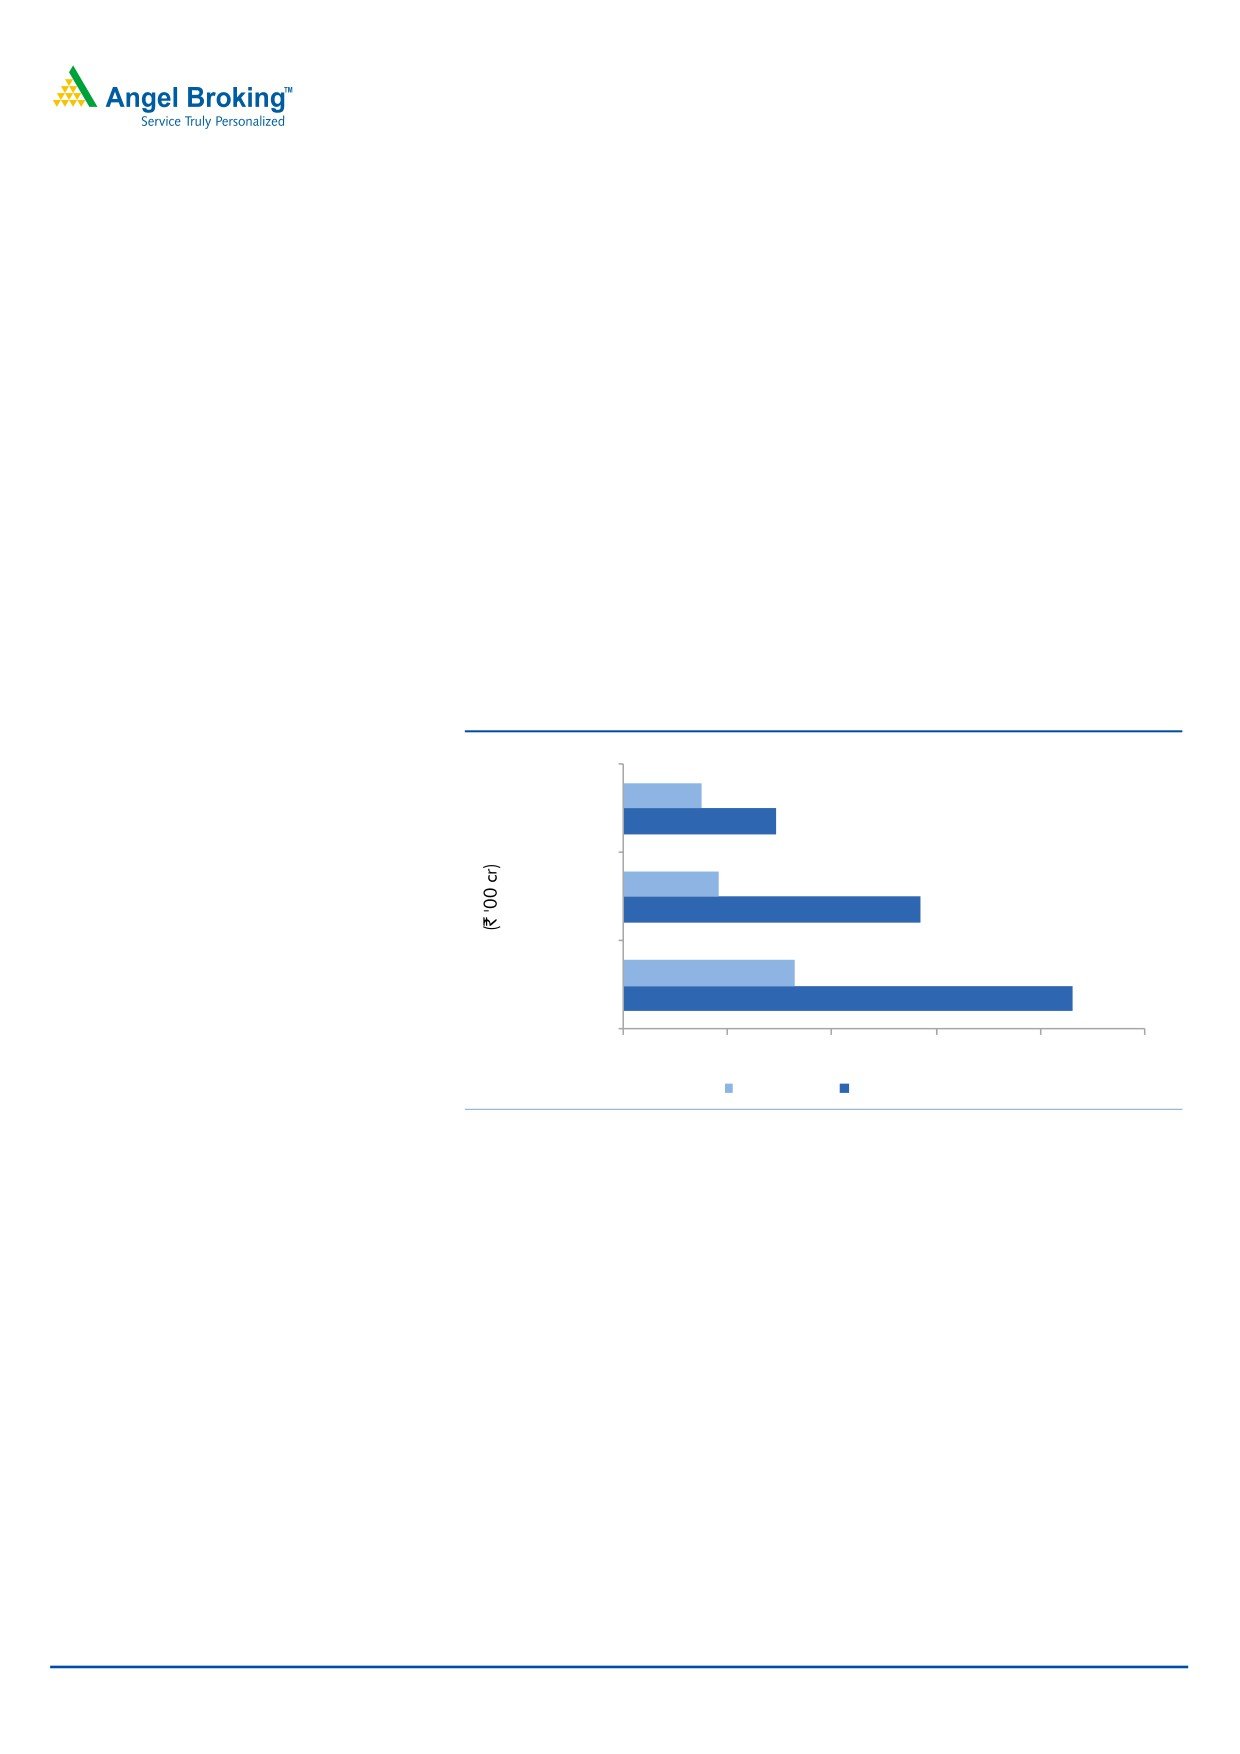
India’s bond issuance growth to fuel further growth in ratings
Bond rating is one of the major contributors to the company’s ratings segment.
India’s corporate bond market is relatively underpenetrated compared to major
developed countries and emerging markets, as corporates in India prefer bank
credit over bonds. However, with the growing capex cycle and infra spends in the
recent years, corporate bond issuance has increased, as it is a cheaper way to
raise money compared to bank loans or equity dilution.
For India to expand at 8-9% in the coming decade, huge capex and infra spends
are required. As per the XIIth Five-Year Plan, the government has announced
US $1tn infrastructure spending. Accordingly, we expect bonds to become a major
source for corporates to raise money to fuel such a huge amount of spending.
Exhibit 6: Indian corporate bond market showing robust growth
Exhibit 7: Largely underpenetrated corporate bond market
(` '00 cr)
(US$ bn)
2,000
1,831
1,400
16
1,200
14
1,600
1,477
12
1,000
10
800
1,200
1,033
8
600
1,150
775
6
719
800
400
4
547
200
464
2
301
359
267
172
47
41
14
400
263
234
0
-
338
411
256
244
309
348
344
346
437
678
0
CY01
CY02
CY03
CY04
CY05
CY06
CY07
CY08
CY09
CY10
Bond Issue Size (` '00 cr)
No. Of Bonds Issued
Annual Bond Issuance (US $CY10)
Corporate Debt/GDP (%)
Source: Bloomberg, Angel Research
Source: IMF, Bloomberg, Angel Research
January 10, 2010
6
CRISIL | Initiating coverage
Infra & advisory services to benefit from huge infra spend
CRISIL’s infrastructure advisory segment provides practical and innovative solutions
to governments, donor-funded agencies and leading organisations, where the
company helps to improve infrastructure service delivery, transform performance of
public institutions and design and strengthen reform programs to catalyse private
sector participation.
Over CY2007-09, CRISIL’s infra and risk advisory segment took a hit due to the
ongoing liquidity crisis. Consequently, the segment’s revenue declined from `107cr
in CY2007 to `60cr in CY2009. However, post the crisis, we expect the segment to
recover at a fast pace and register revenue close to its CY2007 revenue.
CRISIL is set to benefit from the estimated US $800bn spend on infrastructure from
FY2010-14E (US $1tn in the XIIth Five-Year Plan), as it will provide a huge
opportunity to the company to expand its infra and risk advisory services segment.
Accordingly, CRISIL has undertaken aggressive hiring across hierarchy and will
expand its customer base going ahead.
Exhibit 8: Estimated infra and industrial spending
7,415
Industrial
14,642
9,008
Infrastructure
28,349
16,423
Total Investments
42,991
0
10,000
20,000
30,000
40,000
50,000
FY2006-10 FY2011-15E
Source: CRISIL Research, Angel Research
Hence, we expect CRISIL's infra and risk advisory services segment to conservatively
report a 21.7% CAGR over CY2010-12E on account of low revenue base. Despite
such strong growth, the advisory segment is expected to report revenue of `75cr in
CY2012, which will be less than its CY2007 revenue of `107cr. Thus, there could
be significant upside to our estimates.
January 10, 2010
7
CRISIL | Initiating coverage
Exhibit 9: Advisory division to recover due to strong infra spends
(` cr)
120
30.0
107
100
20.0
100
10.0
75
80
-
60
62
60
51
(10.0)
(20.0)
40
(30.0)
20
(40.0)
0
(50.0)
CY07
CY08
CY09
CY10E
CY11E
CY12E
Advisory Revenue
Growth (yoy)
Source: Company, Angel Research
Strong cash reserves to result in buyback, acquisitions and
higher dividends
CRISIL, with its strong cash reserves of `158cr, initiated a buyback of ~1.3lakh
shares worth `80cr for an average price of `6,200/share in CY2010. The
company also purchased Pipal for `58cr. In CY2010, apart from the `75/share
dividend, CRISIL gave a special dividend of `100/share.
Going ahead, we expect this trend to continue with the company paying higher
dividend with payout ratio above 50% in CY2011-12. Also, the company can
initiate another round of buyback in CY2011, as it will have `142cr of cash
reserve post an estimated dividend payout of `150/share in CY2011. CRISIL has
historically taken up many inorganic growth opportunities to fuel its growth and
can easily accept another inorganic growth prospect, given its strong cash reserve
of `242cr by CY2012E.
January 10, 2010
8
CRISIL | Initiating coverage
Outlook and valuation
We expect CRISIL to register a 21.5% CAGR in revenue over CY2010-12E and
continue to maintain its leadership position, with robust growth across all its
segments. The company benefits from its asset-light business model, which is high
on intellectual assets (employee cost-to-sales is around 40%). Further, the company
is debt free and has 40% plus RoE. Additionally, the company enjoys strong
parentage (Standard and Poor's).
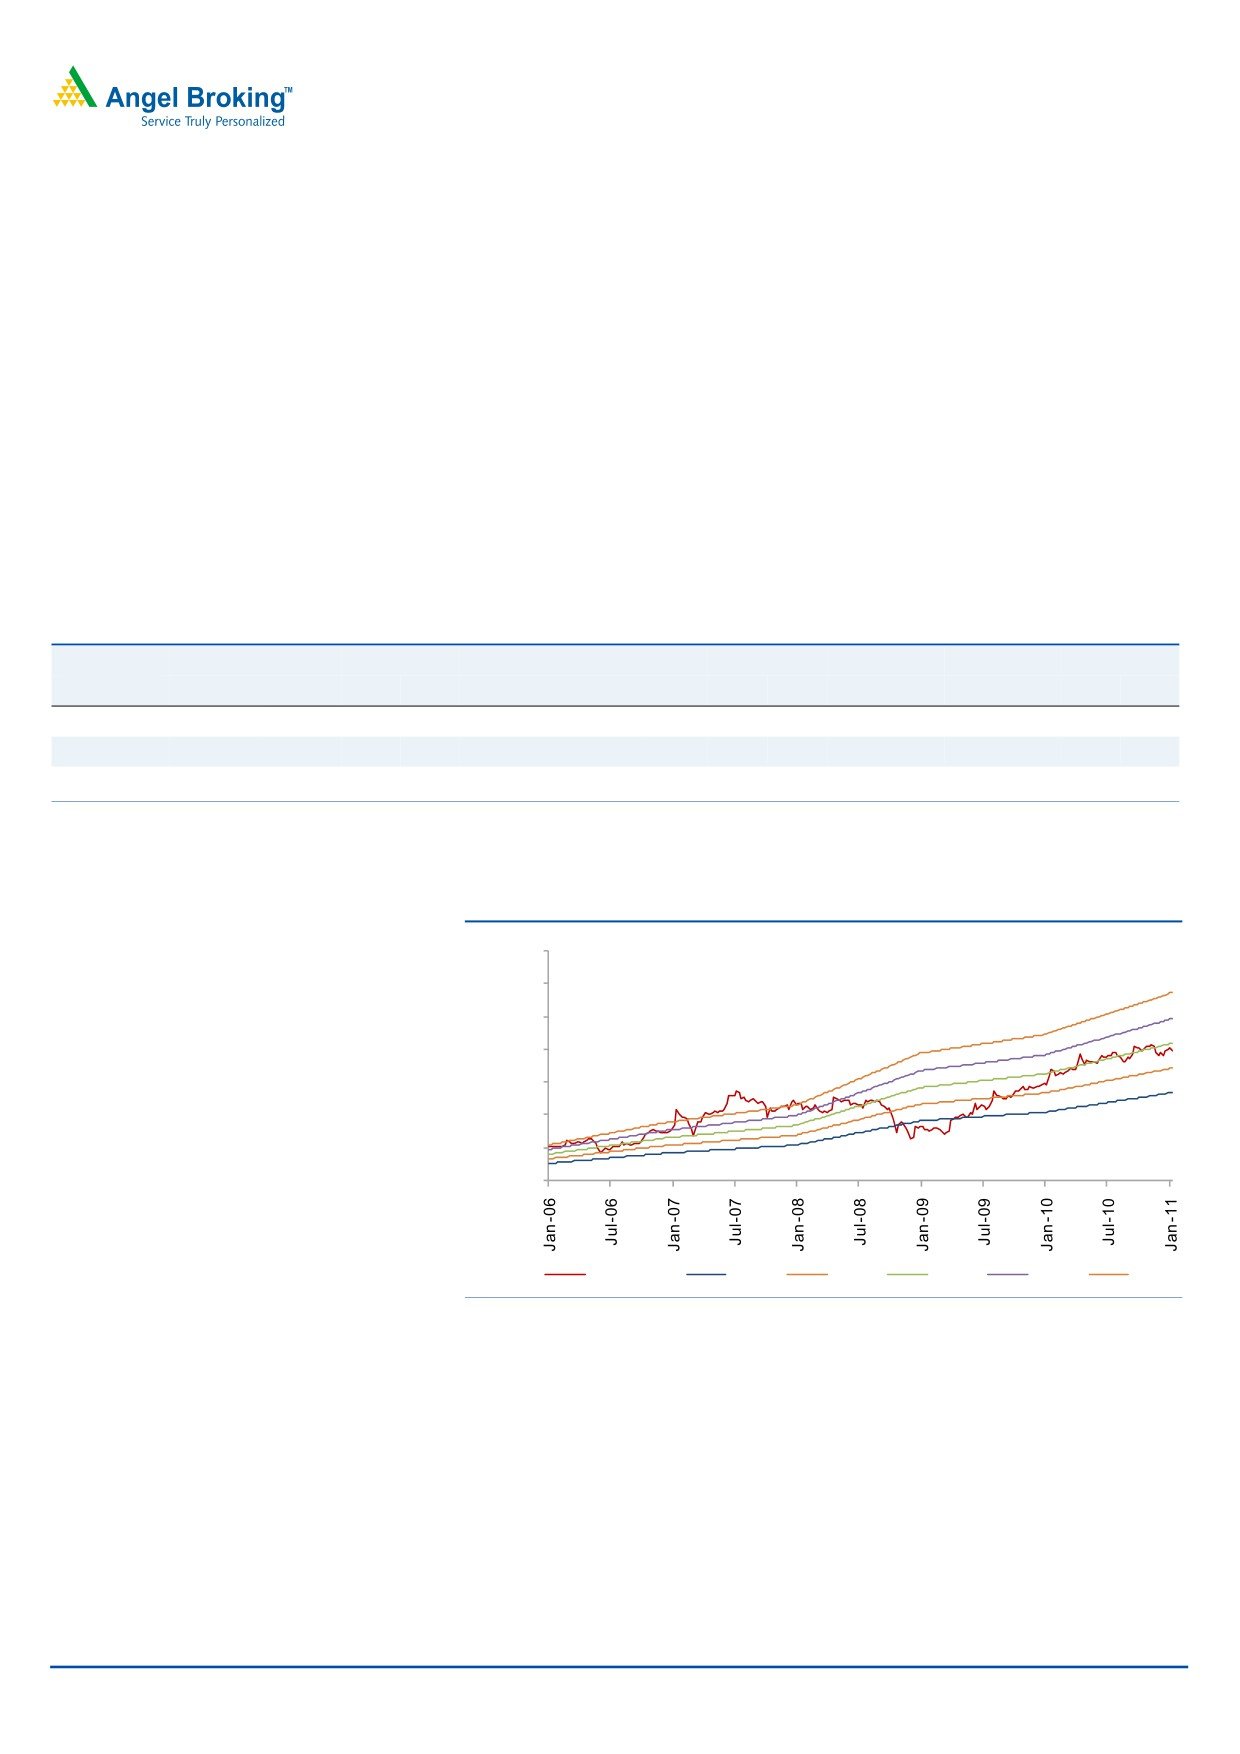
Currently, the stock is available 17.3x CY2012E earnings, which is at the lower
end of its historical range of 16.4-29.9x one-year forward EPS, which makes it
attractive. We Initiate Coverage on the stock with a Buy rating and a Target Price
of `7,584, valuing it at its five-year median of 22x CY2012E earnings and
implying an upside of 27%.
Exhibit 10: Peer comparison
Target Price Mkt. Cap.
Sales
Sales Growth (%)
OPM (%)
EPS (`)
EPS Growth (%)
PER (x)
RoE (%)
(` cr)
(`)
CY11E CY12E CY12E (yoy) CY11E CY12E CY11E CY12E CY12E (yoy) CY11E CY12E CY11E CY12E
CRISIL Angel
7,584
4,245
767
927
20.0
34.3
34.8
282.0
344.7
22.3
21.2
17.3
44.9
46.8
CRISIL Blmberg
N/A
4,245
785
958
22.0
36.5
37.7
282.8
372.9
31.9
21.1
16.0
50.5
53.9
ICRA* Blmberg
N/A
1,165
247
295
19.4
39.0
39.0
72.7
89.2
22.7
16.0
13.1
26.2
26.3
Source: Company, Angel Research, Bloomberg, *FY2012-13E
Exhibit 11: One-year forward P/E band
10,500
9,000
7,500
6,000
4,500
3,000
1,500
0
Price (`)
14x
18x
22x
26x
30x
Source: Company, Angel Research
January 10, 2010
9
CRISIL | Initiating coverage
Concerns
Slowdown in economic growth
CRISIL’s rating business depends on growth in credit demand, which is closely
linked to the economy’s growth. A major part of research revenue is generated
through outsourcing research services to foreign corporate and institution, which
may be affected if economic crisis continues in the near future.
Competition from other players
CRISIL enjoys the highest market share in industry. However, growing competition
from players such as ICRA, CARE, Fitch Rating and Brickwork has seen erosion in
its market share as seen in the case of BLR where CRISIL’s market share has
dipped to 50% in 3QCY2010 from 55% in CY2009. Going forward, this could
result in declining growth and have negative impact on the company’s profitability.
Nonetheless, CRISIL being the market leader since inception is well-placed to fend
off such competition, which we believe is there to stay.
Exhibit 12: Market share still highest amidst intensifying competition
Quarter
Ratings Announced
Market Share (%)
CY2007
15
42
CY2008
842
46
CY2009
2,268
55
3QCY2010
5,017
50
Source: Company, Angel Research
Margins at risk due to fluctuations in forex
CRISIL derives ~53% of its revenue from foreign clients. Thus, the company has a
large exposure to foreign currency and any major fluctuation in forex can lead to
losses, thus affecting margins and profitability.
Wage inflation and attrition rate cause of concern
CRISIL has been facing attrition in excess of 15% over the years. In the face of it,
the company has been incurring significant costs towards acquiring and training
qualified manpower. Also, in its efforts to retain talent, CRISIL has seen an increase
in cost per employee due to inflationary effects. However, it may be noted that it
has been able to increase its profit and revenue per employee over the years
exhibiting strong capability to pass on additional expenses. Overall, we believe
that being a market leader with a strong brand, the company will be able to
manage such pressures and sustain its margins going ahead.
January 10, 2010
10
CRISIL | Initiating coverage
Exhibit 13: Revenue per employee rising despite wage inflation
(` lakh)
30
26.3
24.8
23.1
25
19.4
20
15
9.8
9.6
8.7
10
7.7
7.2
7.4
4.1
4.8
5
0
CY2006
CY2007
CY2008
CY2009
Revenue/Employee Staff expense/Employee Profit/Employee
Source: Company, Angel Research
January 10, 2010
11
CRISIL | Initiating coverage
Financial overview
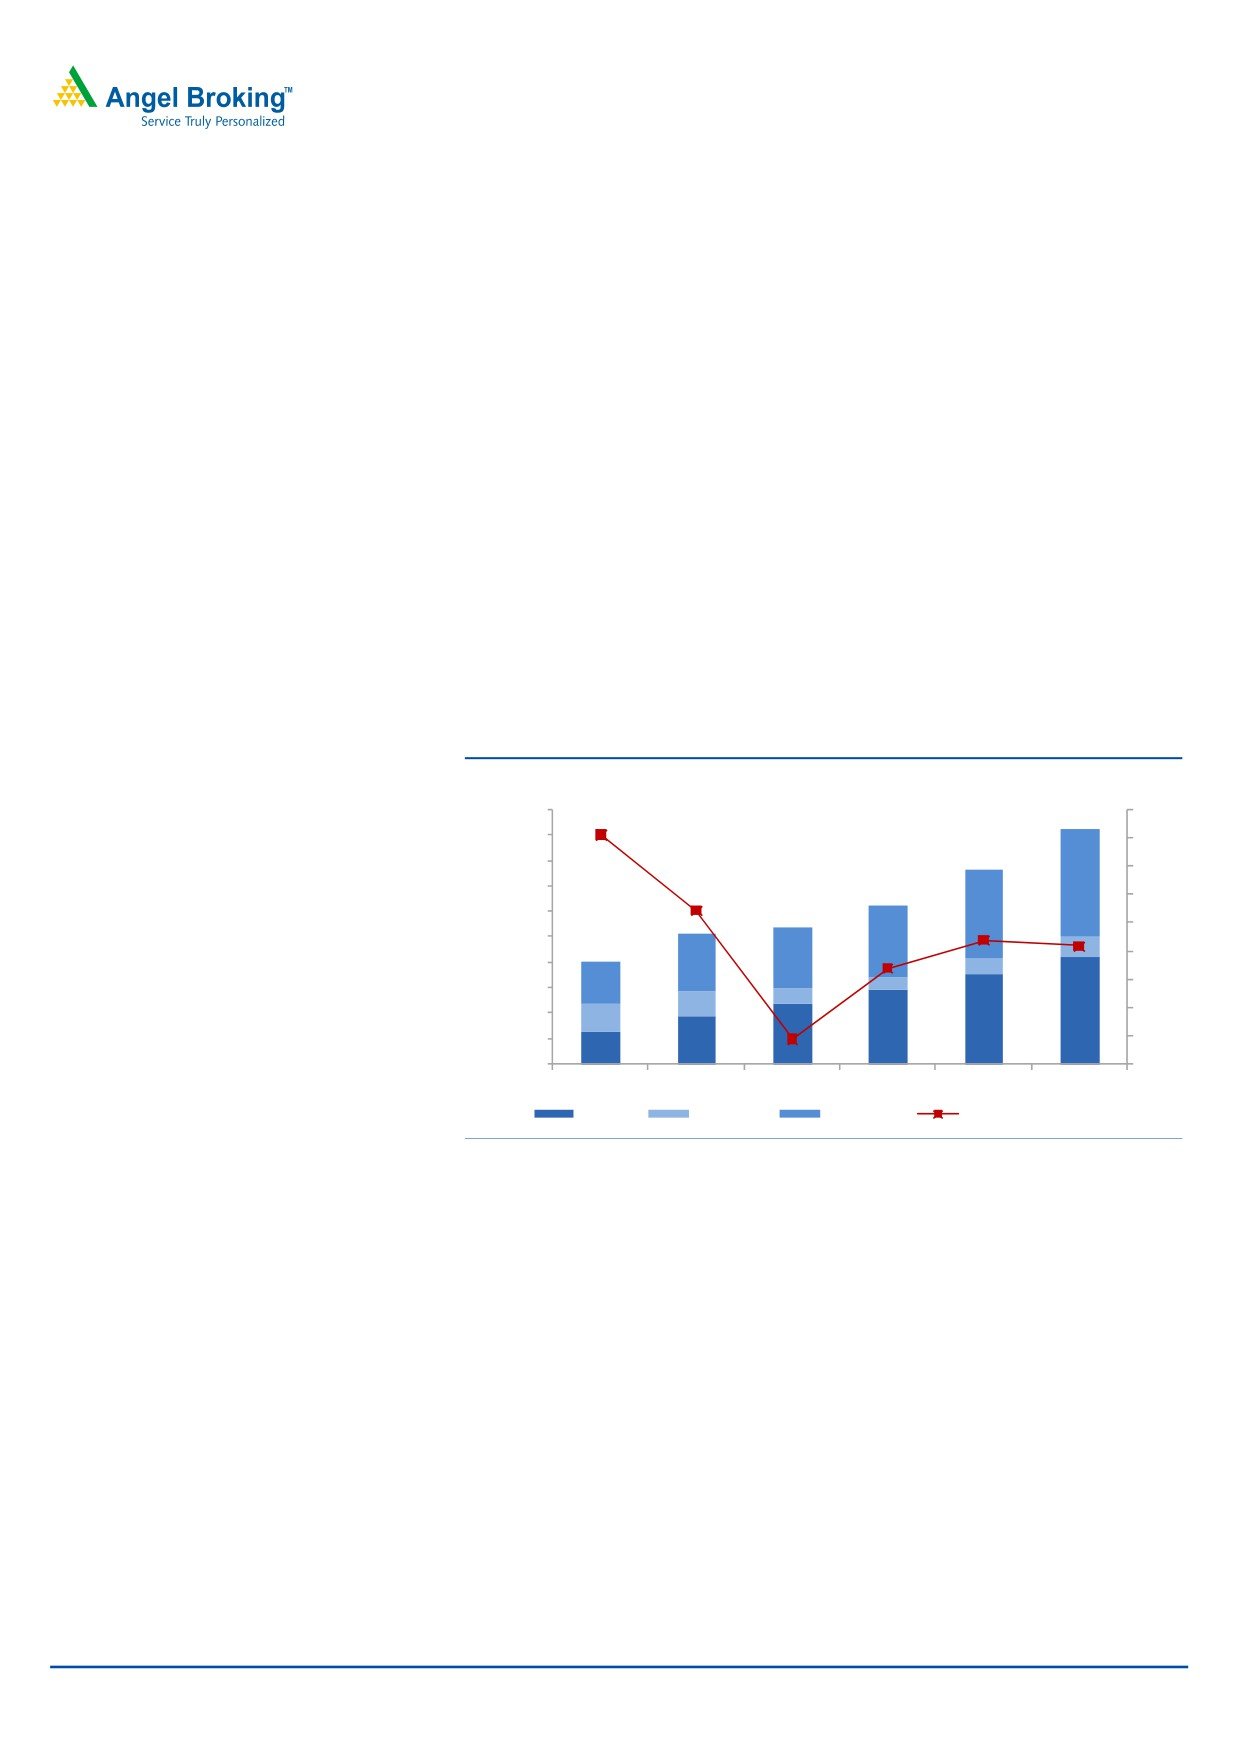
In CY2009, CRISIL registered mediocre growth of 4.4% yoy in revenue, largely due
to the slowdown in capital expenditure during the economic downturn. However,
on the back of a revival in the economy, the company registered robust 16% yoy
growth in revenue for 9MCY2009 to `453.7cr from `391.7cr, aided by strong
growth in the credit rating and research segments.
For 4QCY2010E, we expect strong growth across all segments as the economy is
back on track, with an estimated GDP growth of around 8.5%. For CY2010, we
expect strong top-line growth of `91cr (17%) yoy to `629cr compared to `537cr in
CY2009, largely due to strong growth in the credit rating and research segments,
which are expected to post 22% and 20% yoy growth, respectively. Further, we
expect all segments to register strong growth on the back of robust credit demand,
acquisition of Pipal and strong infrastructure spend in the coming years.
Going ahead, we expect the company's top line to register a 21.5% CAGR over
CY2010-12E, increasing to `767cr in CY2011 and `927cr in CY2012.
Exhibit 14: Strong turnaround in growth due to economic recovery
(` cr)
(%)
1,000
45
900
40
800
35
700
427
30
600
352
25
500
286
75
20
400
226
238
62
168
51
15
300
60
100
10
200
425
107
353
292
239
5
100
189
130
0
0
CY07
CY08
CY09
CY10E
CY11E
CY12E
Rating
Advisory
Research
Total Revenue Growth
Source: Company, Angel Research
EBITDA margins to remain in line
During CY2009, CRISIL’s operating margin improved to 37.1% (34.8%), largely on
the back of cost cutting, which resulted in other expenses coming down to 14% of
revenue in CY2009 versus 18% in CY2008. However, for 9MCY2010, the
operating margin reduced marginally by 4.3% to 32.8% yoy due to higher
employee cost and other expenses, which included forex losses of `7.3cr for
9MCY2010.
CRISIL’s margins, which took a hit in the first two quarters of CY2010, improved to
35.3% in 3QCY2010 due to lower other expenses. For 4QCY2010E, we believe
the company’s EBITDA margin will be at around 34.4%. For CY2010E, we
estimate EBITDA margin of 33.3%, which is expected to come back to its CY2008
levels going ahead and gradually increase to 34.3% and 34.8% in CY2011E and
CY2012E, respectively. EBITDA is estimated to increase from `199cr in CY2009 to
`323cr in FY2012E on the back of strong revenue growth.
January 10, 2010
12
CRISIL | Initiating coverage
Exhibit 15: EBITDA margins expected to remain stable
(` cr)
(%)
350
37.1
40
34.8
34.3
34.8
33.3
300
35
30
250
25
200
20
323
150
263
15
100
199
209
179
10
50
5
0
0
CY08
CY09
CY10E
CY11E
CY12E
EBITDA
Margin
Source: Company, Angel Research
Net profit to register 15% CAGR over CY2009-12E
In CY2009 CRISIL's net profit margin increased by 261bp to 29.9% (27.3%),
primarily because of higher operating margins. For CY2010, we estimate net profit
margin to increase substantially to 32.1% (29.9%) on the back of higher other
income arising from sale of property and investments. For 9MCY2010, net profit
surged 32.6% yoy to `155cr from `117cr due to the 306% yoy spike in other
income. Thus, in CY2010 net profit is expected to increase to `202cr from `161cr
in CY2009.
CRISIL derives a major part of its revenue from exports, which is tax-exempted till
FY2011 under the Software Technology Parks of India’s (STPI) regulations. Going
ahead, this exemption will seize and, thus, the company has started taking
necessary steps such as transferring business to its existing SEZ units, where the
company can continue to avail tax exemption. Management has guided that tax
exemption may be extended till FY2012 under the STPI. If tax exemptions under the
STPI are not extended till FY2012, we expect the company’s tax rate to increase by
~2% in CY2012. For CY2011 and CY2012, we estimate net profit margin to
decline to 26.1% and 26.4% to `200cr and `245cr, respectively, due to lower
other income in CY2011 and CY2012 and higher tax rate in CY2012.
January 10, 2010
13
CRISIL | Initiating coverage
Exhibit 16: PAT margins to come back to historical levels
(` cr)
(%)
300
32.1
35.0
29.9
27.3
26.4
30.0
250
26.1
25.0
200
20.0
150
15.0
100
10.0
50
5.0
141
161
202
200
245
-
-
CY08
CY09
CY10E
CY11E
CY12E
PAT
Margin
Source: Company, Angel Research
January 10, 2010
14
CRISIL | Initiating coverage
Company background
CRISIL was incorporated in 1987 as India’s first credit rating agency. Over the
years, the company has evolved to become the industry leader with a market share
of around 65% and has diversified into research and infrastructure risk and policy
advisory services. The company is currently one of the largest research houses in
the country, providing research to over 65 industries and 150 corporates in India.
The company also provides high-end offshore research and analytical services
mainly to top financial institutions (including six of the world’s top 10 investment
banks), insurance companies and asset management firms.
Credit rating segment
CRISIL is the largest credit rating agency in India. CRISIL pioneered ratings in India
more than 20 years ago and is today the undisputed business leader, with the
largest number of rated entities and products. Over the years, CRISIL has also
developed several structured ratings for multinational entities based on guarantees
from the parent as well as standby letter of credit arrangements from bankers. The
rating agency has also developed a methodology for credit enhancement of
corporate borrowing programmes through the use of partial guarantees. CRISIL is
uniquely placed in its experience in understanding the extent of credit
enhancement arising out of such structures. CRISIL’s comprehensive offerings
include ratings for long-term instruments such as debentures/bonds and
preference shares, structured obligations (including asset-backed securities) and
fixed deposits. The company also rates short-term instruments such as commercial
paper programmes and short-term deposits.
Bank Loan Ratings (Basel II)
CRISIL commenced rating bank loans post the RBI’s guidelines on capital
adequacy for banks in 2007. Basel II guidelines, as they are called, require banks
to provide capital on credit exposure as per credit ratings assigned by approved
external credit assessment institutions (ECAIs), such as CRISIL. Basel II is a
recommendatory framework for banking supervision issued by the Basel
Committee on Banking Supervision in June 2004. The objective of Basel II is to
bring about international convergence of capital measurement and standards in
the banking system. The revised framework for capital adequacy has been effective
from March 31, 2008, for all Indian banks with an operational presence outside
India (12 public sector banks and five private sector banks) and for all foreign
banks operating in India. It has been applicable to all other commercial banks
(except local area banks and regional rural banks) from March 31, 2009.
CRISIL rates the maximum number of companies for their bank loans in India. As
of September 30, 2010, CRISIL had rated 5,017 entities, representing over 50% of
all the companies, which have their bank loans rated in India; CRISIL has rated
bank facilities of all types: term loans, project loans, corporate loans, general
purpose loans, working capital demand loans, cash credit facilities and non-fund-
based facilities, such as letters of credit and bank guarantees.
January 10, 2010
15
CRISIL | Initiating coverage
Exhibit 17: Distribution of Bank Loan Ratings by loan size
Loan Size
No. of ratings upto
% of total
No. of ratings upto
% of total
(` cr)
1QCY2009
2008
1QCY2010
2009
<10
70
5
503
13
10-25
270
19
1,232
32
25-50
234
17
764
20
50-250
553
40
977
26
250-500
112
8
161
4
>500
161
12
188
5
Total
1,400
100
3,825
100
Source: Company, Angel Research, Data available only till 1QCY2010, 5017 entities rated till
3QCY2010.
SME Ratings
CRISIL pioneered the concept of ratings for the SME sector in India and, presently,
within a span of just five years, has the largest number of ratings on the SME sector
in the world. As of September 30, 2010, CRISIL had assigned ratings to over
14,500 SMEs. CRISIL's SME ratings are affordable and tailor-made services
designed for SMEs.
Real Estate Ratings
Housing and real estate form the backbone of the country's infrastructure and are
critical drivers of economic development. With government policies emphasising
faster economic growth, the real estate sector is attracting large investments from
both domestic and foreign investors. Investors and customers, however, need to
exercise caution in their exposure, as the sector is largely unorganised.
Given the risk factors and volatility inherent in the real estate business, it is critical
to judge the performance ability of developers to deliver good quality projects.
Towards this end, CRISIL provides third-party opinion through two specialised
products: National Developer Ratings and Real Estate Star Ratings.
Research
CRISIL Research: CRISIL’s research segment is India’s leading independent,
integrated research house. Through constant innovation and comprehensive
research offerings covering the economy, industry and companies, CRISIL Research
meets the requirements of more than 750 Indian and global clients. Apart from
off-the-shelf research reports, CRISIL provides incisive, customised research.
Through its IPO grading initiative, CRISIL Research has also established a presence
in the equity research domain and is poised to significantly expand its presence in
this area.
Outsourcing (Irevna and Pipal): CRISIL’s outsourcing department consists of Irevna
and the recently acquired Pipal. Irevna was one of the pioneers of offshore
investment research for some of the world’s leading investment banks and
financial institutions. It is one of the most experienced and diversified provider of
analytical services to the financial services industry, supporting equity research,
equity strategy, credit research, securitisation research, and derivatives IT and
January 10, 2010
16
CRISIL | Initiating coverage
structuring. Irevna has offices across the world in the US, the UK, Poland,
Argentina and Hong Kong and its Indian offices are at Mumbai and Chennai.
Pipal is a leading custom research firm, delivering financial and business research
and quantitative analytics to organisations worldwide. Founded in 2001 by a team
of management professionals, Pipal created a name for itself as a knowledge
vendor of choice.
January 10, 2010
17
CRISIL | Initiating coverage
Advisory
CRISIL Infrastructure Advisory: CRISIL’s infrastructure advisory segment provides
practical and innovative solutions to governments, donor-funded agencies and
leading organisations in over 20 emerging economies across the world. It has
widely acknowledged policy advisory expertise and specialises in commercial and
contractual issues in the areas of energy, urban infrastructure and public-private
partnerships. CRISIL Infrastructure Advisory has built a unique position for itself in
these domains and is the preferred consultant to governments, multilateral lending
agencies and private sector clients.
CRISIL Risk: This segment provides risk solutions for banks, financial institutions,
mutual funds and corporates. It also provides risk management services,
consulting and software products in the areas of credit, market and operational
risk. It partners closely with leading public and private sector banks and entities in
the financial services and insurance sectors, implementing enterprise-wide risk
management solutions.
January 10, 2010
18
CRISIL | Initiating coverage
Profit & Loss Statement (Consolidated)
Y/E Dec.
CY2008
CY2009
CY2010E
CY2011E
CY2012E
Net Sales
515
537
629
767
927
% chg
27.3
4.4
17.0
22.0
20.0
Total Expenditure
335
338
419
504
605
Establishment Expenses
52
55
64
78
92
Other Expenses
93
75
94
115
138
Personnel
191
208
261
311
375
EBITDA
179
199
209
263
323
% chg
52.8
11.3
5.0
25.7
22.7
(% of Net Sales)
34.8
37.1
33.3
34.3
34.8
Depreciation& Amortisation
14
15
21
24
26
EBIT
165
184
188
239
297
% chg
63.0
11.5
1.9
27.0
24.4
(% of Net Sales)
32.1
34.3
29.9
31.1
32.0
Interest & other Charges
-
-
-
-
-
Other Income
22
23
72
20
27
(% of PBT)
11.6
11.1
27.8
7.6
8.3
Recurring PBT
187
207
260
258
324
% chg
69.1
10.9
25.4
(0.8)
25.5
PBT (reported)
187
207
260
258
324
Tax
46
47
59
58
79
(% of PBT)
24.8
22.5
22.5
22.5
24.5
PAT (reported)
141
161
202
200
245
% chg
68.0
14.4
25.4
(0.8)
22.3
Prior period items
-
-
-
-
-
PAT after MI (reported)
141
161
202
200
245
Extraordinary Income (post tax)
-
-
45
-
-
ADJ. PAT
141
161
157
200
245
% chg
68.0
14.4
(2.5)
27.7
22.3
(% of Net Sales)
27.3
29.9
24.9
26.1
26.4
Basic EPS (Rs)
194.6
222.5
284.2
282.0
344.7
Fully Diluted EPS (Rs)
194.6
222.5
284.2
282.0
344.7
% chg
68.0
14.4
27.7
(0.8)
22.3
January 10, 2010
19
CRISIL | Initiating coverage
Balance Sheet (Consolidated)
Y/E Dec.
CY2008 CY2009 CY2010E CY2011E CY2012E
SOURCES OF FUNDS
Equity Share Capital
7.2
7.2
7.1
7.1
7.1
Reserves& Surplus
350
427
401
476
555
Shareholders Funds
358
434
408
483
562
Total Loans
-
-
-
-
-
Deferred Tax Liability
-
-
-
-
-
Total Liabilities
358
434
408
483
562
APPLICATION OF FUNDS
Gross Block
190
192
300
324
330
Less: Acc. Depreciation
64
72
93
118
143
Net Block
126
120
207
206
187
Capital Work-in-Progress
4
64
14
-
-
Investments
118
118
118
118
118
Current Assets
261
323
255
370
507
Cash
129
158
64
142
242
Loans & Advances
53
62
68
75
82
Other Current Assets
2
11
12
12
13
Debtors
77
92
112
141
170
Other
-
-
-
-
-
Current liabilities
160
200
195
221
260
Net Current Assets
101
122
60
150
247
DEFERRED TAX ASSETS (Net)
8
10
10
10
10
Total Assets
358
434
408
483
562
January 10, 2010
20
CRISIL | Initiating coverage
Cash Flow (Consolidated)
Y/E Dec.
CY2008 CY2009 CY2010E CY2011E CY2012E
Profit before tax
187
207
260
258
324
Depreciation
14
15
21
24
26
Change in Working Capital
36
16
(25)
(4)
9
Less: Other income
22
23
72
20
27
Direct taxes paid
46
47
59
58
79
Cash Flow from Operations
169
169
126
201
253
Inc./ (Dec.) in Fixed Assets
0
(62)
(58)
(10)
(6)
Inc./ (Dec.) in Investments
(21)
1
-
-
-
Inc./ (Dec.) in loans and advances
(12)
(9)
(6)
(7)
(7)
Other income
22
23
72
20
27
Cash Flow from Investing
(11)
(47)
8
3
13
Issue/(Buy Back) of Equity
-
-
(79)
-
-
Inc./(Dec.) in loans
-
-
-
-
-
Dividend Paid (Incl. Tax)
(59)
(85)
(148)
(125)
(166)
Others
(12)
(9)
-
-
-
Cash Flow from Financing
(71)
(93)
(227)
(125)
(166)
Inc./(Dec.) in Cash
87
28
(94)
79
100
Opening Cash balances
42
129
158
64
142
Closing Cash balances
129
158
64
142
242
January 10, 2010
21
CRISIL | Initiating coverage
Key Ratios
Y/E Dec.
CY2008 CY2009
CY2010E CY2011E
CY2012E
Valuation Ratio (x)
P/E (on FDEPS)
30.7
26.9
21.0
21.2
17.3
P/BV
12.1
10.0
10.4
8.8
7.6
Dividend yield (%)
1.2
1.7
2.9
2.5
3.3
Market cap. / Sales
8.2
7.9
6.7
5.5
4.6
EV/Sales
8.0
7.6
6.6
5.3
4.3
EV/EBITDA
23.0
20.5
20.0
15.6
12.4
EV / Total Assets
11.5
9.4
10.2
8.5
7.1
Per Share Data (Rs)
EPS (Basic)
194.6
222.5
284.2
282.0
344.7
EPS (fully diluted)
194.6
222.5
284.2
282.0
344.7
Cash EPS
213.4
243.1
314.3
316.3
380.9
DPS
70.0
100.0
175.0
150.0
200.0
Book Value
494.8
600.4
574.9
681.3
791.8
Dupont Analysis (%)
EBIT margin
32.1
34.3
29.9
31.1
32.0
Tax retention ratio
75.2
77.5
77.5
77.5
75.5
Asset turnover (x)
4.2
4.0
3.3
3.4
4.4
ROIC (Post-tax)
100.9
106.4
75.5
82.1
105.2
Operating ROE
100.9
106.4
75.5
82.1
105.2
Returns (%)
ROCE (Pre-tax)
52.2
46.6
44.6
53.6
56.8
Angel ROIC (Pre-tax)
141.2
183.6
122.0
109.4
139.4
ROE
44.3
40.6
47.9
44.9
46.8
Turnover ratios (x)
Asset Turnover (Gross Block)
2.7
2.8
2.6
2.5
2.8
Asset Turnover (Net Block)
4.0
4.4
3.8
3.7
4.7
Asset Turnover (Total Assets)
1.6
1.4
1.5
1.7
1.8
Operating Income / Invested Capital
4.2
4.0
3.3
3.4
4.4
Receivables (days)
59
58
59
60
61
Payables (days)
104
122
115
99
95
Working capital cycle (ex-cash) (days)
(11)
(21)
(11)
1
2
January 10, 2010
22
CRISIL | Initiating coverage
Research Team Tel: 022 - 39357800
DISCLAIMER
This document is solely for the personal information of the recipient, and must not be singularly used as the basis of any investment
decision. Nothing in this document should be construed as investment or financial advice. Each recipient of this document should make
such investigations as they deem necessary to arrive at an independent evaluation of an investment in the securities of the companies
referred to in this document (including the merits and risks involved), and should consult their own advisors to determine the merits and
risks of such an investment.
Angel Broking Limited, its affiliates, directors, its proprietary trading and investment businesses may, from time to time, make
investment decisions that are inconsistent with or contradictory to the recommendations expressed herein. The views contained in this
document are those of the analyst, and the company may or may not subscribe to all the views expressed within.
Reports based on technical and derivative analysis center on studying charts of a stock's price movement, outstanding positions and
trading volume, as opposed to focusing on a company's fundamentals and, as such, may not match with a report on a company's
fundamentals.
The information in this document has been printed on the basis of publicly available information, internal data and other reliable
sources believed to be true, but we do not represent that it is accurate or complete and it should not be relied on as such, as this
document is for general guidance only. Angel Broking Limited or any of its affiliates/ group companies shall not be in any way
responsible for any loss or damage that may arise to any person from any inadvertent error in the information contained in this report.
Angel Broking Limited has not independently verified all the information contained within this document. Accordingly, we cannot testify,
nor make any representation or warranty, express or implied, to the accuracy, contents or data contained within this document. While
Angel Broking Limited endeavours to update on a reasonable basis the information discussed in this material, there may be regulatory,
compliance, or other reasons that prevent us from doing so.
This document is being supplied to you solely for your information, and its contents, information or data may not be reproduced,
redistributed or passed on, directly or indirectly.
Angel Broking Limited and its affiliates may seek to provide or have engaged in providing corporate finance, investment banking or
other advisory services in a merger or specific transaction to the companies referred to in this report, as on the date of this report or in
the past.
Neither Angel Broking Limited, nor its directors, employees or affiliates shall be liable for any loss or damage that may arise from or in
connection with the use of this information.
Note: Please refer to the important `Stock Holding Disclosure' report on the Angel website (Research Section). Also, please
refer to the latest update on respective stocks for the disclosure status in respect of those stocks. Angel Broking Limited and
Disclosure of Interest Statement
Crisil
1. Analyst ownership of the stock
No
2. Angel and its Group companies ownership of the stock
No
3. Angel and its Group companies' Directors ownership of the stock
No
4. Broking relationship with company covered
No
Note: We have not considered any Exposure below `1 lakh for Angel, its Group companies and Directors.
Ratings (Returns) :
Buy (> 15%)
Accumulate (5% to 15%)
Neutral (-5 to 5%)
Reduce (-5% to 15%)
Sell (< -15%)
January 10, 2010
23
CRISIL | Initiating coverage
6th Floor, Ackruti Star, Central Road, MIDC, Andheri (E), Mumbai- 400 093.
Tel: (022) 39357800
Research Team
Fundamental:
Sarabjit Kour Nangra
VP-Research, Pharmaceutical
Vaibhav Agrawal
VP-Research, Banking
Vaishali Jajoo
Automobile
Shailesh Kanani
Infrastructure
Rupesh Sankhe
Cement, Power
Param Desai
Real Estate, Logistics, Shipping
Sageraj Bariya
Fertiliser, Mid-cap
Paresh Jain
Metals & Mining
John Perinchery
Capital Goods
Srishti Anand
IT, Telecom
Jai Sharda
Mid-cap
Sharan Lillaney
Mid-cap
Naitik Mody
Mid-cap
Chitrangda Kapur
FMCG, Media
Amit Vora
Research Associate (Oil & Gas)
V Srinivasan
Research Associate (Cement, Power)
Mihir Salot
Research Associate (Logistics, Shipping)
Pooja Jain
Research Associate (Metals & Mining)
Yaresh Kothari
Research Associate (Automobile)
Shrinivas Bhutda
Research Associate (Banking)
Sreekanth P.V.S
Research Associate (FMCG, Media)
Hemang Thaker
Research Associate (Capital Goods)
Nitin Arora
Research Associate (Infra, Real Estate)
Ankita Somani
Research Associate (IT, Telecom)
Varun Varma
Research Associate (Banking)
Vasant Lohiya
Research Associate (Banking)
Technicals:
Shardul Kulkarni
Sr. Technical Analyst
Mileen Vasudeo
Technical Analyst
Derivatives:
Siddarth Bhamre
Head - Derivatives
Jaya Agarwal
Derivative Analyst
Institutional Sales Team:
Mayuresh Joshi
VP - Institutional Sales
Abhimanyu Sofat
AVP - Institutional Sales
Pranav Modi
Sr. Manager
Ganesh Iyer
Sr. Manager
Jay Harsora
Manager
Meenakshi Chavan
Dealer
Gaurang Tisani
Dealer
Production Team:
Bharathi Shetty
Research Editor
Simran Kaur
Research Editor
Bharat Patil
Production
Dilip Patel
Production
Angel Broking Ltd: BSE Sebi Regn No : INB 010996539 / CDSL Regn No: IN - DP - CDSL - 234 - 2004 / PMS Regn Code: PM/INP000001546 Angel Securities Ltd:BSE: INB010994639/INF010994639 NSE: INB230994635/INF230994635 Membership numbers: BSE 028/NSE:09946
Angel Capital & Debt Market Ltd: INB 231279838 / NSE FNO: INF 231279838 / NSE Member code -12798 Angel Commodities Broking (P) Ltd: MCX Member ID: 12685 / FMC Regn No: MCX / TCM / CORP / 0037 NCDEX : Member ID 00220 / FMC Regn No: NCDEX / TCM / CORP / 0302
January 10, 2010
24