Advisory Desk
May 16, 2012
Cravatex
BUY
Cravatex Ltd. (Cravatex) is a market leader in providing fitness equipment
CMP
`655
distribution under its brand Proline Fitness and represents the 100-year old Italian
Target Price
`800
brand, FILA, in India. Cravatex has recently acquired sub-license to distribute the
Investment Period
12 Months
products of FILA in the United Kingdom (UK) and Ireland. The company has also
been forming strategic partnerships with various health club chains in India such as
Talwalkars and Gold Gym in the fitness equipment segment. Cravatex is trading at
an attractive 9.8x PE and 0.5x EV/Sales on FY2014E. We recommend Buy on
Cravatex with a target price of `800, based on target PE of 12x and implied
EV/Sales of 0.6x for FY2014E
Investment rationale
Strategic partnership and organic growth to drive 45% growth
Owing to robust organic growth and strategic partnerships the net revenue for the
fitness equipment segment is expected to grow at 45% CAGR over FY2011-14E.
Cravatex is a market leader in fitness equipment distribution and operates through
a wide network of 51 retail stores across India. The company has recently entered
into strategic partnership with reputed health club chains in India such as
Talwalkars and Gold Gym to provide them with high-quality equipment and
customer service.
Sportswear segment to grow at 67% CAGR
On the back of acquisition of subsidiary, M/s BB (UK) Ltd, Cravatex aims to acquire
sub-license for certain distribution channels for FILA in the UK and Ireland. The
subsidiary will design, develop and supply FILA apparel to other markets in Europe.
The acquisition is expected to deliver potential annual revenue of around £10mn
for the next two years. Overall revenue from the sportswear segment is therefore
expected to grow at CAGR of 67% over FY2011-14E.
Strong parentage of FILA
FILA is a 100-year old Italian sportswear brand with a strong parentage in sports
apparel, sports accessories and sports footwear industry. The brand plans to set up
60-70 stores across India by 2014. FILA has plans to be present in almost all large
retail formats such as Shoppers Stop, Westside and Lifestyle. Kim Clijsters, US open
singles champion is the brand ambassador for FILA.
Outlook and valuation
Cravatex’ net revenue is expected to grow at a 58% CAGR over FY2011-14E.
EBITDA for the company is expected to grow from `6.9cr in FY2011 to `21cr in
FY2014E, at a 45% CAGR. Net profit of the company is expected to grow from
`6.4cr in FY2011 to `17.2cr in FY2014E. At the CMP of `655, the stock is trading
at PE of 9.8x and EV/Sales of 0.5x of FY2014E. We recommend Buy on Cravatex
with a target price of `800, offering an upside of 22% from current levels.
Key financials
Cravatex Net sales OPM PAT
EPS ROIC
P/E P/BV EV/ EBITDA EV/ Sales
(` cr)
(%)
(` cr)
(`)
(%)
(x)
(x)
(x)
(x)
FY2011
93
7.4
6
25
15
26.5
7.1
27.1
2.0
FY2012E
230
5.7
9
36
21
18.1
5.3
14.7
0.8
FY2013E
301
4.3
11
42
18
15.5
4.0
14.9
0.6
Twinkle Gosar
Tel: 022- 3935 7800 Ext: 6848
FY2014E
361
5.8
17
67
24
9.8
2.9
9.1
0.5
Source: Company, Angel Research
Please refer to important disclosures at the end of this report
1
Advisory Desk
Cravatex
Investment arguments
Strategic partnership and organic growth to drive 45% growth
Cravatex is a market leader in fitness equipment distribution through its brand
Proline Fitness. The company distributes products of Johnson Health Tech, the third
largest fitness company in the world. Cravatex operates through a wide network of
51 retail stores across India.
The company has recently entered into strategic partnership with reputed health
club chains in India such as Talwalkars and Gold Gym to provide them with high-
quality equipment and customer service. Talwalkars’ expectation of around 30%
growth in its business provides growth visibility for Cravatex.
Owing to robust organic growth and strategic partnerships the net revenue for the
fitness equipment segment is expected to grow at 45% CAGR over FY2011-14E.
Healthy lifestyle and underpenetration provide growth visibility
The base for people using fitness equipment or enrolling for fitness programs is
expanding rapidly, with an increase in the standard of living of people and
increased awareness about fitness.
In 2010, ~39% of India’s total population of 1.2bn was in the 20-44 years age
group. According to Planning Commission of India, the country’s population is
expected to increase to 1.3bn by 2020. Thus, the company will also have a
significant base of potential consumers - even if a modest 1% of the country’s
population aged 20-44 years is concerned about fitness.
The Indian fitness industry is highly underpenetrated compared to developed
countries, with only 0.4% population compared to 16% in the US possessing
membership in fitness clubs in 2008 (as per The IHRSA Asia Pacific Market Report
2008). This provides a potential opportunity to the company.
Increased urban disposable income
According to Mckinsey Global Institute’s recent research study, India’s urban
population is expected to rise from 340mn in 2008 to 590 mn in 2030,
urbanization rate of 40% (lower than seen in most Asian countries due to strict
definition of Indian Census).The average household disposable income in urban
areas is expected to grow at CAGR of 6.4% from ~`60,000 in 2008 to
~`239,000 in
2030 with an overall growth rate of
6.1% to
~`136,000
considering the GDP growth rate of 7.4%. Thus, with such a rise in disposable
income it provides strong growth visibility for the company’s fitness segment.
Sportswear segment to grow at 67% CAGR
Cravatex has acquired 100% of M/s BB (UK) Ltd., which is its wholly owned
subsidiary with effect from February 2011. Through this subsidiary, Cravatex aims
to acquire sub-license for certain distribution channels for FILA in the UK and
Ireland. The subsidiary will design, develop and supply FILA apparel to other
markets in Europe. The acquisition is expected to deliver potential annual revenue
of around £10mn for the next two years. Overall revenue from the sportswear
segment is therefore expected to grow at CAGR of 67% over FY2011-14E.
May 16, 2012
2
Advisory Desk
Cravatex
Strong parentage of FILA
FILA is a 100-year old Italian sportswear brand with a strong parentage in sports
apparel, sports accessories and sports footwear industry. The brand plans to set up
60-70 stores across India by 2014. FILA has plans to be present in almost all large
retail formats such as Shoppers Stop, Westside and Lifestyle. Kim Clijsters, US open
singles champion is the brand ambassador for FILA.
Sports events to provide growth opportunities
The Indian sportswear industry is at a nascent stage with increasing organized
retail space. Increasing number of sports events and activities such as CWG and
IPL are also providing scope and growth opportunities for players in the industry.
Thus, on the back of mounting popularity of sports with increasing number of
events the sportswear industry is expected to grow at a CAGR 15% over 2011-14
as per the company’s estimation.
May 16, 2012
3
Advisory Desk
Cravatex
Financials
Key assumptions
Revenue from the sportswear segment is expected to grow at a CAGR of 67% over
FY2011-14E, owing to acquisition of the sub-license for distribution through
specified channels in the UK and Ireland. It is also expected that the retail-led
approach of FILA along with government’s reform to allow up to 51% FDI in the
retail sector will together enhance the company’s earnings.
In case of the fitness equipment segment, revenue is expected to grow at a CAGR
of 45% over FY2011-14E on the back of expansion plans of health club chains
such as Talwalkars and Gold Gym, with whom the company has signed strategic
partnerships. Also, Cravatex plans to expand its existing network of retail stores,
which will provide it greater visibility among retail consumers.
Exhibit 1: Key assumptions
Particulars
FY2010 FY2011 FY2012E FY2013E FY2014E
Total revenue growth (%)
32.2
58.4
148.5
30.7
20.2
Sportswear segment
Volume growth (%)
66.1
49.0
125.0
5.0
5.0
Change in price/unit (%)
49.5
33.4
22.2
33.4
14.3
Revenue growth (%)
148.2
98.8
175.0
40.0
20.0
Fitness equipment segment
Volume growth (%)
(10.2)
12.8
90.0
10.0
14.0
Change in price/unit (%)
5.1
7.9
10.5
7.3
7.9
Revenue growth (%)
(5.6)
21.7
110.0
18.0
23.0
Source: Angel Research
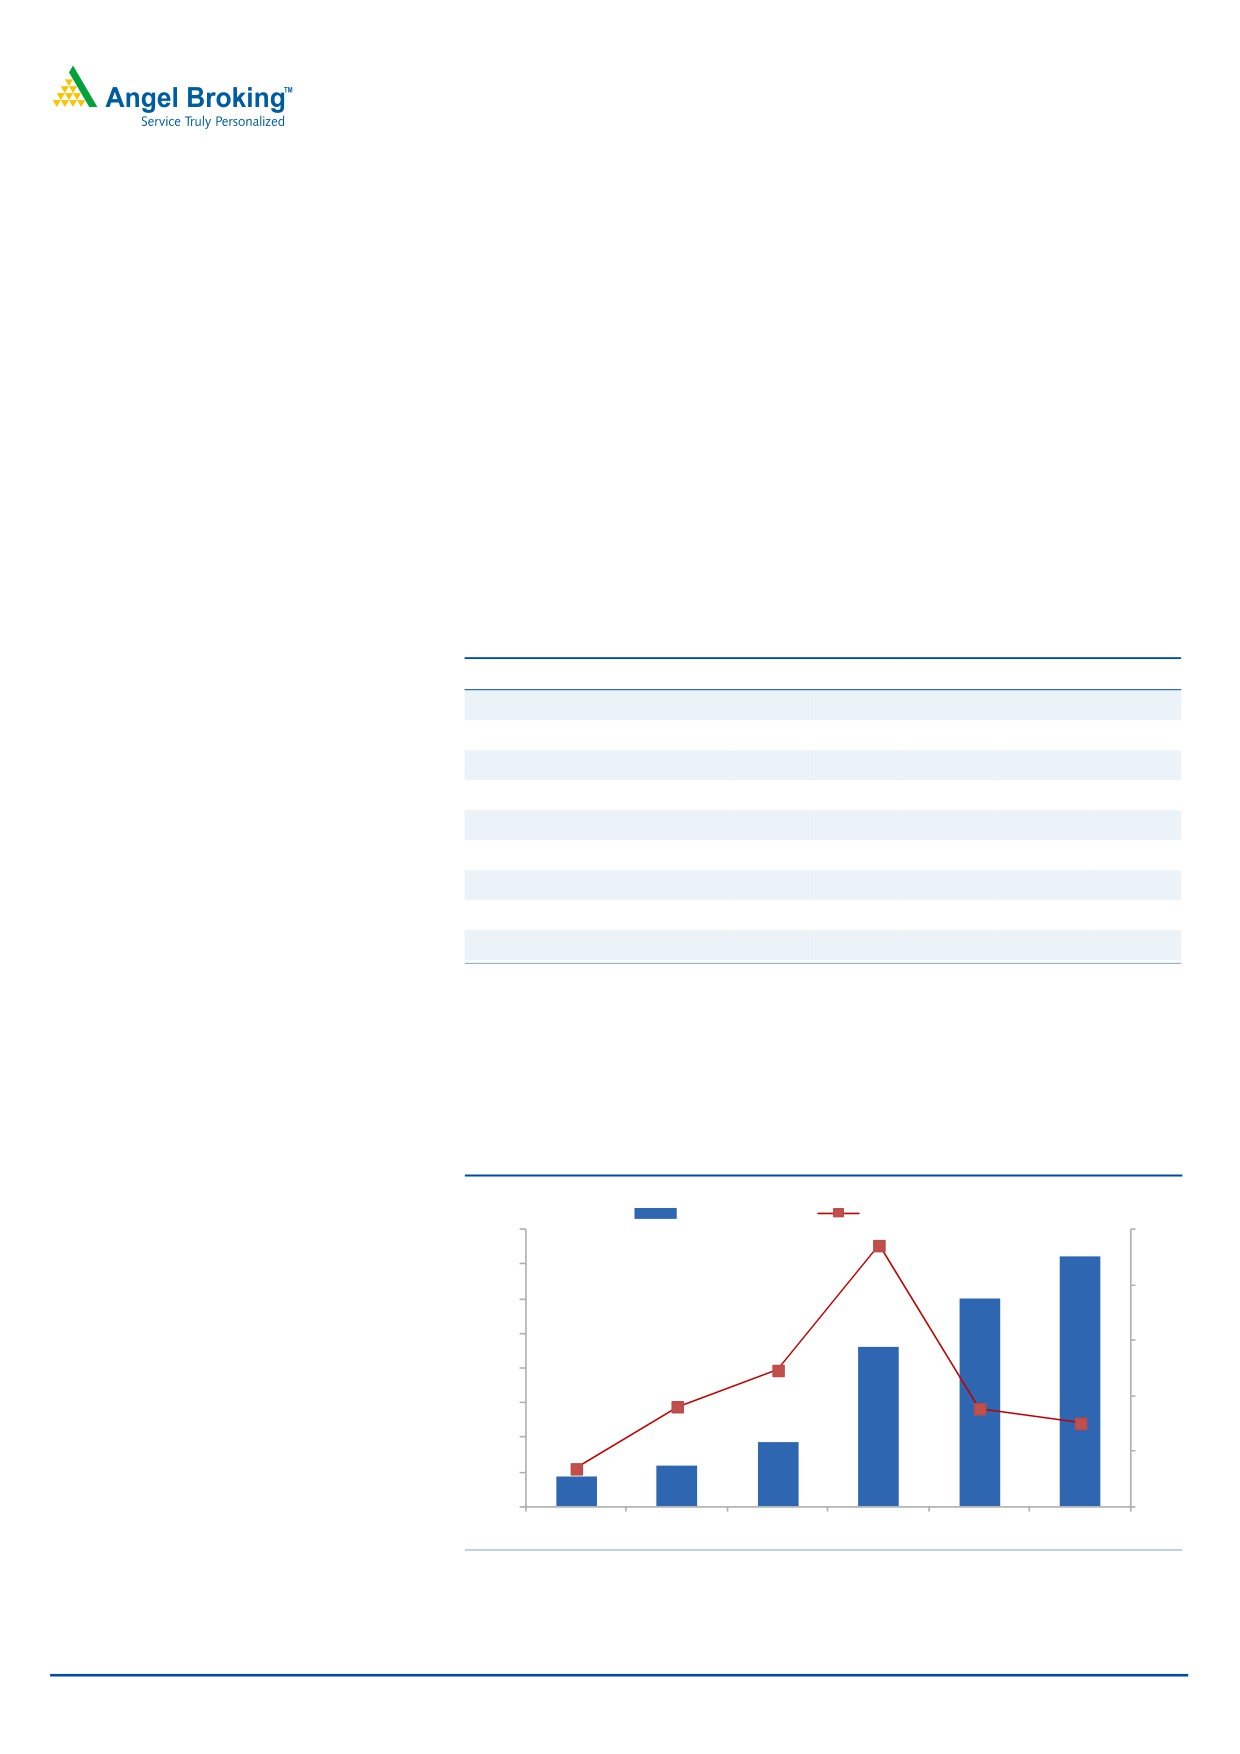
Net sales to grow at 58% CAGR over FY2011-14E
We expect the company’s net sales to register a CAGR of 58% over FY2011-14E,
increasing from `93cr in FY2011 to `361cr in FY2014E.
Exhibit 2: Net sales and net sales growth
(`cr)
(%)
Net sales (LHS)
Net sales growth (RHS)
400
160
350
120
300
250
80
200
40
150
100
0
50
0
(40)
FY2009
FY2010
FY2011
FY2012E FY2013E FY2014E
Source: Company, Angel Research
May 16, 2012
4
Advisory Desk
Cravatex
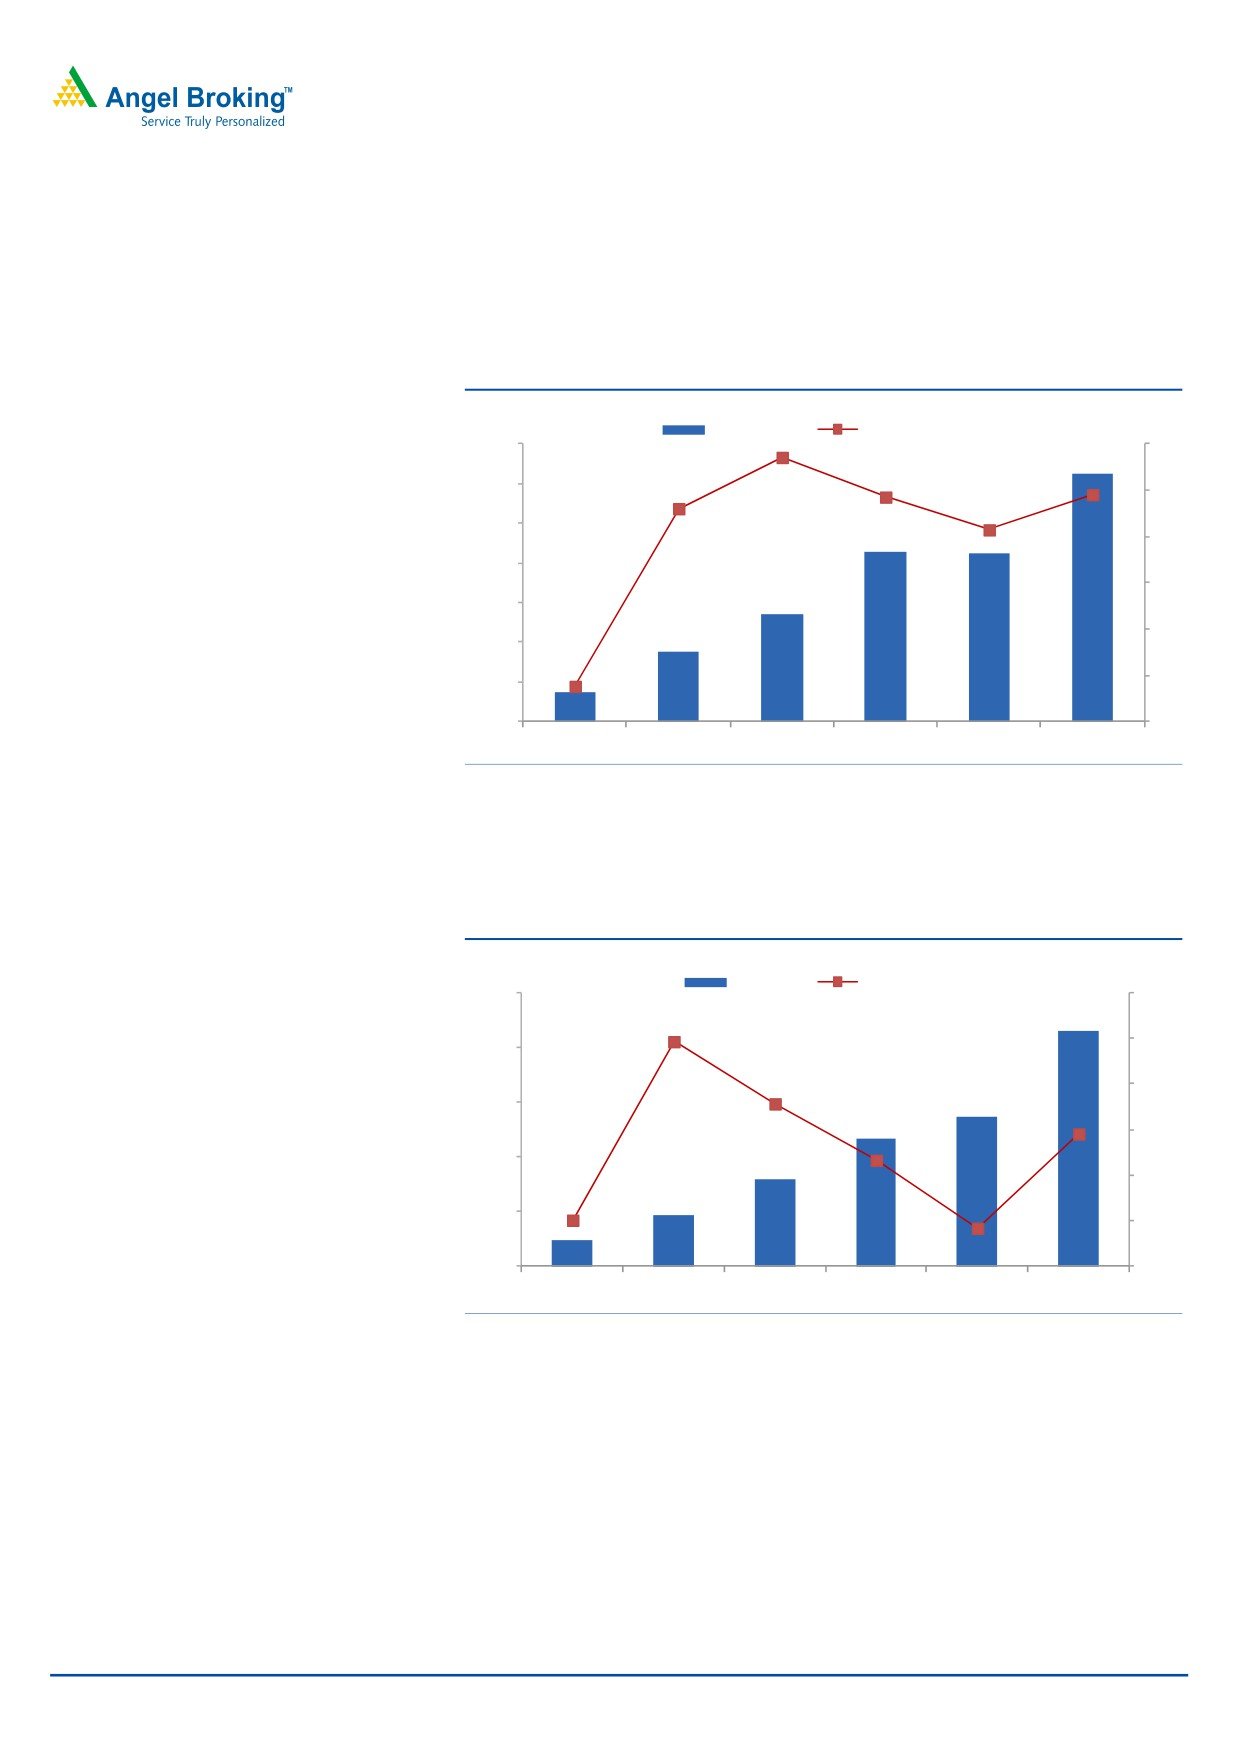
EBITDA to grow at a CAGR 45% over FY2011-14E
On the back of robust top-line growth of 58%, the company’s EBITDA is expected
to grow at a CAGR of 45% over FY2011-14E, from `6.9cr in FY2011 to `21cr in
FY2014E.
Exhibit 3: EBITDA and EBITDA margin
(` cr)
(%)
EBITDA (LHS)
EBITDA margin (RHS)
24
8
20
6
16
4
12
2
8
0
4
(2)
0
(4)
(4)
FY2009
FY2010
FY2011
FY2012E FY2013E FY2014E
Source: Company, Angel Research
Net profit of the company is expected to grow at a CAGR of
39% over
FY2011-14E, from `6.4cr in FY2011 to `17.2cr in FY2014E.
Exhibit 4: PAT and PAT growth
(` cr)
(%)
PAT (LHS)
PAT growth (RHS)
20
120
100
16
80
12
60
8
40
4
20
0
0
FY2009
FY2010
FY2011
FY2012E FY2013E FY2014E
Source: Company, Angel Research
May 16, 2012
5
Advisory Desk
Cravatex
Risks
High cost of equipment
India does not have quality equipment manufacturers due to which majority of the
equipment are been imported (largely from USA). The duty structure on imported
equipment is around 23%. Thus, considering the original cost of fitness equipment,
imports duty inflates their cost, which further leads to higher fixed cost for
consumers both individuals and institutions.
Euro slowdown
Subsidiary in UK which, Cravatex has recently acquired is expected to deliver
potential annual revenue of around £10mn for coming two years. This revenue
potential may be adversely impacted due to recent slowdown in Euro zone.
Currency Impact
Cravatex imports most of its equipment from outside country. Rupee depreciation
will make the imports expensive and increase the cost of acquiring the equipment.
High procurement cost will thereby impact the margins of the company.
Lack of government focus
Unlike most developed countries, the fitness equipment and sportswear sectors in
India lack industry status. Consequently, the government’s focus to enhance
awareness regarding fitness and sports-related products is quite low.
Inflation to impact growth
Rising inflation has caused the RBI to continue interest rate hikes and, thereby,
sacrifice growth to stabilize inflation. Higher inflation, rising interest rates and a
weak economic environment are expected to hold up consumers’ disposable
income and, thereby, impact growth.
May 16, 2012
6
Advisory Desk
Cravatex
Fitness equipment industry
The fitness equipment industry is witnessing significant growth as Indians are
increasingly becoming conscious about their health and fitness and since only a
fraction of urban India practices regular workout sessions. The industry is presently
estimated to reach `63.3bn by 2012 and grow by 25% for at least next five years
as quoted by Stag International. The end-user segment includes individuals using
fitness equipment at home and institutions such as health clubs and corporate
houses.
The Indian fitness industry is highly underpenetrated as compared to developed
and several developing countries in the world. For instance, 16% of the population
in the US possesses fitness club membership compared to mere 0.4% (considering
the top seven cities) in India.
In 2010, ~39% of India’s total population of 1.2bn was in the 20-44 years age
group. According to Planning Commission of India, the country’s population is
expected to increase to 1.3bn by 2020. Thus, the company will also have a
significant base of potential consumers - even if a modest 1% of the country’s
population aged 20-44 years is concerned about fitness.
The fitness industry in India continues to grow at a rapid pace on the back of
expansion of health club chains such as Talwalkars and Gold’s Gym and entry of
foreign fitness chains/clubs in the country. Penetration of these brands is creating
awareness about healthy lifestyles among people. The key trends identified include
health chains entering the equipment retail market, introduction of innovative
products and emergence of new distribution channels.
Foreign brands are known for their quality and durability in the Indian market.
Therefore, a large share of fitness equipment is imported from the US and Europe.
Various government policies such as FDI and franchise route of market entry in
India have a significant impact on the development of the fitness equipment
industry in India.
Key challenges identified in the industry include:
Lack of R&D facilities in the country
Lack of consumer confidence in Indian equipment
Lack of good trainers
Lack of space in residential complexes
May 16, 2012
7
Advisory Desk
Cravatex
Sportswear industry
The sportswear industry in India includes sports apparel, sports footwear and
accessories. The market for premium sports apparel and footwear industry in India
is currently worth `2,500cr as specified by the management. On the back of
mounting popularity of sports, higher disposable income and changing lifestyle
and consumer preferences, the sports apparel and footwear industry is expected to
grow at 15% CAGR over FY2011-14 as per the company’s estimations.
Increasing number of sports events and activities such as CWG and IPL are
providing scope and growth opportunities for players in the industry. The Indian
sportswear industry is at a nascent stage with increasing organized retail space.
Moreover, the trend of sportswear brand endorsements by prominent celebrities is
helping in boosting awareness among people. However, the industry has to cope
with price-conscious customers, extensive competition and limited channels for
distribution. Key challenges identified in the sportswear industry include poor state
of sports infrastructure in the country, imposition of excise duty and competition
from unorganized players. Further, competition from organized, international
players such as Nike, Adidas, FILA and Reebok continues to grab the industry share
of players in the Indian sportswear industry.
May 16, 2012
8
Advisory Desk
Cravatex
Company background
Cravatex mainly operates in two segments a) distribution of fitness equipment and
b) distribution of sports footwear and apparel of the brand FILA. Contribution from
the sportswear segment to the company’s revenue has increased from 24% of the
total revenue in FY2007 to 56% in FY2011, while contribution of the fitness
segment has reduced from 49% in FY2007 to 40% in FY2011.
Cravatex has recently issued bonus shares in the ratio of 1:1 by capitalizing the
subsequent amount from the General Reserve account of the company.
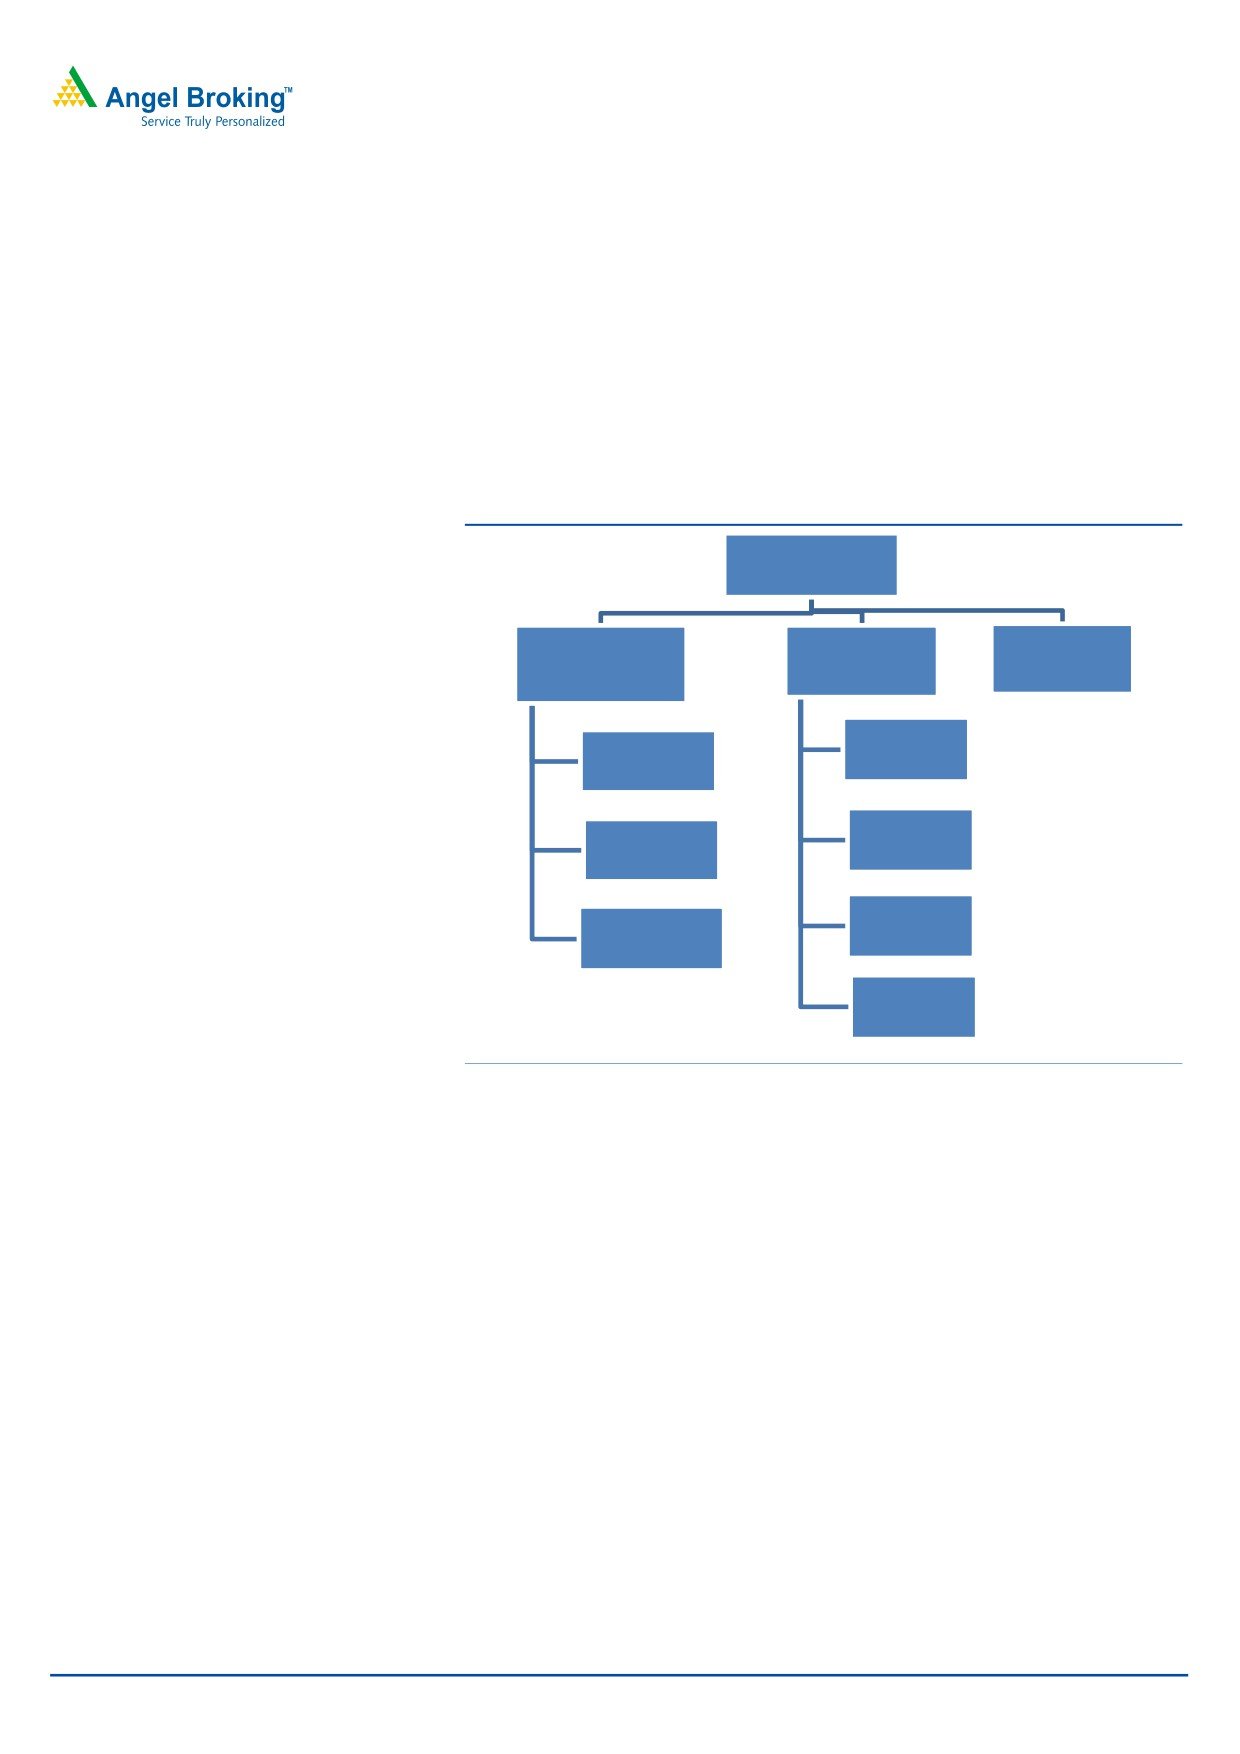
Exhibit 5: Revenue streams
Total Revenue
(92.6cr for FY2011)
Sportswear
Other Services
Fitness Equipment
Segment (56%)
(4%)
Segment (40%)
Distributors
Proline Fitness
Health club
Franchisee
chains
Home use
Shop-in-shops
equipments
MBO's
Source: Company, Angel Research
Distribution of fitness equipment
Cravatex is a market leader in fitness equipment distribution through its brand
Proline Fitness. The company distributes products of several international brands
like Johnson Health Tech (the third largest fitness company in the world), Horizon,
Vision, Body Solid and Magnum. Cravatex is the only ISO certified public listed
company dealing with fitness equipments.
In context to fitness at home, Proline Fitness has created the retail network of
around 51 stores with a complete range of home-use fitness equipment. The
company is also concentrating retail expansion by opening more stores and
maintaining a competitive product mix.
The company has been continuously forming strategic partnerships with various
health club chains such as Talwalkars and Gold Gym and is providing them with
high-quality equipment and customer service. Talwalkars, which has a presence in
nearly 50 cities including metros, mini metros and tier II and tier III cities with over
100 health clubs on a consolidated basis, provides promising growth visibility to
the company.
May 16, 2012
9
Advisory Desk
Cravatex
Distribution of sports footwear and apparel
In the sports apparel and footwear industry, Cravatex represents the 100-year old
Italian brand FILA. In India, FILA has entered by opening four retail stores this year
and plans a more retail-led approach in the coming years. The company is present
in over 1,135 footwear stores, 105 apparel stores and 200 shop-in-shops stores in
large retail formats. FILA aims to have a market share of 12-15% in next 2-3
years, with a yoy growth rate of
25-30% as quoted by the company’s
management.
Sports footwear: On the global front, Cravatex has acquired 100% of M/s BB (UK)
Ltd., which is its wholly owned subsidiary with effect from February 2011. Through
its subsidiary, Cravatex aims to acquire sub-license for certain distribution channels
for FILA in the UK and Ireland. The subsidiary will design, develop and supply FILA
apparel to other markets in Europe. The acquisition is expected to deliver revenue
of around £10mn in the next two years.
Founded in Italy in 1926, FILA is one of the most famous fashion sports shoes in
the world. Kim Clijsters, US open singles champion is the brand ambassador for
FILA.
Sports apparel: FILA entered India in 2009 and is now focusing on increasing its
presence by expanding its product portfolio and retail stores. The brand has
launched its sports apparel range and plans to set up 60-70 stores across India by
2014.
Cravatex management quotes that the sports apparel industry in India is growing
at a healthy rate of 15-18% per year. In large retail formats, as per availability of
space, the brand is present in shop-in-shops stores and expects to be present in all
large retail formats such as Shoppers Stop, Westside and Lifestyle. Starting with
metros and then mini metros and smaller towns, the company is also looking
forward to penetrate tier II-III cities. The company may opt for a franchise
depending on its location and store size.
May 16, 2012
10
Advisory Desk
Cravatex
Profit and loss statement (Standalone)
Y/E March (` cr)
FY2009
FY2010
FY2011
FY2012E
FY2013E
FY2014E
Gross sales
44
58
93
230
301
361
Less: Excise duty
-
-
-
-
-
-
Net Sales
44
58
93
230
301
361
Other operating income
-
-
-
-
-
-
Total operating income
44
58
93
230
301
361
% chg
(12.6)
32.2
58.4
148.5
30.7
20.2
Net Raw Materials
28
33
51
148
194
227
(% of Net Sales)
62.2
56.8
54.9
64.5
64.4
62.9
Other Mfg costs
1
1
3
6
8
10
% chg
48.9
(25.4)
159.0
148.7
30.7
20.2
Personnel
4
5
9
18
29
34
% chg
0.5
19.3
84.5
109.1
55.2
20.2
Other
12
16
23
44
57
69
% chg
2.2
31.9
42.9
86.1
30.7
20.2
Total Expenditure
45
55
86
217
288
340
EBITDA
(1)
3
7
13
13
21
% chg
(138.1)
(378.9)
125.7
91.1
(1.7)
62.8
(% of Net Sales)
(2.5)
5.2
7.4
5.7
4.3
5.8
Depreciation & Amortization
1
1
1
1
1
1
EBIT
(2)
2
6
12
12
20
% chg
(202.1)
(218.4)
160.2
100.9
(1.8)
67.4
(% of Net Sales)
(4.4)
4.0
6.5
5.3
3.9
5.5
Interest & other charges
1
1
2
3
2
3
Other Income
6
6
5
4
6
8
(% of Net Sales)
13.2
9.5
5.2
1.7
2.1
2.1
Extraordinary Expense/(Inc.)
(0)
(0)
-
-
-
-
PBT (reported)
3
7
9
13
16
25
Tax
1
3
3
4
5
7
(% of PBT)
31.2
47.5
31.4
30.0
30.0
30.0
PAT (reported)
2
4
6
9
11
17
PAT after MI (reported)
2
4
6
9
11
17
ADJ. PAT
2
4
6
9
11
17
% chg
20.3
98.7
71.4
46.6
16.7
58.1
(% of Net Sales)
4.2
6.4
6.9
4.1
3.6
4.8
Basic EPS (`)
7
14
25
36
42
67
Fully Diluted EPS (`)
7
14
25
36
42
67
% chg
20.3
98.7
71.4
46.6
16.7
58.1
Dividend
0
1
1
1
1
1
Retained Earning
1
3
6
8
10
16
May 16, 2012
11
Advisory Desk
Cravatex
Balance sheet (Standalone)
Y/E March (` cr)
FY2009
FY2010
FY2011
FY2012E
FY2013E
FY2014E
SOURCES OF FUNDS
Equity Share Capital
1
1
1
1
1
1
Preference Capital
-
-
-
-
-
-
Reserves& Surplus
14
17
22
31
41
57
Shareholders’ Funds
15
18
24
32
42
58
Minority Interest
-
-
-
-
-
-
Total Loans
11
13
18
25
25
25
Deferred Tax Liability
3.4
3.4
3.4
3.4
3.4
3.4
Total Liabilities
29
35
45
60
70
86
APPLICATION OF FUNDS
Gross Block
20
20
21
24
26
28
Less: Acc. Depreciation
9
8
9
10
11
12
Net Block
11
11
12
13
15
16
Capital Work-in-Progress
1
1
-
-
-
-
Lease adjustment
-
-
-
-
-
-
Goodwill
0
0
-
-
-
-
Investments
2
2
0
0
0
0
Current Assets
27
41
60
108
137
167
Cash
3
2
1
1
2
3
Loans & Advances
11
12
13
23
25
31
Inventory
7
12
21
39
50
61
Debtors
7
16
25
46
60
72
Current liabilities
13
21
27
62
82
97
Net Current Assets
15
20
32
47
55
70
Misc. Exp. not written off
-
-
-
-
-
-
Deferred Tax Asset
0
0
0
0
0
0
Total Assets
29
35
45
60
70
86
May 16, 2012
12
Advisory Desk
Cravatex
Cash flow statement (Standalone)
Y/E March (` cr)
FY2009 FY2010 FY2011 FY2012E FY2013E FY2014E
Profit Before Tax
3
7
9
13
16
25
Depreciation
1
1
1
1
1
1
Other Income
(6)
(6)
(5)
(4)
(6)
(8)
Change in WC
2
(6)
(13)
(14)
(7)
(14)
Direct taxes paid
(1)
(3)
(3)
(4)
(5)
(7)
Others
6
5
5
-
-
-
Cash Flow from Operations
5
(2)
(6)
(8)
(2)
(3)
(Inc.)/ Dec. in Fixed Assets
0
1
(2)
(2)
(2)
(3)
(Inc.)/Dec. In Investments
(2)
0
2
0
0
0
Other Income
6
6
5
4
6
8
Others
(6)
(7)
(4)
-
-
-
Cash Flow from Investing
(2)
(1)
1
2
4
5
Issue of Equity/Preference
0
0
0
0
0
0
Inc./(Dec.) in Debt
(1)
3
4
7
0
0
Dividend Paid (Incl. Tax)
(0)
(1)
(1)
(1)
(1)
(1)
Others
0
0
0
-
-
-
Cash Flow from Financing
(2)
2
4
6
(1)
(1)
Inc./(Dec.) In Cash
1
(1)
(1)
0
1
1
Opening Cash balance
2
3
2
1
1
2
Closing cash balance
3
2
1
1
2
3
May 16, 2012
13
Advisory Desk
Cravatex
Key ratios
Y/E March
FY2009
FY2010
FY2011
FY2012E
FY2013E
FY2014E
Valuation Ratio (x)
P/E (on FDEPS)
90.4
45.5
26.5
18.1
15.5
9.8
P/CEPS
61.9
38.0
23.4
16.3
14.2
9.2
P/BV
11.3
9.4
7.1
5.3
4.0
2.9
Dividend yield (%)
0.3
0.3
0.4
0.6
0.6
0.6
EV/Net sales
4.0
3.1
2.0
0.8
0.6
0.5
EV/EBITDA
(160.4)
58.7
27.1
14.7
14.9
9.1
EV / Total Assets
6.0
5.1
4.2
3.2
2.7
2.2
Per Share Data (`)
EPS (Basic)
7
14
25
36
42
67
EPS (fully diluted)
7
14
25
36
42
67
Cash EPS
11
17
28
40
46
71
DPS
2
2
3
3
3
3
Book Value
58
69
92
124
162
225
DuPont Analysis
EBIT margin
(4.4)
4.0
6.5
5.3
3.9
5.5
Tax retention ratio
0.7
0.5
0.7
0.7
0.7
0.7
Asset turnover (x)
2.3
2.2
2.3
3.9
4.4
4.3
ROIC (Post-tax)
(6.9)
4.7
10.2
14.3
12.2
16.7
Cost of Debt (Post Tax)
7.9
3.3
6.0
7.7
7.0
7.7
Leverage (x)
0.4
0.5
0.7
0.7
0.5
0.4
Operating ROE
(12.7)
5.4
13.2
19.2
15.1
20.1
Returns (%)
ROCE (Pre-tax)
(6.7)
6.6
13.4
20.1
16.9
23.0
Angel ROIC (Pre-tax)
(10.0)
8.9
14.9
20.5
17.5
23.9
ROE
12.5
20.7
26.9
29.2
26.0
29.6
Turnover ratios (x)
Asset TO (Gross Block)
2.2
3.0
4.3
9.8
11.6
12.7
Inventory / Net sales (days)
61
59
63
61
61
62
Receivables (days)
67
70
81
72
72
72
Payables (days)
99
110
103
104
104
104
WC cycle (ex-cash) (days)
108
95
99
97
64
68
Solvency ratios (x)
Net debt to Equity
0.4
0.5
0.7
0.7
0.5
0.4
Net debt to EBITDA
(5.4)
3.1
2.5
1.8
1.7
1.0
Int. Coverage (EBIT/ Int.)
(1.6)
2.7
3.9
4.4
4.8
7.3
May 16, 2012
14
Advisory Desk
Cravatex
Advisory Team Tel: (91) (022) 39500777
DISCLAIMER
This document is solely for the personal information of the recipient, and must not be singularly used as the basis of any investment
decision. Nothing in this document should be construed as investment or financial advice. Each recipient of this document should make
such investigations as they deem necessary to arrive at an independent evaluation of an investment in the securities of the companies
referred to in this document (including the merits and risks involved), and should consult their own advisors to determine the merits and
risks of such an investment.
Angel Broking Limited, its affiliates, directors, its proprietary trading and investment businesses may, from time to time, make
investment decisions that are inconsistent with or contradictory to the recommendations expressed herein. The views contained in this
document are those of the analyst, and the company may or may not subscribe to all the views expressed within.
Reports based on technical and derivative analysis center on studying charts of a stock's price movement, outstanding positions and
trading volume, as opposed to focusing on a company's fundamentals and, as such, may not match with a report on a company's
fundamentals.
The information in this document has been printed on the basis of publicly available information, internal data and other reliable
sources believed to be true, but we do not represent that it is accurate or complete and it should not be relied on as such, as this
document is for general guidance only. Angel Broking Limited or any of its affiliates/ group companies shall not be in any way
responsible for any loss or damage that may arise to any person from any inadvertent error in the information contained in this report.
Angel Broking Limited has not independently verified all the information contained within this document. Accordingly, we cannot testify,
nor make any representation or warranty, express or implied, to the accuracy, contents or data contained within this document. While
Angel Broking Limited endeavors to update on a reasonable basis the information discussed in this material, there may be regulatory,
compliance, or other reasons that prevent us from doing so.
This document is being supplied to you solely for your information, and its contents, information or data may not be reproduced,
redistributed or passed on, directly or indirectly.
Angel Broking Limited and its affiliates may seek to provide or have engaged in providing corporate finance, investment banking or
other advisory services in a merger or specific transaction to the companies referred to in this report, as on the date of this report or in
the past.
Neither Angel Broking Limited, nor its directors, employees or affiliates shall be liable for any loss or damage that may arise from or in
connection with the use of this information.
Note: Please refer to the important `Stock Holding Disclosure' report on the Angel website (Research Section). Also, please refer to the
latest update on respective stocks for the disclosure status in respect of those stocks. Angel Broking Limited and its affiliates may have
investment positions in the stocks recommended in this report.
Disclosure of Interest Statement
Cravatex
1. Analyst ownership of the stock
No
2. Angel and its Group companies ownership of the stock
No
3. Angel and its Group companies' Directors ownership of the stock
No
4. Broking relationship with company covered
No
Note: We have not considered any Exposure below ` 1 lakh for Angel, its Group companies and Directors
Ratings (Returns):
Buy (> 15%)
Accumulate (5% to 15%)
Neutral (-5 to 5%)
Reduce (-5% to 15%)
Sell (< -15%)
May 16, 2012
15