Advisory Desk
March 10, 2012
Cera Sanitaryware
BUY
CMP
`220
Organic growth and changing lifestyle to be the key drivers
Target Price
`289
Cera Sanitaryware Ltd. (CSL) is the third largest sanitary ware company in the
Investment Period
12 months
organized sector with about 22% market share in India. The company is engaged
into manufacturing sanitary ware and faucet ware (commenced since September
Sector
Ceramic products
2010) products. The company also markets wellness products, which are majorly
Market Cap (` cr)
279
outsourced. Owing to the changing lifestyle of people, increasing awareness for
Beta
0.6
improving sanitation coverage, expenditure on sanitary ware has been
52 Week High / Low
248 / 150
consistently increasing as a percentage of total construction expenditure, thereby
Avg. Daily Volume
5,070
providing significant traction for the sanitary ware sector. CSL is trading at an
Face Value (`)
5
attractive PE of 7.6x and EV/Sales of 0.9x on FY2013E. We recommend Buy on
BSE Sensex
17,503
CSL with a target price of `289, based on target PE of 10x and implied EV/Sales
Nifty
5,334
of 1.1x for FY2013E.
Reuters Code
CERA.BO
Bloomberg Code
CRS.IN
Investment rationale
Increased contribution of sanitary ware towards domestic expenditure
Shareholding Pattern (%)
On the back of increasing awareness towards improving sanitation coverage,
Promoters
55.0
changing lifestyle of people towards nuclear families, the number of households is
MF / Banks / Indian Fls
4.7
increasing, thereby creating robust demand for sanitary ware products.
FII / NRIs / OCBs
3.6
Simultaneously, increased disposable income has led to a shift from the
Indian Public / Others
36.7
unbranded to branded products. This trend is likely to drive strong growth for the
sanitary ware industry going forward.
Capacity expansion and better utilisation to drive revenue growth
Abs.(%)
3m 1yr 3yr
Sensex
3.7
(5.2)
9.9
CSL is extending its installed sanitary ware capacity from 24,000MT to 32,400MT,
CSL
20.3
39.1
299.6
which is expected to be operational by 1QFY2013. Also, CSL has entered into
new avenues like production of faucet ware since September 2010 with initial
capacity of 2,500mn pieces per annum, which was previously outsourced.
Considering these factors, we expect CSL’s top line to post a 26% CAGR over
FY2011-13E.
Benefit from unmatched distribution network and high brand visibility
CSL has a very strong distribution network with 500 dealers and connection with
nearly 5,000 retailers to distribute its products. Owing to continuous marketing
activities, which are creating a high brand visibility, CSL’s advertisement cost has
witnessed a 30% CAGR over FY2007-11 and is consistently moving northwards.
Outlook and valuation
CSL’s top line is expected to grow to `385cr in FY2013E. The company’s revenue
and profit are expected to post a CAGR of 26% and 16%, respectively, over
FY2011-13E. The stock is currently trading at PE of 8.9x and 7.6x for FY2012E
and FY2013E, which makes it attractive. We recommend Buy on CSL with a target
price of `289, offering an upside of 31% from current levels.
Key financials
Sales OPM PAT EPS ROIC P/E P/BV EV/ EBITDA EV/ Sales
CSL
(` cr)
(%)
(` cr)
(`)
(%)
(x)
(x)
(x)
(x)
FY2011
243
18.8
27
22
38
10.2
2.5
6.0
1.1
FY2012E
296
18.2
31
25
29
8.9
2.0
5.9
1.0
Twinkle Gosar
FY2013E
385
17.2
37
29
24
7.6
1.6
5.2
0.9
Tel: 022- 3935 7800 Ext: 6848
Source: Company, Angel Research
Please refer to important disclosures at the end of this report
1
Advisory Desk
Cera Sanitaryware
Investment rationale
Increased contribution of sanitary ware towards domestic expenditure
Owing to the changing lifestyle of people, the role of sanitary products has
advanced from being a necessity to a status statement - thus impacting the
spending structure of individuals and improving the proportion expended on these
basic amenities. Growth in per capita income, leading to a simultaneous increase in
the disposable income of people, has been a vital factor supporting the changing
lifestyle of people.
Also, requirement of personal space and privacy gaining an inevitable place,
subsequently leading to nuclear families, have augmented residential figures,
thereby increasing demand for sanitary products. This trend is expected to continue,
providing sustainable demand visibility for sanitary ware products.
Considering India’s dense population, its sanitation coverage is only ~40%. With
increasing awareness for improving public health, the sanitary ware segment is
expected to witness high attention.
Lastly, with aesthetics gaining a significant importance, CSL’s initiatives to provide
better designs and quality are bound to perk up its top line.
Capacity expansion and better utilisation to drive revenue growth
CSL is currently operating at its full capacity for its sanitary ware unit. The company
is expanding its sanitary ware unit’s capacity from the existing installed capacity of
24,000MT, which produces 2mn pieces per annum, to
32,400MT, which
would produce
2.7mn pieces per annum at an estimated capital outlay of
`125cr - thereby encashing the growing demand.
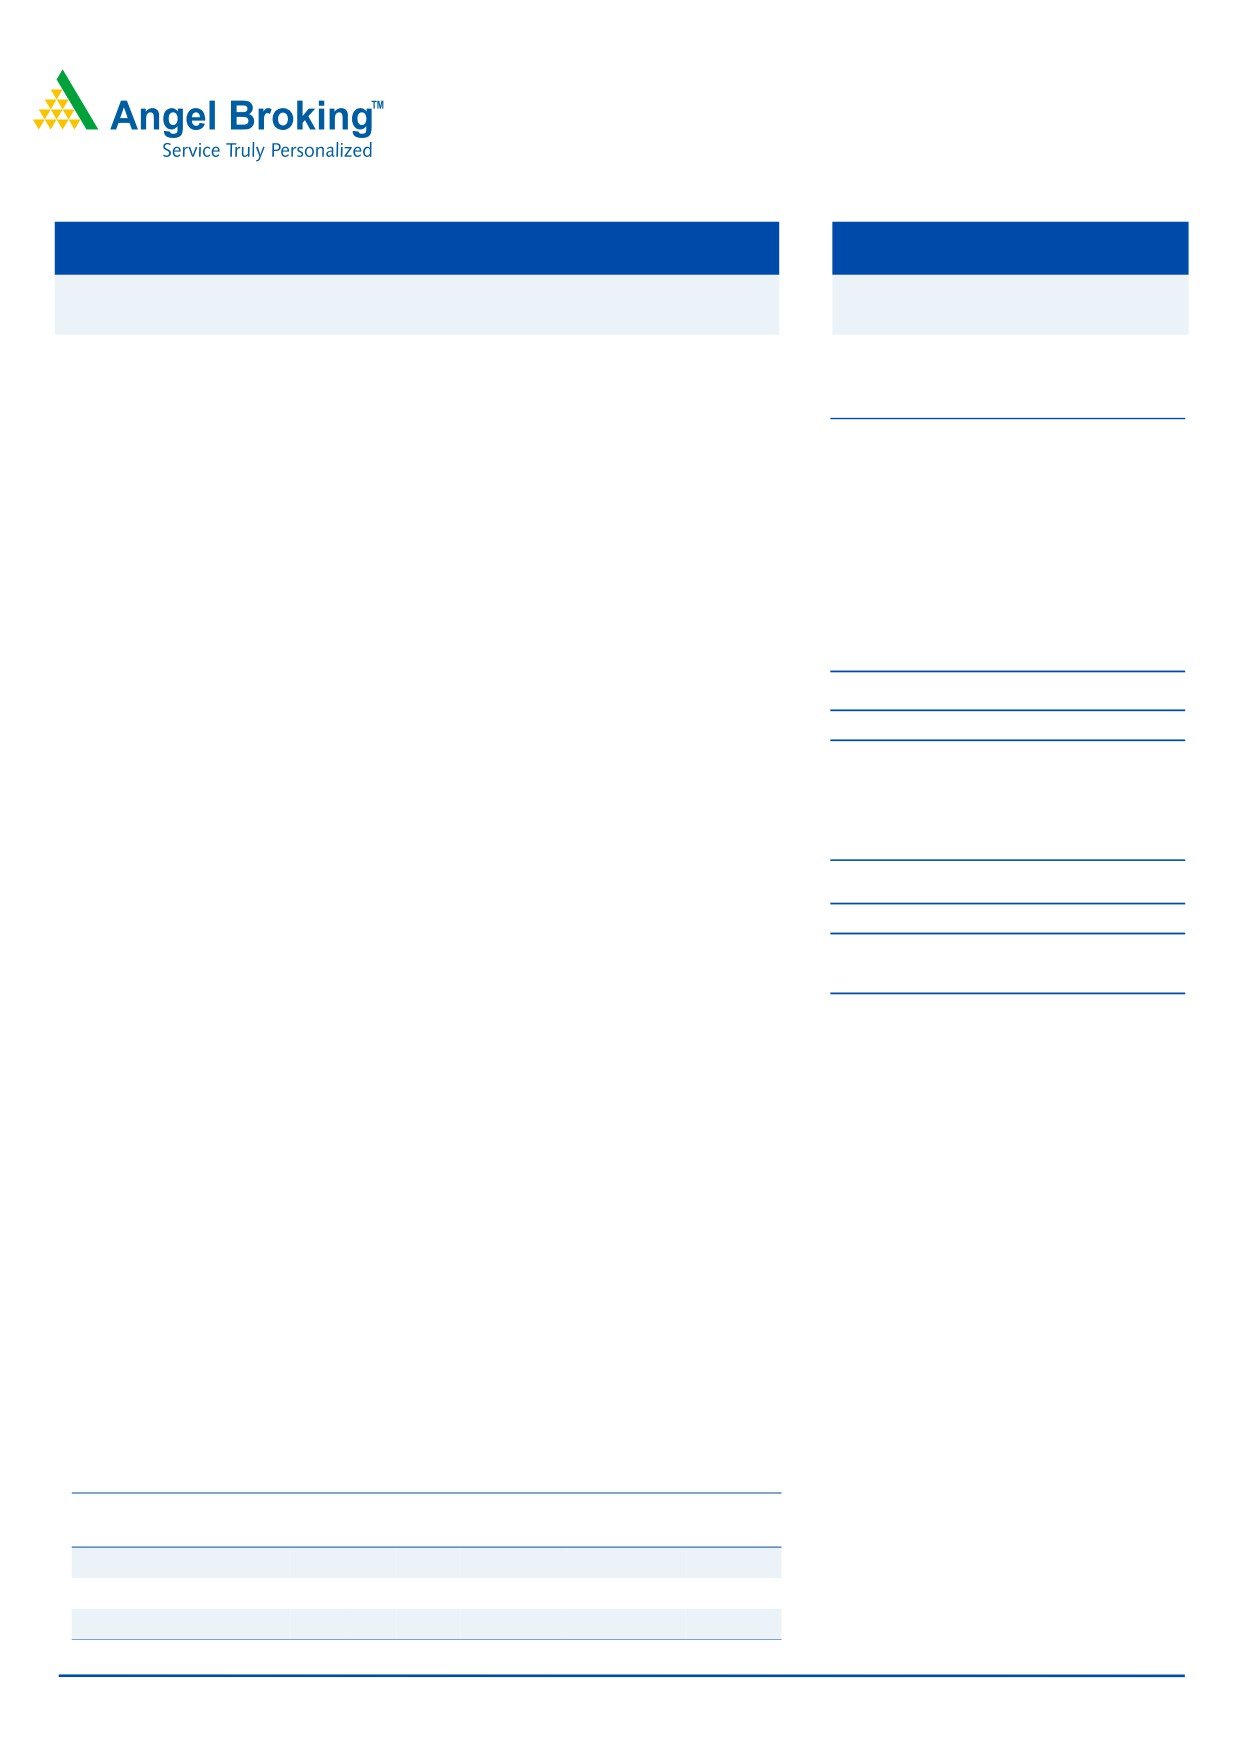
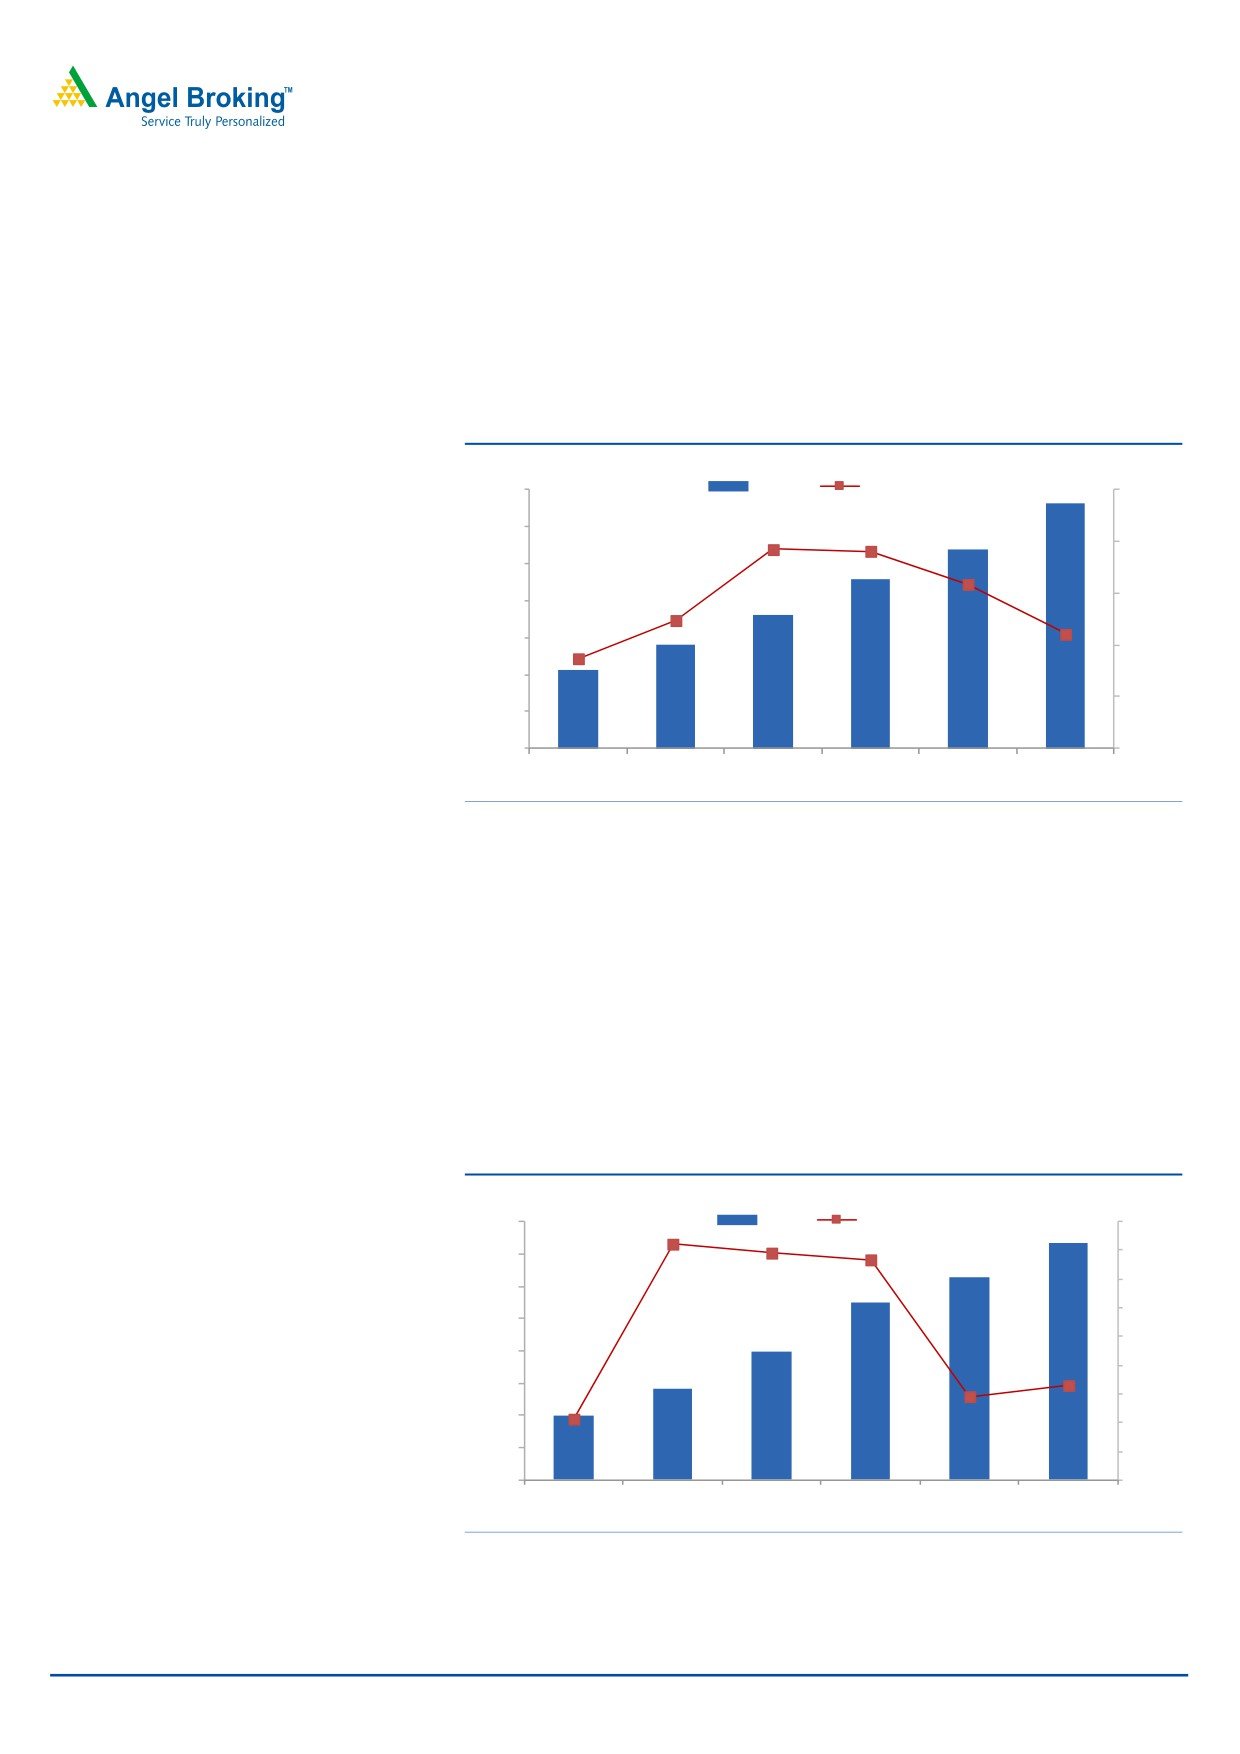
Exhibit 1: Capacity utilization of the sanitary ware unit
(` Cr)
(%)
Installed Capacity
Production
Capacity Utilization
35,000
120
30,000
100
25,000
80
20,000
60
15,000
40
10,000
20
5,000
0
0
FY2008
FY2009
FY2010
FY2011E
FY2012E
FY2013E
Source: Company, Angel Research
CSL started production at its faucet ware unit at Kadi in September 2010. The
company had set up this plant with an initial investment of `10cr, met by internal
accruals, with current capacity of 2,500 pieces per day, which would be doubled by
FY2014E.
Faucets, which accounted for 17% of the company’s revenue in FY2010, were
mainly outsourced directly through imports from Chinese suppliers or from domestic
markets. In-house production of the same is expected to boost the company’s
top-line going forward.
March 10, 2012
2
Advisory Desk
Cera Sanitaryware
Benefit from unmatched distribution network and high brand visibility
CSL has a very strong distribution network with 500 dealers and connection with
~5,000 retailers to distribute its products. The company has established 12 major
stock points, 10 zonal sales offices and 7 bath studios pan India to establish its
presence. CSL has also initiated opening of Cera Bath Galleries in different towns.
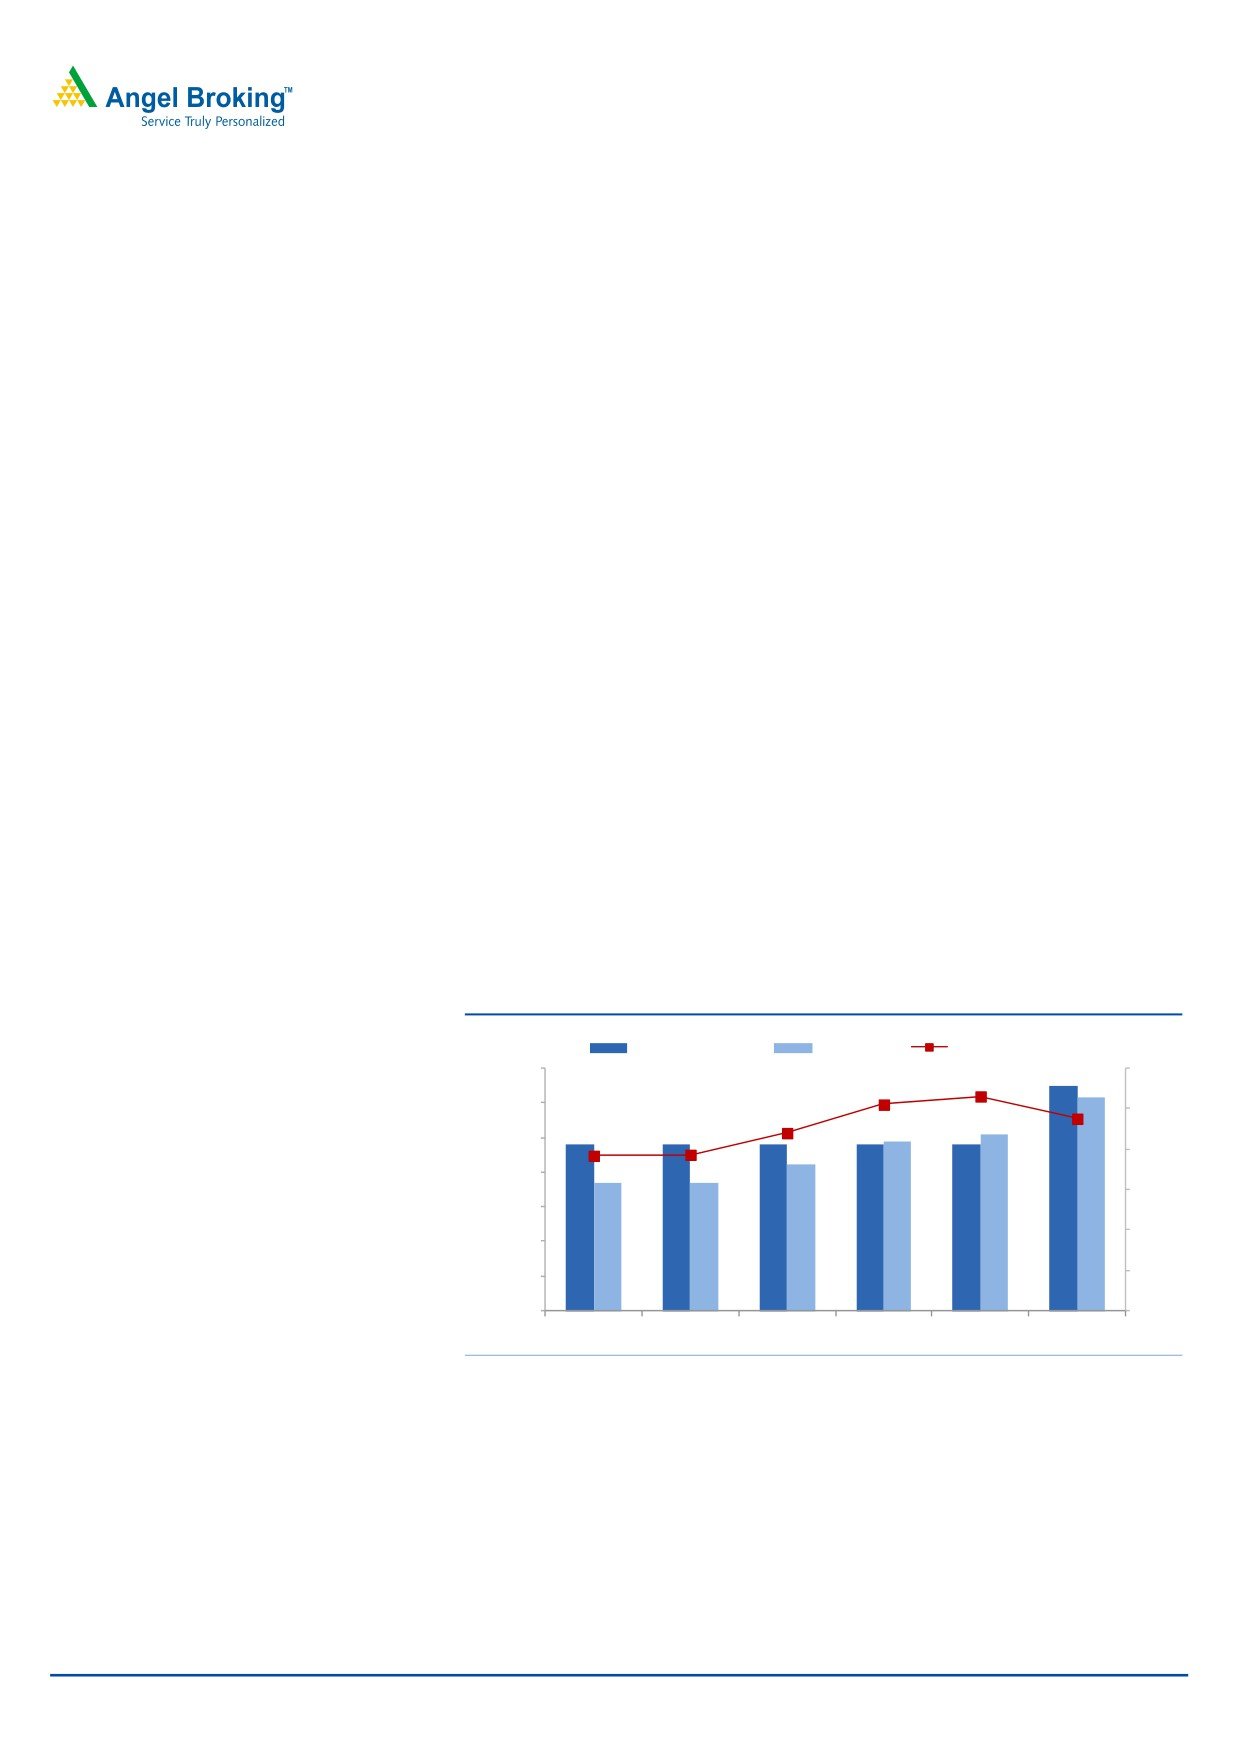
Owing to continuous marketing activities that are creating high brand visibility, the
advertisement cost of CSL is consistently moving northwards. Marketing expenses
constitute around 15% of the company’s net sales and have witnessed a 30% CAGR
over FY2007-11. CSL has a strong foothold in northeast and central India, while the
company is eyeing southern states such as Andhra Pradesh, Tamil Nadu and
Karnataka to establish its footings.
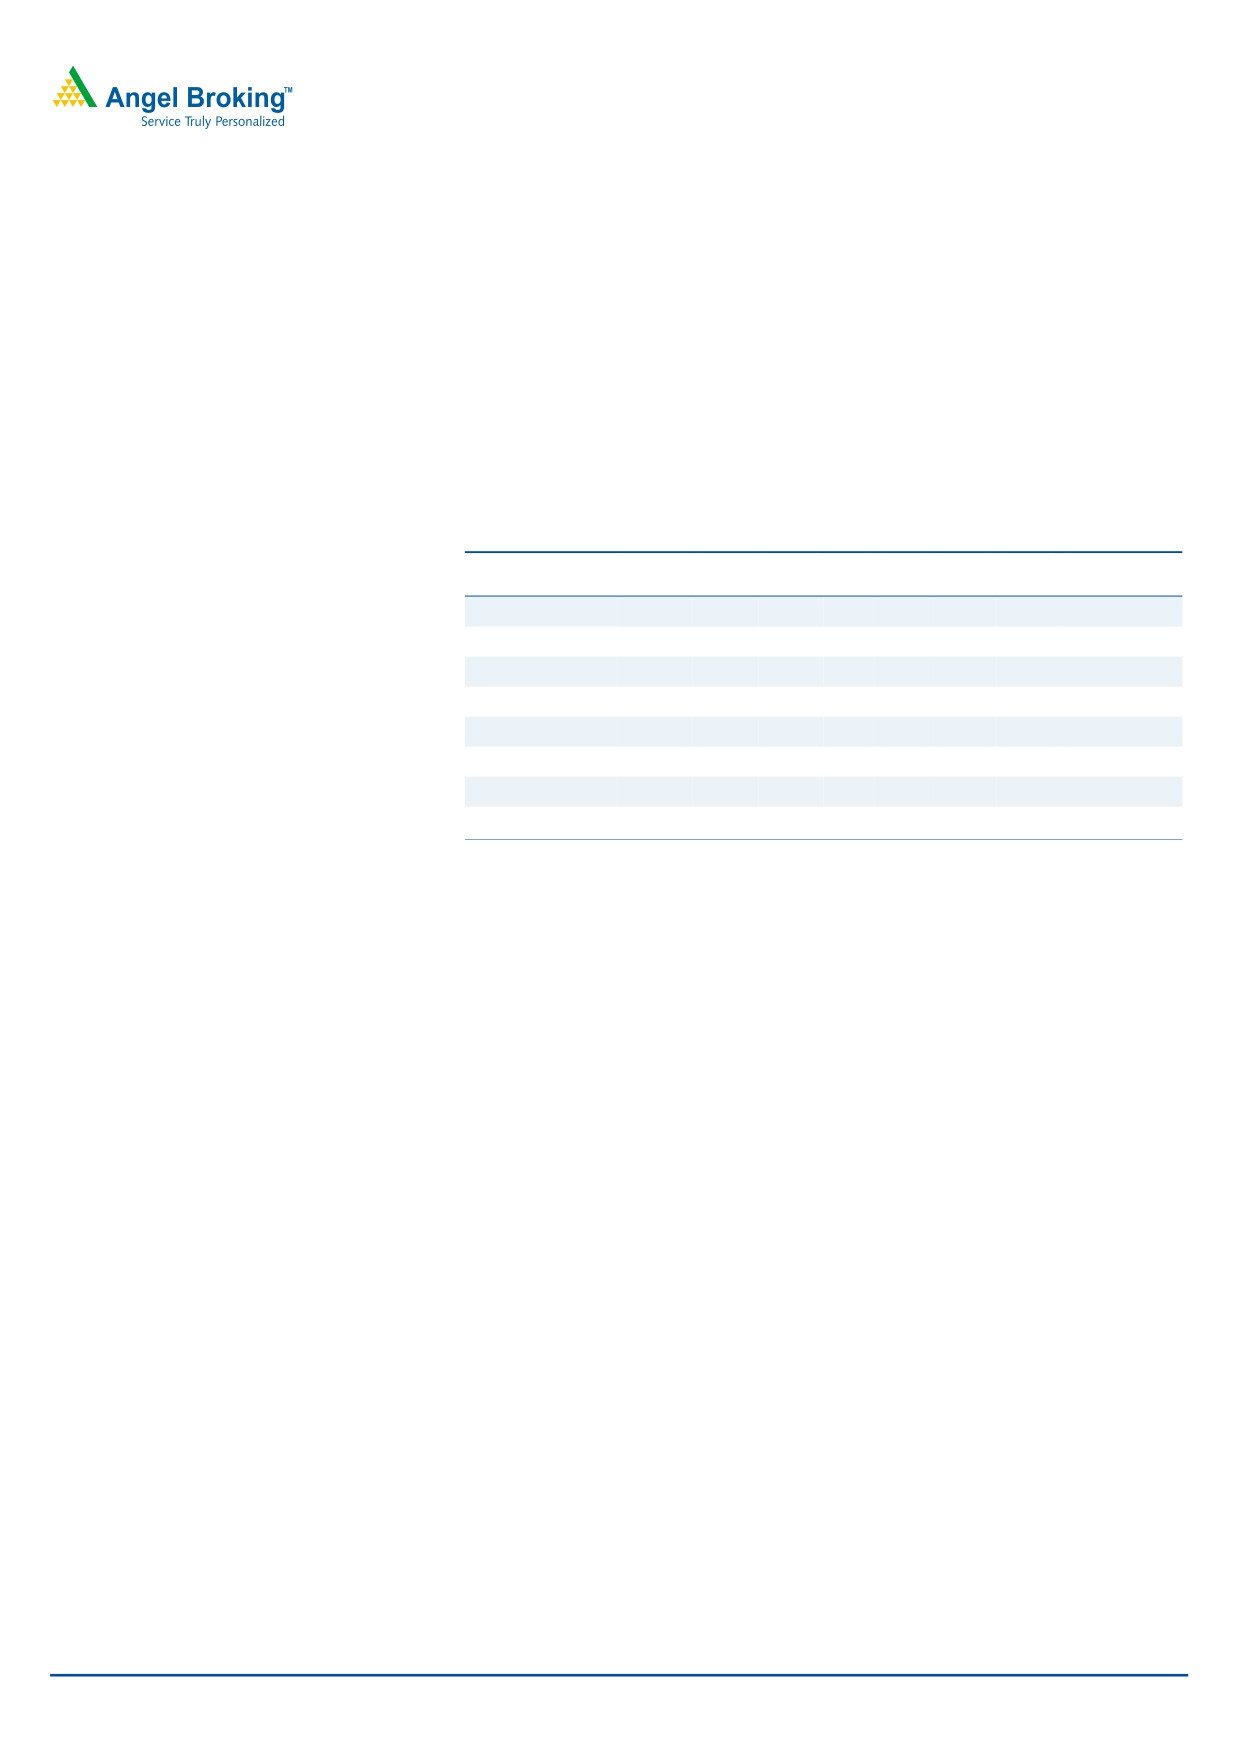
Exhibit 2: Marketing expenses moving northwards
(` cr)
40
Advertisement
Commssion expenses
Distribution expenses
35
30
25
20
15
10
5
0
FY2007
FY2008
FY2009
FY2010
FY2011
Source: Company
Immense fresh demand on the back of the construction sector’s growth
In India, the construction sector is growing at a robust pace because of rapid
urbanization. For the sanitary ware industry, ~93% of the demand is fresh demand.
Only 7% is derived from the replacement segment, which arises out of renovations,
improvement and refurnishing. In developed economies, 20% is fresh demand,
while 80% demand is from the replacement segment. Considering the above facts,
the Indian construction sector’s development is bound to register strong growth for
sanitary ware industry and eventually for CSL.
Also, CSL is trying to tap fresh construction activities in Tier 2 and 3 cities, the
untapped potential markets, by building relationships with developers, consultants
and interior designers in these areas. Moreover, the competitive pricing policy of the
company to some extent has enabled it to secure an assured place in the
consumer’s mind.
March 10, 2012
3
Advisory Desk
Cera Sanitaryware
Company financials
Key assumptions
We expect CSL’s expanded sanitary ware capacity to be operational by
1QFY2013E; hence, we have not factored the same in our FY2012 estimates.
Following are the other key assumptions used to forecast the company’s financials:
Exhibit 3: Key assumptions
FY2011
FY2012E
FY2013E
Sanitary ware
Installed capacity (MT)
24,000
24,000
32,400
Capacity utilization (%)
102.0
106.0
95.0
Sales quantity growth (%)
14.9
12.0
20.0
Sales value growth (%)
28.5
25.0
28.4
Sale price/Unit growth (%)
11.8
7.0
7.0
Faucet ware
Installed capacity (‘000 units)
750
900
900
Capacity utilization (%)
11.6
20.0
20.0
Sales value (` cr)
0.0
5.0
12.0
Raw material
Sanitaryware, allied products value growth (%)
15.0
20.0
40.0
Traded goods value growth (%)
1.6
1.6
1.4
Sandstone/Clay value growth (%)
11.8
20.0
40.0
Brass ingots value growth (%)
0.0
20.0
35.0
Source: Company, Angel Research
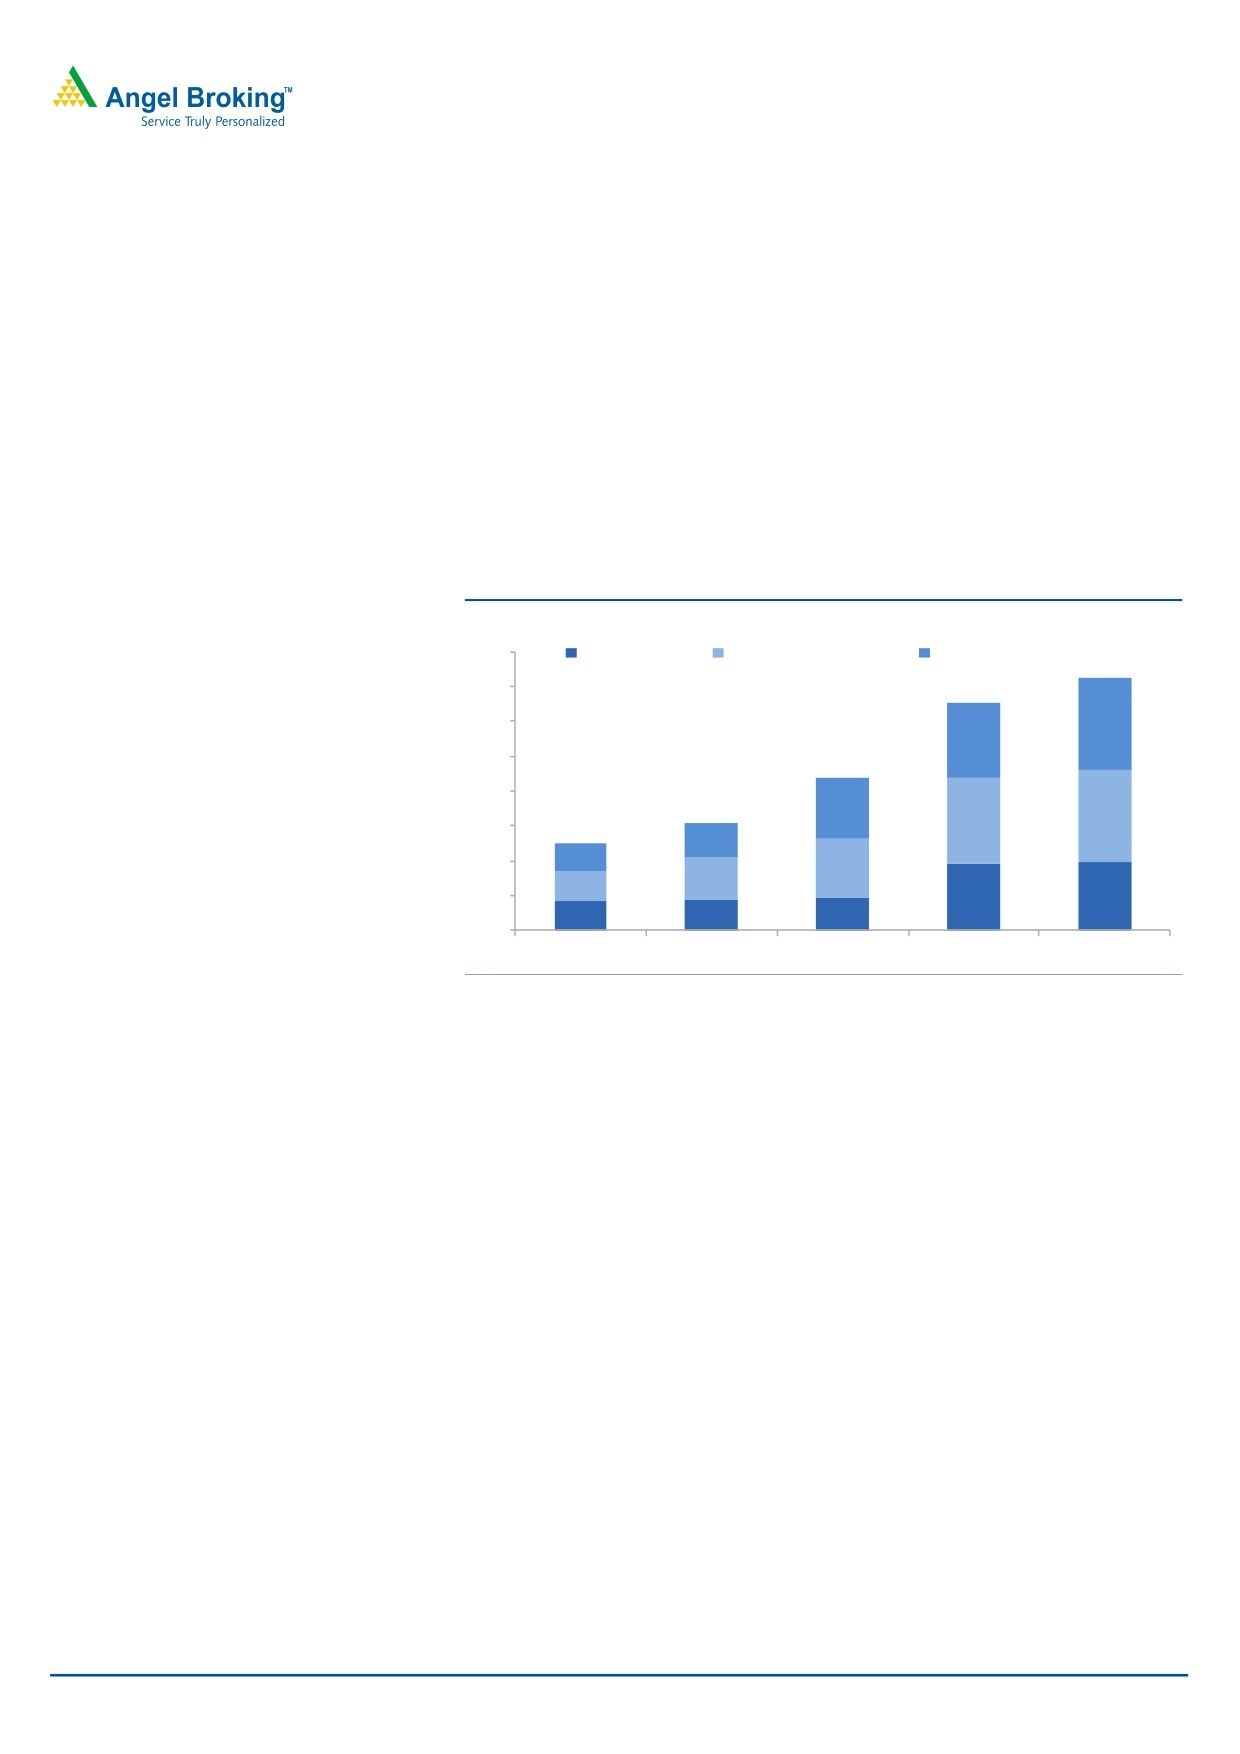
Net sales expected to post a 26% CAGR over FY2011-13E
With new developments in capacity and avenues, we expect CSL’s net sales to post
a 26% CAGR over FY2011-13E to `385 in FY2013E. Of the total sales, exports
(majorly to Gulf and Africa) contribute ~5% to sales.
Exhibit 4: Net sales and net sales growth
(` Cr)
(%)
Net Sales
Net Sales Growth
450
35
400
30
350
25
300
250
20
200
15
150
10
100
5
50
0
0
FY2008
FY2009
FY2010
FY2011E FY2012E FY2013E
Source: Company, Angel Research
March 10, 2012
4
Advisory Desk
Cera Sanitaryware
EBITDA to post a 20% CAGR over FY2011-13E
The company’s EBITDA is expected to rise from `46cr in FY2011 to `66cr in
FY2013E. However, the company’s EBITDA margin is expected to dip from 18.8% in
FY2011 to 18.2% in FY2012E and to 17.2% in FY2013E, mainly due to the increase
in raw-material cost and transport cost to some extent. CSL is operating at its full
capacity currently, thereby benefiting from economies of scale.
Exhibit 5: EBITDA and EBITDA margin
(` Cr)
(%)
70
EBITDA
EBITDA Margin
20
60
19
50
18
40
30
17
20
16
10
0
15
FY2008
FY2009
FY2010
FY2011
FY2012E FY2013E
Source: Company, Angel Research
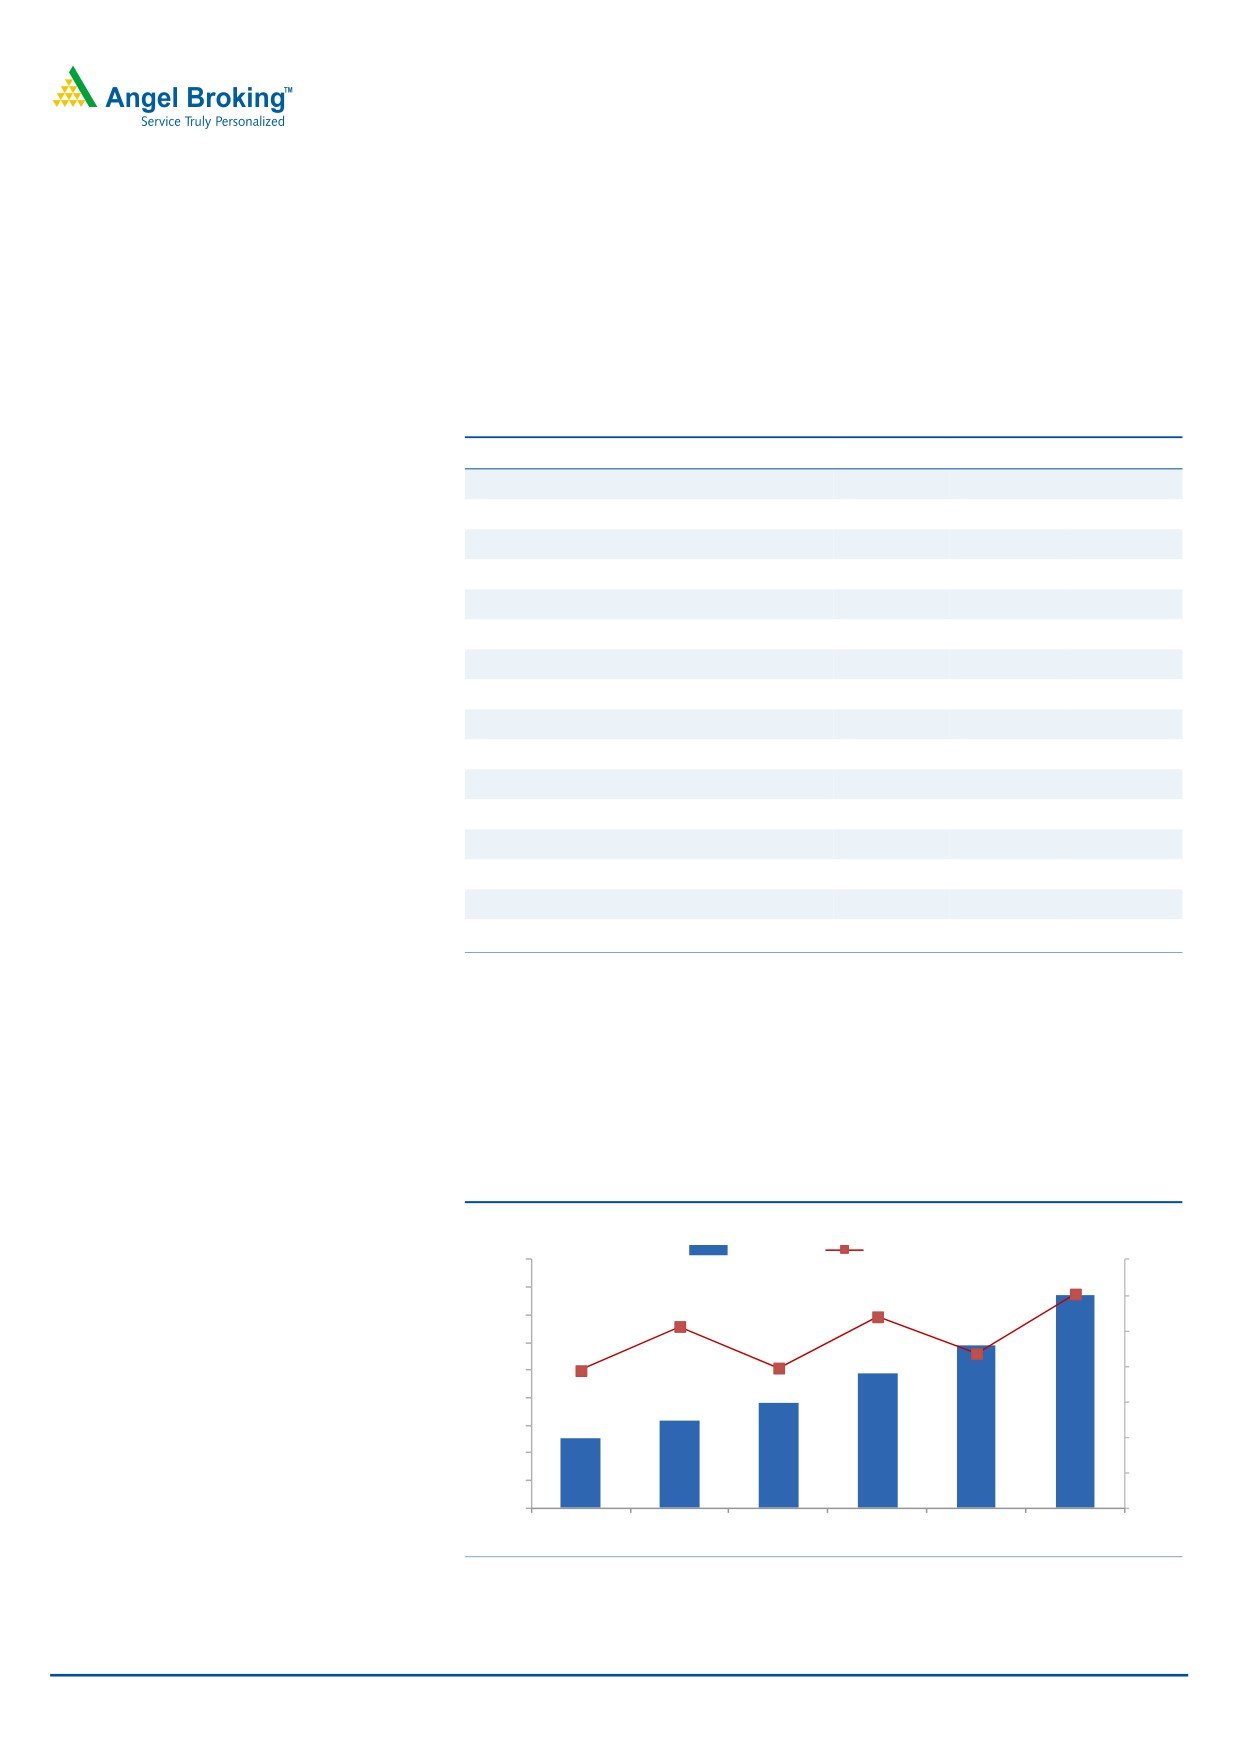
Net profit to post a 16% CAGR over FY2011-13E
On the back of remarkable growth in top-line, bottom-line too is expected to grow
at 16% CAGR over FY2011-13E. We expect the company’s net profit to increase
from `27cr in FY2011 to `37cr in FY2013E.
Net profit margin is expected to dip from 11.3% in FY2011 to 10.3% in FY2012E
and 9.5% in FY2013E, mainly due to increase in depreciation on extended capacity
and increased interest cost. CSL’s debt-equity ratio is comfortably placed at 0.4x
FY2013E, keeping interest cost at a manageable level.
Exhibit 6: PAT and PAT growth
(` Cr)
(%)
40
PAT
PAT Growth
45
35
40
35
30
30
25
25
20
20
15
15
10
10
5
5
0
0
FY2008
FY2009
FY2010
FY2011E FY2012E FY2013E
Source: Company, Angel Research
March 10, 2012
5
Advisory Desk
Cera Sanitaryware
The company
CSL, a Gujarat-based company, is a premium bathroom solutions provider. Apart
from sanitary ware and faucet ware products, CSL also deals in wellness products,
consisting high-end and luxury bath tubs, steam cubicles, shower partitions and
shower panels. The company has also expanded its brand presence to other related
categories such as showers and PVC cistern (seat covers).
The company’s sanitary ware product, Snow White was voted Product Of The Year in
2011. The product added to the company’s list of innovations, which included
products like water-saving twin-flush coupled WCs, four-liter flush WCs and
one-piece WCs.
Sanitary ware unit
CSL has a ~22% market share in the Indian sanitary ware products market. The
company is expanding its sanitary ware production capacity from 2mn pieces per
annum currently to
2.7mn pieces per annum, nearly
25% addition, to be
operational by 1QFY2013E.
Faucet ware unit
The Indian faucet ware industry is worth ~`4,000cr. The industry offers a huge
scope of growth to CSL. Until now, the company outsourced its faucet ware products
from either China or domestic markets. However, CSL will now roll out its facet
ware products from its own plant, which started production in September 2010. The
plant is set up at Kadi, with an initial investment of `10cr (met by internal accruals)
having initial capacity of 2,500 pieces per day. This capacity will be doubled to
5,000 pieces a day by FY2014E.
Wellness products
CSL’s bath ware unit continues to market under the brand name Cera. Imported
products such as shower cubicles, shower panels and steal cubicles form part of the
unit’s product portfolio, which has helped CSL to grow at a fast pace.
Power unit
CSL has wind farms in Gujarat for captive electricity generation. The installed
capacity of the company’s wind power unit is 4.97MW. Non-conventional wind
power generation for FY2011 was 5,676MWH against 5,965MWH in FY2010.
CSL’s power requirement is met through electricity generated by its wind power unit
and DG sets, which are completely based on natural gas.
March 10, 2012
6
Advisory Desk
Cera Sanitaryware
Sanitary ware industry
The Indian sanitary ware industry, estimated to be `1,500cr-1,800cr, contributes to
~8% of the world’s sanitary ware production. The industry has a sustained growth
rate of 12-14% per annum due to increasing housing demand, purchasing power
and consciousness towards hygiene. India is emerging as the second largest
sanitary ware market in India and is expected to witness robust growth owing to the
following:
Low penetration in Indian sanitation coverage
Considering India’s dense population, its sanitation coverage is only ~40%, which
is considered to be one of the lowest in the world, thus increasing the risk of health
hazards and epidemics. With increasing awareness towards improving public
health, the sanitary ware segment is expected to witness high attention.
Changing lifestyle and rising awareness about health and fitness
Demand for premium sanitary ware products will be driven by the growing shift
towards upper-class lifestyle, rising per capita income, increasing awareness about
health and fitness and changing consumer mindsets. The concept of making a clean
and hygienic toilet is growing rapidly in rural areas, where a toilet did not even exist
a few years ago.
Wide exports horizon
Indian sanitaryware products are very competitive because of their low production
costs and, hence, export from India is increasing every day. Seven foreign brands
such as H&R Johnson, Roca and Kohler have established their operations in India.
March 10, 2012
7
Advisory Desk
Cera Sanitaryware
Competition
The Indian sanitary ware industry comprises players from the organized sector,
unorganized sector, foreign players establishing facilities in India, domestic players
and even retailers importing (mainly from China) and marketing in the domestic
market.
HSIL is the market leader in sanitary ware products with ~41% market share,
followed by Roca Parryware (~26% share) and CSL (~22% share). While in the
faucet ware segment (where the company has just entered), Jaguar has the major
market share of 45-50%.
Exhibit 7: Peer comparison
Sales
OPM
PAT
EPS ROE
P/E
P/BV
EV/EBITDA
(` cr)
(%)
(` cr)
(`)
(%)
(x)
(x)
(x)
CSL
FY2011
243
18.8
27
22
27
10.2
2.5
6.0
FY2012E
296
18.2
31
25
25
8.9
2.0
5.9
FY2013E
385
17.2
37
29
23
7.6
1.6
5.2
HSIL
FY2011
1,079
17.5
77
11
12
8.4
1.2
5.2
FY2012E
1,410
18.2
107
16
16
8.7
1.3
5.1
FY2013E
1,740
18.2
135
20
17
6.9
1.1
4.1
Source: Angel Research, Bloomberg
As compared to market leader HSIL, CSL has consistently given higher returns of on
equity. Considering the expansion and development plans being undertaken by the
company, CSL’s returns are expected to rise further and valuations are likely to
become more attractive on forward basis.
March 10, 2012
8
Advisory Desk
Cera Sanitaryware
Risk factors
Unorganized and local players pose the main risk to the sanitary ware
segment. Unorganized sanitary ware manufacturers enjoy the benefit of nil
excise duty and sales tax and, hence, their products are ~70% cheaper than
the organized sector’s products. The increase in excise duty, from 8% to 10%
and further to 12%, will make products from organized players more expensive.
The advent of foreign brands in India also poses a threat because people are
shifting to better, bigger brands, with increasing purchasing power.
Low-cost imports from China.
Any drastic changes in government policy related to housing construction and
imports, among others, is bound to impact the industry.
Any increase in the price of brass, the main raw material for faucets, may dent
EBITDA margin.
Any slowdown in the housing segment will cease growth, as in India the major
demand for sanitary ware is fresh demand.
March 10, 2012
9
Advisory Desk
Cera Sanitaryware
Standalone Profit and Loss Account
Y/E March (` cr)
FY2008
FY2009
FY2010
FY2011
FY2012E
FY2013E
Gross sales
139
171
200
256
311
405
Less: Excise duty
12
11
9
13
15
20
Net Sales
127
160
191
243
296
385
Other operating income
-
-
-
-
-
-
Total operating income
127
160
191
243
296
385
% chg
19.4
25.6
19.8
27.0
21.8
30.2
Net raw materials
47
59
67
86
110
147
% chg
17.4
26.1
12.8
29.6
27.2
33.4
Other Mfg costs
9
9
12
15
18
24
% chg
29.9
1.4
31.8
18.8
21.8
30.2
Power
6
5
6
12
15
19
% change
31.2
(14.1)
27.1
94.3
22.0
25.0
Personnel
19
22
23
28
40
53
% chg
33.2
14.8
3.9
21.1
44.4
32.5
Other
25
36
47
56
59
77
% chg
13.9
46.8
29.4
19.4
5.7
30.2
Total Expenditure
106
132
155
197
242
319
EBITDA
21
28
36
46
54
66
% chg
12.7
31.2
29.2
26.8
17.7
23.3
(% of Net Sales)
16.7
17.5
18.8
18.8
18.2
17.2
Depreciation & Amortisation
5
6
6
7
10
13
EBIT
16
22
30
39
44
53
% chg
6.4
34.5
36.3
30.8
11.8
20.7
(% of Net Sales)
12.9
13.8
15.7
16.1
14.8
13.7
Interest & other charges
3
4
3
3
4
6
Other Income
2
2
2
5
8
9
(% of Net Sales)
1.9
1.2
1.3
2.1
2.7
2.3
Recurring PBT
13
18
27
36
40
47
% chg
0.8
36.8
52.2
32.9
8.9
17.7
Extraordinary expense/(Inc.)
(0)
(1)
(0)
(1)
(1)
(1)
PBT (reported)
16
20
30
42
49
57
Tax
5
7
10
15
17
20
(% of PBT)
35.3
34.2
34.4
35.3
35.3
35.3
PAT (reported)
10
14
20
27
31
37
PAT after MI (reported)
10
14
20
27
31
37
ADJ. PAT
10
14
20
27
31
37
% chg
10.7
41.1
39.5
38.4
14.6
16.5
(% of Net Sales)
7.9
8.9
10.4
11.3
10.6
9.5
Basic EPS (`)
8
11
16
22
25
29
Fully Diluted EPS (`)
8
11
16
22
25
29
% chg
10.7
41.1
39.5
38.4
14.6
16.5
Dividend
1
1
2
3
3
3
Retained Earning
9
13
18
24
28
33
March 10, 2012
10
Advisory Desk
Cera Sanitaryware
Standalone Balance Sheet
Y/E March ( ` cr)
FY2008
FY2009
FY2010
FY2011
FY2012E
FY2013E
SOURCES OF FUNDS
Equity Share Capital
3
3
3
6
6
6
Preference Capital
-
-
-
-
-
-
Reserves & Surplus
55
68
85
105
134
167
Shareholders' Funds
58
71
89
112
140
173
Minority Interest
-
-
-
-
-
-
Total Loans
39
36
27
38
57
85
Deferred Tax Liability
12
14
13
14
14
14
Total Liabilities
110
120
129
163
211
272
APPLICATION OF FUNDS
Gross Block
94
99
99
113
173
233
Less: Acc. Depreciation
19
24
30
35
45
58
Net Block
76
74
69
78
128
175
Capital Work-in-Progress
1
0
2
6
3
3
Lease adjustment
-
-
-
-
-
-
Goodwill
-
-
-
-
-
-
Investments
-
-
-
8
8
8
Current Assets
71
89
120
146
148
187
Cash
11
22
34
36
13
15
Loans & Advances
8
10
17
21
26
34
Inventory
27
27
36
50
57
72
Debtors
26
31
33
39
53
66
Current liabilities
38
44
62
75
86
109
Net Current Assets
33
45
58
71
63
78
Mis. Exp. not written off
-
-
-
-
-
-
Total Assets
110
120
129
163
211
272
March 10, 2012
11
Advisory Desk
Cera Sanitaryware
Cash flow
Y/E March (` cr)
FY2008 FY2009 FY2010 FY2011 FY2012E FY2013E
Profit Before Tax
16
20
30
42
49
57
Depreciation
5
6
6
7
10
13
Interest paid
3
4
3
3
4
6
Change in WC
3
(1)
(0)
(11)
(15)
(14)
Other income
(2)
(2)
(2)
(5)
(8)
(9)
Direct taxes paid
(5)
(7)
(10)
(15)
(17)
(20)
Others
(8)
(2)
(2)
(0)
(1)
(1)
Cash from Operations
10
18
23
21
21
32
(Inc)/ Dec in Fixed Assets
(31)
(5)
(0)
(14)
(60)
(60)
(Inc)/Dec In Investments
-
-
-
8
-
-
Other Income
2
2
2
5
8
9
Others
7
(1)
(4)
(26)
(5)
(1)
Cash from Investing
(21)
(4)
(1)
(28)
(57)
(52)
Issue of Equity
0
0
0
3
-
-
Inc/(Dec) in Debt
10
(4)
(8)
11
19
28
Dividend Paid (Incl. Tax)
(1)
(1)
(2)
(3)
(3)
(3)
Interest paid
(3)
(4)
(3)
(3)
(4)
(6)
Others
5
6
3
4
-
2
Cash from Financing
11
(3)
(9)
9
12
21
Inc/(Dec) in cash
-
11
12
2
(24)
1
Opening cash balance
11
11
22
34
36
13
Closing cash balance
11
22
34
36
13
15
March 10, 2012
12
Advisory Desk
Cera Sanitaryware
Key ratios
Y/E March
FY2008
FY2009
FY2010
FY2011
FY2012E
FY2013E
Valuation Ratio (x)
P/E (on FDEPS)
27.7
19.6
14.1
10.2
8.9
7.6
P/CEPS
18.6
13.8
10.8
8.2
6.7
5.6
P/BV
4.8
3.9
3.2
2.5
2.0
1.6
Dividend yield (%)
0.3
0.4
0.6
0.2
0.2
0.2
EV/Sales
2.4
1.8
1.4
1.1
1.1
0.9
EV/EBITDA
14.4
10.5
7.5
6.0
5.9
5.2
EV / Total Assets
2.8
2.4
2.1
1.7
1.5
1.3
Per Share Data (`)
EPS (Basic)
8.0
11.2
15.7
21.7
24.8
28.9
EPS (fully diluted)
8.0
11.2
15.7
21.7
24.8
28.9
Cash EPS
11.9
15.9
20.5
26.8
32.7
39.6
DPS
0.7
1.0
1.2
2.5
2.5
2.5
Book Value
46.1
55.8
69.9
88.2
110.5
136.9
DuPont Analysis
EBIT margin
12.9
13.8
15.7
16.1
14.8
13.7
Tax retention ratio
0.6
0.7
0.7
0.6
0.6
0.6
Asset turnover (x)
1.3
1.6
2.1
2.2
1.6
1.6
ROIC (Post-tax)
10.7
14.7
21.2
22.4
15.2
13.8
Cost of Debt (Post Tax)
5.2
7.4
6.1
4.6
4.6
4.6
Leverage (x)
0.5
0.2
(0.1)
(0.1)
0.3
0.4
Operating ROE
13.4
16.1
20.0
21.4
17.9
17.2
Returns (%)
ROCE (Pre-tax)
16.7
19.1
24.0
26.8
23.4
21.9
Angel ROIC (Pre-tax)
20.0
22.3
31.3
38.1
29.3
24.4
ROE
19.1
22.0
24.9
27.4
25.0
23.4
Turnover ratios (x)
Asset Turnover
1.3
1.6
1.9
2.1
1.7
1.7
Inventory / Sales (days)
67
61
60
65
65
64
Receivables (days)
69
64
61
54
65
63
Payables (days)
129
113
124
127
129
125
WC cycle (ex-cash) (days)
65
54
46
52
61
60
Solvency ratios (x)
Net debt to equity
0.5
0.2
(0.1)
(0.1)
0.3
0.4
Net debt to EBITDA
1.3
0.5
(0.2)
(0.1)
0.7
0.9
Int. Coverage (EBIT / Int.)
5.2
5.5
11.8
14.4
10.7
8.6
March 10, 2012
13
Advisory Desk
Cera Sanitaryware
Advisory Team Tel: (91) (022) 39500777
DISCLAIMER
This document is solely for the personal information of the recipient, and must not be singularly used as the basis of any investment
decision. Nothing in this document should be construed as investment or financial advice. Each recipient of this document should make
such investigations as they deem necessary to arrive at an independent evaluation of an investment in the securities of the companies
referred to in this document (including the merits and risks involved), and should consult their own advisors to determine the merits and
risks of such an investment.
Angel Broking Limited, its affiliates, directors, its proprietary trading and investment businesses may, from time to time, make
investment decisions that are inconsistent with or contradictory to the recommendations expressed herein. The views contained in this
document are those of the analyst, and the company may or may not subscribe to all the views expressed within.
Reports based on technical and derivative analysis center on studying charts of a stock's price movement, outstanding positions and
trading volume, as opposed to focusing on a company's fundamentals and, as such, may not match with a report on a company's
fundamentals.
The information in this document has been printed on the basis of publicly available information, internal data and other reliable
sources believed to be true, but we do not represent that it is accurate or complete and it should not be relied on as such, as this
document is for general guidance only. Angel Broking Limited or any of its affiliates/ group companies shall not be in any way
responsible for any loss or damage that may arise to any person from any inadvertent error in the information contained in this report.
Angel Broking Limited has not independently verified all the information contained within this document. Accordingly, we cannot testify,
nor make any representation or warranty, express or implied, to the accuracy, contents or data contained within this document. While
Angel Broking Limited endeavors to update on a reasonable basis the information discussed in this material, there may be regulatory,
compliance, or other reasons that prevent us from doing so.
This document is being supplied to you solely for your information, and its contents, information or data may not be reproduced,
redistributed or passed on, directly or indirectly.
Angel Broking Limited and its affiliates may seek to provide or have engaged in providing corporate finance, investment banking or
other advisory services in a merger or specific transaction to the companies referred to in this report, as on the date of this report or in
the past.
Neither Angel Broking Limited, nor its directors, employees or affiliates shall be liable for any loss or damage that may arise from or in
connection with the use of this information.
Note: Please refer to the important `Stock Holding Disclosure' report on the Angel website (Research Section). Also, please refer to the
latest update on respective stocks for the disclosure status in respect of those stocks. Angel Broking Limited and its affiliates may have
investment positions in the stocks recommended in this report.
Disclosure of Interest Statement
Cera Sanitary
1. Analyst ownership of the stock
No
2. Angel and its Group companies ownership of the stock
No
3. Angel and its Group companies' Directors ownership of the stock
No
4. Broking relationship with company covered
No
Note: We have not considered any Exposure below ` 1 lakh for Angel, its Group companies and Directors
Ratings (Returns):
Buy (> 15%)
Accumulate (5% to 15%)
Neutral (-5 to 5%)
Reduce (-5% to 15%)
Sell (< -15%)
March 10, 2012
14