Initiating coverage | Capital Goods
June 29, 2015
Bharat Earth Movers (BEML)
BUY
CMP
`1,218
Metro + Mining Equip. + Defense = All triggers in place...
Target Price
`1,414
Metro: The Metro investment cycle in the country is to pick up with over `15,000cr
Investment Period
12 Months
worth of Rolling Stock to be awarded during FY2016-20E. BEML being a low cost
player (vis-a-vis Bombardier and Alstom India), is well positioned to gain the most
Stock Info
from this opportunity.
Sector
Capital Goods
Mining Equipment: 70-80% of BEML’s mining equipment sales come from Coal
Market Cap (` cr)
5,038
India (CIL) and other PSUs. We envisage strong mining equipment award activity
Net debt (` cr)
448
from CIL (as per CIL’s internal projections, it intends to procure 5,263 equipments during
Beta
1.3
FY2016-20E) and other PSUs (SAIL, NMDC) which are on a capex spree. This augurs well
52 Week High / Low
1,289/515
for growth prospects of BEML’s Mining & Construction Equipment (MCE) segment.
Avg. Daily Volume
75,345
Defense: BEML has a monopolistic position for supplying Tatra trucks to the
Face Value (`)
10
Indian Army. Removal of ban on Tatra trucks coupled with higher budgetary
BSE Sensex
27,812
allocations towards the Defense sector indicate strong growth prospects for
Nifty
8,381
BEML’s Defense segment.
Reuters Code
BEML.BO
Poised to report strong growth; some early signs already visible: Higher Budgetary
Bloomberg Code
BEML@IN
allocations towards urban infrastructure (especially metros) and defense sector,
coupled with recent mining sector announcements, strengthen our view that good
times are ahead for BEML. We expect BEML to post a 19% top-line CAGR during
Shareholding Pattern (%)
FY2015-17E to `4,006cr. Demand recovery, strong market positioning (almost
Promoters
54.0
virtual monopoly), coupled with execution of cost cutting initiatives, strengthen our
MF / Banks / Indian Fls
20.1
view that BEML would experience strong margin recovery. Accordingly, EBITDA
FII / NRIs / OCBs
6.8
margins are expected to expand from 2.5% in FY2015 to 8.9% in FY2017E. With
Management highlighting that it does not foresee any major capex for FY2016-
Indian Public / Others
19.1
17E, we expect entire benefits of EBITDA margin expansion to flow down to PAT
level (PAT margins would grow from 0.2% in FY2015 to 6.7% in FY2017E).
Abs. (%)
3m 1yr 3yr
Valuations: At the current market price of `1,218/share, BEML is trading at
Sensex
2.3
10.8
63.9
FY2017E P/E multiple of 19.0x. Historically, since Feb-2001, BEML’s stock has
BEML
31.0
50.9
221.3
traded at 1-year forward P/E multiple of 27x (excluding the time when BEML
made losses). On assigning P/E multiple of 22.0x to our FY2017E EPS estimate of
`64/share, we arrive at price target of `1,414, estimating 19% top-line and 529%
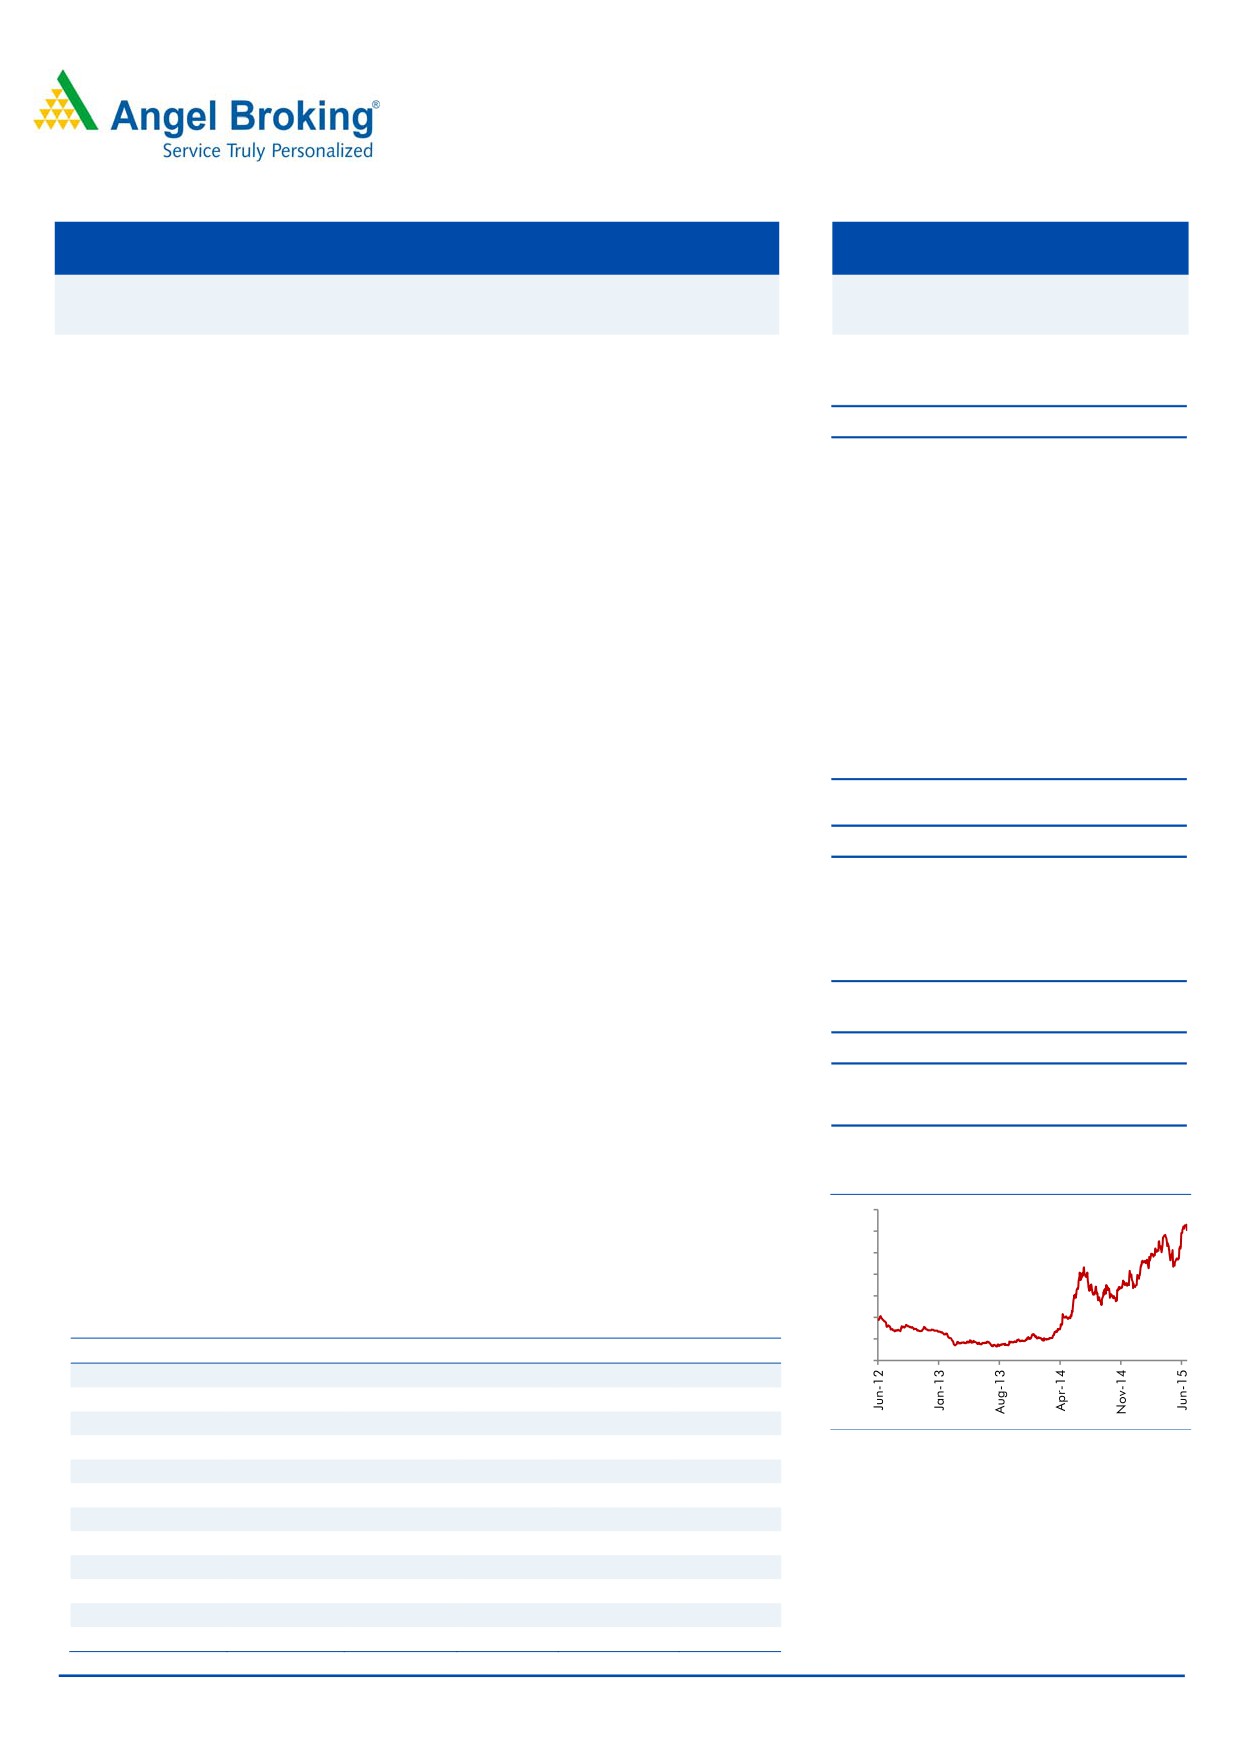
3-Year Daily price chart
bottom-line CAGR during FY2015-17E. Alternatively, BEML’s stock at `1,218 is trading
1400
at FY2017E EV/sales of 1.3x. At the implied price target of `1,414/share, BEML would
1200
1000
trade at FY2017E EV/sales of 1.5x, which is at ~12% discount to its long-term average.
800
Given the 16% upside from current levels, we initiate coverage on BEML with Buy rating.
600
400
Key Financials
200
Y/E March (` cr)
FY13
FY14
FY15P
FY16E
FY17E
0
Net Sales
2,809
2,912
2,809
3,277
4,006
% chg
3.0
3.7
(3.5)
16.7
22.2
Net Profit
(80)
5
7
122
268
Source: Company, Angel Research
% chg
NMF
NMF
44.8
1699.6
120.0
EBITDA (%)
(1.6)
3.9
2.5
6.0
8.9
EPS (`)
(19.2)
1.1
1.6
29.2
64.3
P/E (x)
NMF
NMF
NMF
41.7
19.0
P/BV (x)
2.4
2.4
2.4
2.3
2.1
RoE (%)
(4.3)
0.4
0.3
5.7
11.7
RoCE (%)
(2.8)
1.8
0.6
4.9
10.2
Yellapu Santosh
EV/Sales (x)
2.2
2.1
2.0
1.6
1.3
022 - 3935 7800 Ext: 6811
EV/EBITDA (x)
NMF
52.7
79.0
27.3
14.4
Source: Company, Angel Research; Note: NMF- Not Meaningful, CMP as of June 26, 2015
Please refer to important disclosures at the end of this report
1
Initiating coverage | BEML
Rail & Metro- massive growth opportunity
With Metro investment cycle likely to see uptick, BEML being a low cost
manufacturer (vis-a-vis Bombardier and Alstom India, the only two other players
having Rolling Stock plants in India) is likely to gain the most. We estimate BEML to
report 18% revenue and 383% EBIT CAGR during 2015-17E.
Strong growth outlook for domestic Metro Industry
Considering the government’s increased thrust towards Metros in urban areas, we
are of the view that we are at the beginning of a multi-year investment cycle in
Metro projects, the first indicator being 36% higher allocation towards Urban
Metro Projects in the last budget to `8,193cr vs `6,019cr in FY2014-15.
Exhibit 1: Budgetary Allocation towards Urban Metro
(` in cr)
Actual 2013-2014
Budget 2014-2015
Revised 2014-2015
Budget 2015-2016
Plan
Non-Plan Total Plan Non-Plan Total Plan Non-Plan Total Plan Non-Plan Total
Delhi Metro Rail Corp.
2,485
0
2,485
3,324
0
3,324
3,073
0
3,073
4,134
0
4,134
Bangalore Metro Rail Corp.
845
0
845
948
0
948
1,372
0
1,372
996
0
996
Kolkata Metro Rail Corp.
10
0
10
20
0
20
0
0
0
30
0
30
Chennai Metro Rail Ltd.
1,992
0
1,992
1,866
0
1,866
1,007
0
1,007
1,024
0
1,024
Mumbai Metro
0
0
0
876
0
876
0
0
0
109
0
109
Jaipur Metro
0
0
0
234
0
234
0
0
0
421
0
421
Kochi Metro
125
0
125
462
0
462
541
0
541
599
0
599
Ahmedabad Metro
0
0
0
50
0
50
0
0
0
427
0
427
Pune Metro
0
0
0
0
0
0
0
0
0
127
0
127
Lucknow Metro
0
0
0
50
0
50
15
0
15
173
0
173
Vizag Metro
0
0
0
10
0
10
1
0
1
6
0
6
Vijayawada Metro
0
0
0
10
0
10
1
0
1
6
0
6
Nagpur Metro
0
0
0
0
0
0
10
0
10
144
0
144
Investment in Public Enterprises
5,457
0
5,457
7,850
0
7,850
6,019
0
6,019
8,193
0
8,193
Source: Budget Docs, Angel Research
In addition to the above mentioned (Exhibit 1) Metro projects, which are at various
stages of execution, Detailed Project Report (DPR) and preliminary studies have
also been prepared/ conducted across Thiruvananthapuram, Kozhikode, Varanasi,
Agra, Meerut, Patna and Kanpur.
New Orders from existing Metro projects to be awarded
Of the total ongoing works across 9 Metro projects, 2 of them are at very early
stages of implementation. Of the remaining 7 ongoing Metro projects, we expect
6 of them to come-up with the next round of Rolling Stock orders during
FY2016-18E.
June 29, 2015
2
Initiating coverage | BEML
Exhibit 2: Ongoing Metro Project Details
Total Project
Metro Project details
Comments
Cost (` cr)
Phase I and II are completed (total cost of `29,600cr); Phase III at cost of `35,000cr
is under construction (66% works done; to be completed by Dec-2016); 486 train
Delhi Metro Rail Corp. (Phase I-III)
64,600
coaches worth `4,000cr were awarded to Hyundai Rotem (120 coaches to be made
in South Korea and 366 coaches in Bengaluru);
Phase I is partly operational; 38.3km of the total 42.3km to be finished by Dec-
2015; Phase II with outlay of `26,405cr (on FY2012 no’s) is under planning;
Bangalore Metro Rail Corp. (Phase I-II)
40,300
Rolling stock for Phase I has been awarded; Phase II is yet to be awarded (worth
`918cr).
Phase I is operational; Phase II-IV are under various stages of implementation;
Phase II (only)
Kolkata Metro Rail Corp. (Phase I-IV)
Rolling stock for Phase II has been procured from CAF-Melco JV; Rolling stock for
5,000
Phase III worth `714cr is yet to be ordered.
TPC for Phase I is at `20,000cr; DPR for Phase II has been submitted, with
estimated project cost of `36,000cr; Commissioner of Railway Safety checked trial
Phase II (only)-
Chennai Metro Rail Ltd. (Phase I only)
runs for Phase I; First set of Phase I operations to start in H1FY2016E; Of the total
20,000
42 trains (worth `1,478cr) ordered- 9 from Brazil and 12 from Sri City have been
procured; for the remaining, work is in progress.
Phase I is operational, Phase II is under planning stages and Phase III tenders for
Phase II & III-
Mumbai Metro (Phase I-III)
underground structure/ Car depot have been floated; final selection of construction
34,136
firm is awaited; Rolling stock worth `3,755cr is to be awarded for Phase II & III.
Phase IA (Mansarovar-Chandpole station) has commenced operations; `1,126cr
for Phase IB has been spent towards civil works, depot, rolling stock (`100cr), sub-
Jaipur Metro (Phase IA & IB)
4,175
stations and systems; BEML was awarded `318cr of Rolling Stock (including order
for Phase IB worth `100cr); BEML expects another follow-on order worth `60cr.
51% of the civil works at stretch 1A and 17% of the civil works at stretch IB have
been executed; Stretch IA of Phase I to commence operations from early 2016E;
Kochi Metro (Phase I)
5,189
Alstom was awarded the project to supply rolling stock (worth `630cr); Contract
with Alstom also includes the option to supply another 25 train sets.
J Kumar was awarded `278cr order for works across Vastral-Apparel park stretch
of Phase I; First 6km route of Tahltej-Vastral Phase I to be completed by Sep-2016
Ahmedabad Metro (Phase I)
10,773
at a cost of `611cr; Phase I to get commissioned by 2018; Already `565cr spent till
May 30, 2014 for Phase I works; Rolling stock worth `960cr to be awarded.
Works between Airport-Charbagh station have started; In Dec-2014, global tenders
Lucknow Metro
8,000
for coaches were floated; DPR assumes rolling stock cost at `1,200cr; Tenders for
80 rolling stock have been floated, these are to open anytime.
Total Investment in Metro Projects
133,037
Source: Company, Metro DPRs, pib.nic.in
With more announcements expected towards Greenfield Metros, we expect the
opportunity from Metros to get bigger during FY2016-20E.
Over `15,000cr of Rolling stock orders in pipeline…
Based on a report by BB&J Consulting and our internal assessment of domestic
Metros’ DPRs, we are of the view that Rolling stock cost as % of the Total Project
Cost (TPC) stands at somewhere between 15-25%.
Based on the DPRs prepared and the budgeted allocations towards Rolling stock,
we are of conservative view that award activity for over `15,000cr worth of Rolling
stock would be made during FY2016-20E.
June 29, 2015
3
Initiating coverage | BEML
Exhibit 3: Rolling Stock cost as % of Metro Project Cost
Sl.
Rolling Stock as %
International Metro's
No.
of Project Cost
1
Mexico City Line B
36.2
2
Caracas Line 3
15.7
3
Santiago Line 5
24.8
4
Santiago Line 5 Extension
21.4
5
Delhi Metro (Phase I and II)
24.2
6
Madrid Extension (excl. Arganda)
15.4
Source: BB&J Consult (2000), Angel Estimates
BEML enjoys ‘lowest cost maker’ tag….well positioned to gain
Currently, there are only 3 major players Rolling Stock manufacturers for Metros in
India, with yearly capacity of ~660 units, namely, BEML, Bombardier and Alstom
India. BEML has tied-up with Hyundai-Rotem for technology part to manufacture
AC Metro coaches.
Exhibit 4: Metro Industry- Competitive Analysis
Installed
Capacity
Orders
Rolling Stock
Sl. No.
Plant Location
Capacity
Utilized
Booked
Ongoing projects & Comments
Manufacturers
(p.a.)
(p.a.)
for (yrs.)
Bengaluru,
Over 2
Delhi Metro Projects ongoing; BEML has one of
1
BEML
190
190
Karnataka
years
the lowest cost/ unit vs. peers, at `8-8.5cr/unit;
Supply 450 units to Australia; Exports to Australia
from India to begin from CY15-end; Working on
Bombardier
Savli,
Over 2
2
350
350
projects from Brazil & Saudi Arabia; Currently
India
Gujarat
years
working on the supply of 72 rakes for Mumbai's
Sub-Urban Rail Network
To supply 135 units to Australia; On Single shift
basis, on shifting to double shift installed capacity
could increase to 250 units; In next 2-3 yrs,
SriCity,
Over 2
Alstom plans to export 50%+ of domestically
3
Alstom India
120
120
Andhra Pradesh
years
manufactured Rolling Stock to Australia, APAC
and Americas; Some part of the Kochi Metro
Order has been sub-contracted to Faiveley
Transport
Source: BEML, Alstom India, Media Articles (published in CY2015), Angel Research
In addition to these 3 players, BEML also faces competition from international
players like Siemens, Mitsubishi, Kawasaki, and Band Changchun, who do not
have any manufacturing presence in India.
Based on our channel checks and Management commentary, the cost of
manufacturing a Metro coach ranges from
`8cr-12cr. Amongst the three
companies, BEML with higher indigenization, enjoys the most favorable cost
structure. Also, these MNCs have lower indigenization component and their inputs
comprise of relatively higher proportion of imports; going forward the unfavorable
June 29, 2015
4
Initiating coverage | BEML
rupee movement against the dollar may force them to bid at higher quotes vs
BEML’s quotes. Both the MNC players are also using their Indian subsidiaries to
execute their global orders. This, coupled with their current higher plant utilization
suggests that they may not bid aggressively for upcoming projects in near-term.
Recent order wins give order book and revenue growth visibility
BEML, in recent times, has reported 2 Rolling stock orders from Delhi Metro Rail
Corp. (DMRC). The first order is worth `570cr to supply 70 cars, and the second
order is worth `645cr to supply 74 cars.
BEML, as of FY2015-end, was sitting on strong order book of `1,588cr, executable
over next 12-18 months. Strong market positioning, coupled with improvement in
the award activity environment, gives strong revenue growth visibility for next few
years.
On a whole….Rail & Metro segment poised for strong growth
At the backdrop of emerging opportunity for Rolling Stock coaches, coupled with
BEML’s strong market positioning, indicates that BEML is likely to emerge as one of
the beneficiaries from revival in Indian Railway (IR) and Metro award activity.
Considering BEML’s outstanding order book of `1,588cr and strong execution, we
expect BEML’s Rail & Metro segment (35% of FY2015 revenues) to report 18% top-
line and
383% EBIT CAGR during FY2015-17E to
`1,371cr and
`70cr,
respectively.
June 29, 2015
5
Initiating coverage | BEML
Defense- removal of Tatra ban to drive earnings
With removal of ban on Tatra trucks and BEML being the only supplier of Tatra
trucks to Indian Army, we believe BEML’s Defense segment is well positioned to
report 105% revenue CAGR and turnaround in its EBIT during 2015-17E.
Removal to Tatra trucks ban…positive for the company
BEML’s Defense segment derives a major chunk of its revenues from (1) Tatra
vehicles which are used for carrying various types of missiles and rocket launchers
and (2) Armored Recovery Vehicles. Since 1986, BEML has supplied close to 7,000
Tatra trucks to the Indian Army. Currently, BEML is the only domestic player
eligible to procure/make Tatra trucks in India, thereby giving it a monopolistic
position.
In 4QFY2015, BEML was allowed to supply spare parts as well as Tatra trucks to
Indian Army on fulfillment of key conditions, such as, no direct dealing with any of
the banned entities. The removal of ban in a monopolistic scenario augurs well for
the growth prospects of BEML’s Defense segment. Given BEML’s higher
dependency on Tatra trucks, the lifting of ban should lead to strong revival in the
Defense business, going forward.
Recent announcements hint at govt. increasing Defense spending
The government in recent times has made positive announcements, which indicate
revival in Defense investment cycle. To encourage domestic manufacturing, the
government has (1) increased the FDI cap in the Defense sector (from 26% to
49%), (2) launched ‘Make in India’ theme, where greater emphasis has been laid
on procurement of locally made parts/ machines/ equipments, and (3) increased
budgetary allocation towards the Defense sector by 15.4% yoy to `94,588cr. Also,
in order to encourage better technical know-how, the government is applying for
permanent membership in the Missile Technology Control Regime (MTCR).
Defense Order book of `2,483cr, gives better revenue visibility
BEML, as of FY2015-end, is sitting on an order book of `2,483cr, executable over
the next 18-24 months. With an almost virtual monopoly, coupled with removal of
ban on Tatra trucks, gives better revenue visibility for FY2016-17E.
On a whole….Defense segment to see strong business recovery
Higher budgetary allocations coupled with surge in bid pipeline indicate that
higher Defense spending by government is real and likely to pan-out. Given that
Tatra vehicles are used for carrying various missiles and rocket launchers, uptick in
Defense spending by government would also reflect higher spending towards Tatra
vehicles and Armored Recovery Vehicles (ARVs). On a whole, we expect the
Defense segment (accounted for 6% of FY2015 revenues) to report 105% top-line
CAGR over FY2015-17E to `678cr. Further, we expect turn-around in Defense
segment EBIT in FY2016E to `21cr, which should further increase to `41cr in
FY2017E.
June 29, 2015
6
Initiating coverage | BEML
Mining & Con. Equip. segment - growth & margins to
revive
Coal India (CIL) and other PSUs account for 70-80% of BEML’s mining equipment
sales. Any revival in capex cycle at CIL augurs well for the growth prospects of
BEML’s MCE segment. We expect the MCE segment to report 9% revenue and 25%
EBIT CAGR during 2015-17E.
CIL’s increased production target to spur Mining Equip. ordering
The government in recent times (1) set an ambitious 1bn tonne output target for
CIL by 2020, (2) auctioned coal mines (Schedule I and II done, Schedule III to be
awarded) to private players, and (3) shared clarity on e-auction of various minerals
and metals. All these initiatives are a precursor to accelerate the Mining sector,
which in turn should revive the demand for mining equipments.
Exhibit 5: Coal India Machinery Procurement plans (for FY2016-20E)
2014
2015
2016E
2017E
2018E
2019E
2020E
Coal Prod. Act./ Guidance (mn tn)
462
494
548
598
661
774
908
Incremental Production (mn tn)
10
32
54
50
63
113
134
Shovel (5-42 m3)
715
732
Replacement & New demand
159
175
193
156
178
Dumper (35-240 T)
3,109
2,977
Replacement & New demand
520
992
1,082
329
521
Crawler Dozer (320-850 hp)
972
977
Replacement & New demand
123
121
149
70
46
Grader (280-500 hp)
Replacement & New demand
1
9
5
5
12
SDL (1.5 m3 to 3.5 m3)
669
668
Replacement & New demand
45
110
44
14
42
LHD (1.5 m3 to 3.5 m3)
342
340
Replacement & New demand
19
22
22
21
32
Continuous Miner (4.8 m )
8
8
Replacement & New demand
22
9
7
6
2
Total Equipments (o/s at CIL)
5,815
5,702
Replacement & New demand
889
1,438
1,502
601
833
Source: CIL, Angel Research
In order to attain its FY2020 output target, CIL in its presentation to the Power
Ministry in Jan-2015 highlighted that it has started focusing on strategies to
improve its efficiency, like switching from current low capacity to high capacity
mining equipments, and implement new mining technologies. In this regard CIL,
along with its subsidiaries, has outlined higher capex outlay (intends to procure
5,263 Mining equipments). Exhibit 5 highlights capex outlay for various key types
of mining equipments, CIL intends to purchase during FY2016-20E.
Pent-up demand from CIL to come-up for awarding…
CIL during FY2013-15 has increased its production by 42mn tonne to 494mn
tonne. Based on our analysis, Mining Equipment outstanding at CIL during the
June 29, 2015
7
Initiating coverage | BEML
period has been on a declining trend (total Mining Equipments in use declined
from 6,012 units in FY2013 to 5,815 units in FY2014 and 5,702 units in FY2015).
This disconnect in number of Mining Equipments used to increase production
numbers, indicates that demand for new Mining Equipments has been postponed
for some time now. This coupled with CIL’s ambitious growth plans (to increase the
production from 494mn tonne in FY2015 to 1bn tonne by 2020), along with its
cash balance of `53,092cr (as of FY21015 end), indicate that awarding of new
mining equipments by CIL is inevitable. Accordingly, we expect tenders for this
pent-up demand to come-up in FY2016-17E, which translates to strong demand
uptick for BEML’s Mining Equipments.
PSUs too pursuing the next round of capex…
In addition to CIL, SAIL and NMDC are also on an expansion spree, which indicate
higher capex outlay towards Mining Equipment. This can be seen from the point
that SAIL intends to expand its hot metal installed capacity from 14.4mn tonne in
FY2015 to 20.2mn tonne by FY2017E. Whereas, NMDC on the other hand,
intends to increase its Iron ore installed capacity from 31.0mn tonne in FY2015 to
37.9mn tonne by FY2017E.
Well leveraging on its existing client relationships..
BEML has well leveraged on its relationship with CIL and other PSUs, by setting-up
9 spare parts regional depots and 5 district offices, situated at client premises for
after-sales service support. This post sale support network, has led CIL to be highly
dependent on BEML (>75% of CIL’s mining equipments are procured from BEML).
This strategy helps CIL in cutting down any cost overruns and time delays, arising
due to machinery break-down. Also BEML stands to gain by understanding the
client requirements and encash on them. Notably, no other private player as of
now has set up spare part depot/ after sales service office on CIL premises.
In order to maintain CIL’s dependency for its mining equipment and leaving no
space for competition to step in, BEML is proactively trying to fulfill CIL’s machinery
needs. Attempting to do so, it has gone a step ahead by adopting measures like
(1) establishing training centers at Nagpur, KGF and Mysore to impart training to
O&M staff of coal mining companies, (2) signed “model depot agreement” with
NCL, Singrauli, where detailed advance annual coal projections along with
requirement for genuine spare parts are shared, (3) Offer MARC/ GPCC/ Cost
Cap contracts for higher output (leading to more equipments being taken up), (4)
regularly launch new product variants, which are efficient and technologically
advanced, and (5) widen product offerings to cater to client requirements (started
sale of underground mining equipments). These initiatives in our view are an
attempt by BEML to service CIL better and avert any competition. BEML almost
enjoys a virtual monopoly in providing operating mining machinery to CIL, with no
other noteworthy player competing.
June 29, 2015
8
Initiating coverage | BEML
Exhibit 6: BEML- After Sale & Parts Support network at CIL
CIL
Regional
District
Consignment
Service
Subsidiary
Office
Office
Store
Centre
Singrauli
NCL
Singrauli
with Parts Depot
Bilaspur
SECL
Bilaspur
with Parts Depot
Chandrapur
Nagpur Service-
WCL
Nagpur
with Parts Depot
HQ
Sambalpur
MCL
Bilaspur
with Parts Depot
Ranchi
CCL
with Parts Depot
Dhanbad
BCCL
Kolkata
with Parts Depot
Asansol
ECL
Kolkata
Rajmahal
with Parts Depot
Kothagudem
SCCL
Hyderabad
Ramagundam
Hyderabad
NLC
Chennai
Neyveli
Source: CIL, BEML, Angel Research
Not easy for MNCs to encroach into BEML’s market share…
Even though CIL depends heavily on BEML for its mining equipment requirement,
international players like, Komatsu, Caterpillar, Hyundai, and Volvo have shown
interest in being allowed to supply mining equipments to CIL and PSUs. MNCs lack
the bid criterions in most cases, hence are not qualified to supply equipments to
CIL and other PSUs. While comparing BEML’s products with its international peers,
BEML lags behind international players on some of the Equipment efficiency
parameters, whereas on the other hand, BEML enjoys better pricing and post sale
support network, over its international peers.
Also, CIL and PSU manpower needs to be trained to operate MNC players’
equipments. This aspect, in our view, could act as a deterrent for CIL and PSUs to
switch to using MNCs’ mining equipments.
A strong case for business recovery in sight for MCE segment….
Considering uptick in overall Mining sector (especially demand emanating from
CIL and its subsidiaries), we expect BEML’s MCE segment revenues to report 9%
top-line and 25% EBIT CAGR during FY2015-17E to `1,919cr and `188cr,
respectively. Our growth estimates capture the longer duration of CIL’s tendering
cycle and possible loss of market share to international peers.
June 29, 2015
9
Initiating coverage | BEML
Investment Rationale
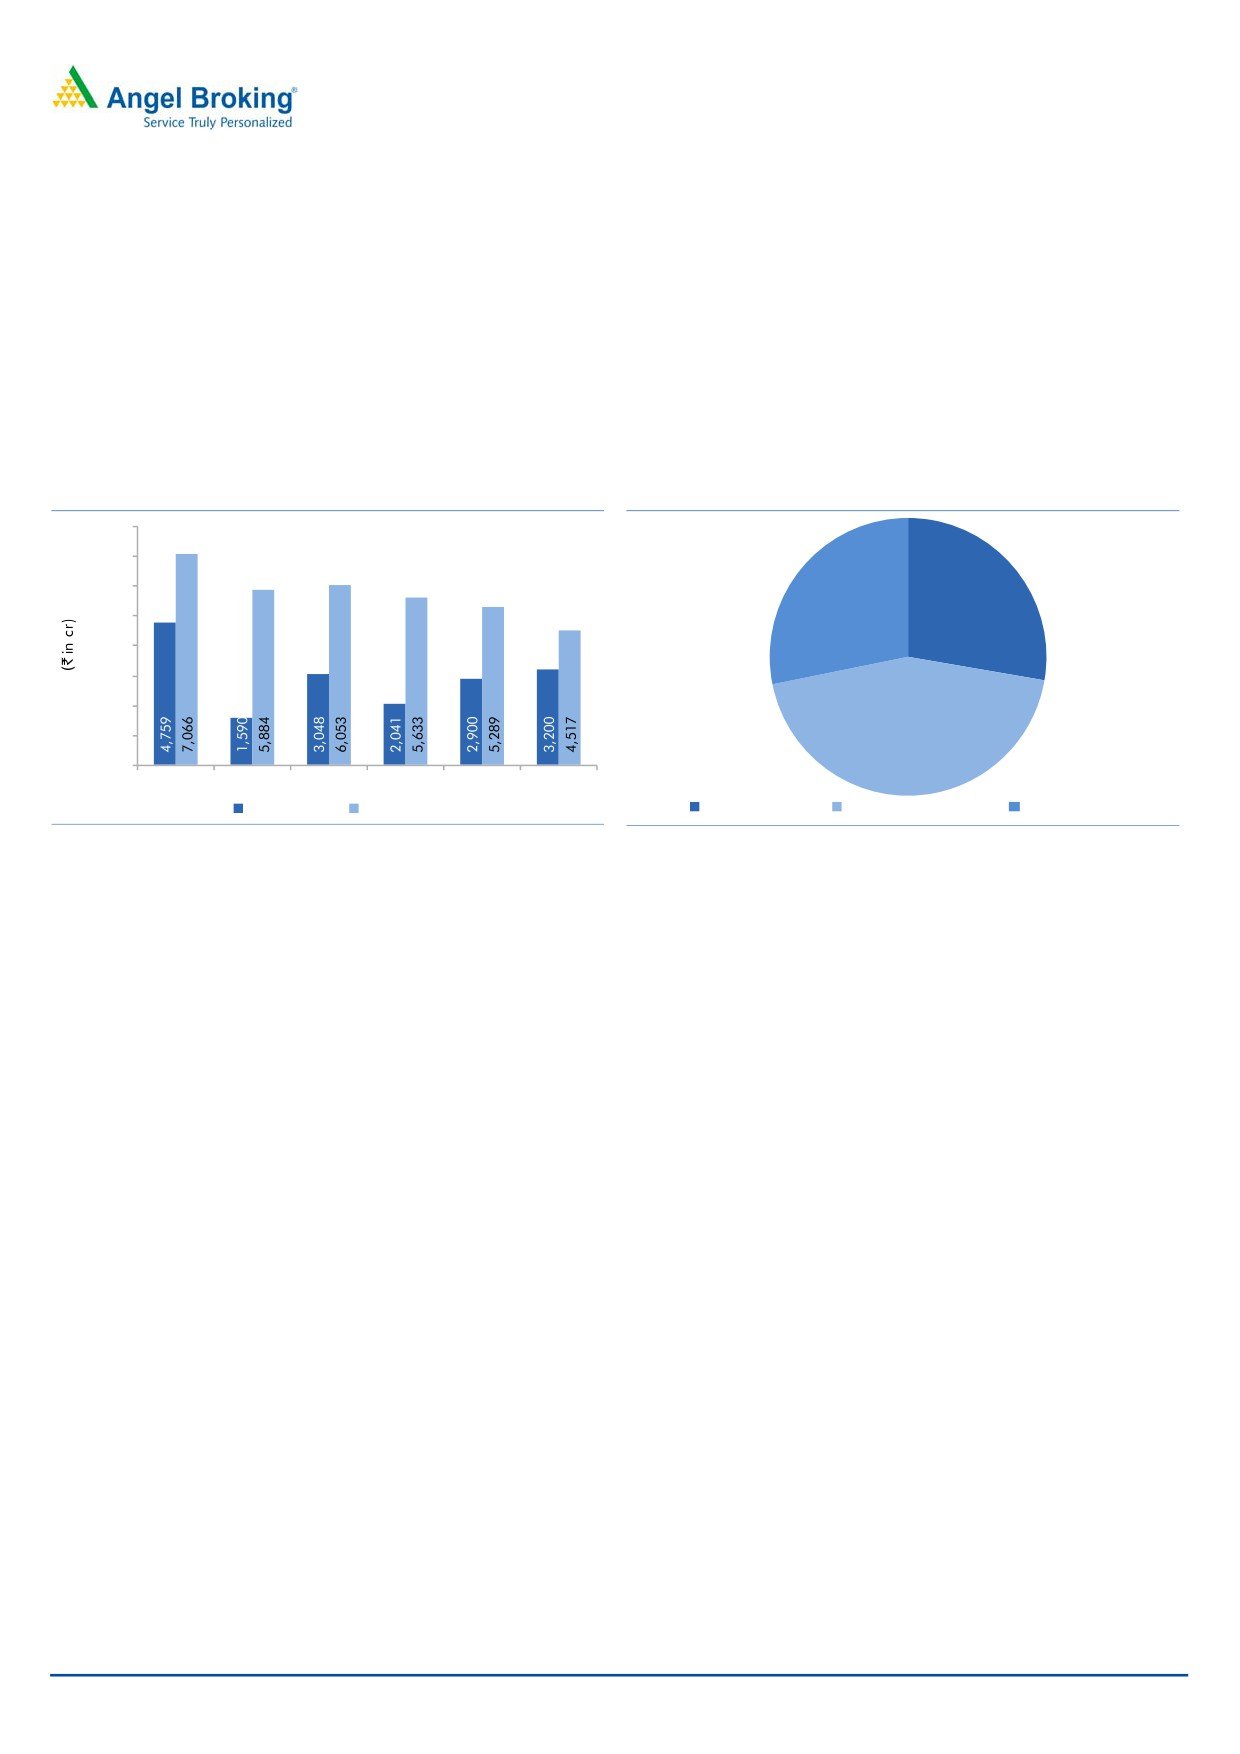
Order book set to expand…
As of FY2015-end, BEML is sitting on an order book of `5,633cr, which gives
revenue visibility for 18+ months. Further, if we look into order book details, a
major chunk of it is from the Defense segment (28% of total order book), followed
by Rail & Metro segment (44% of total order book), and Mining segment (28% of
total order book).
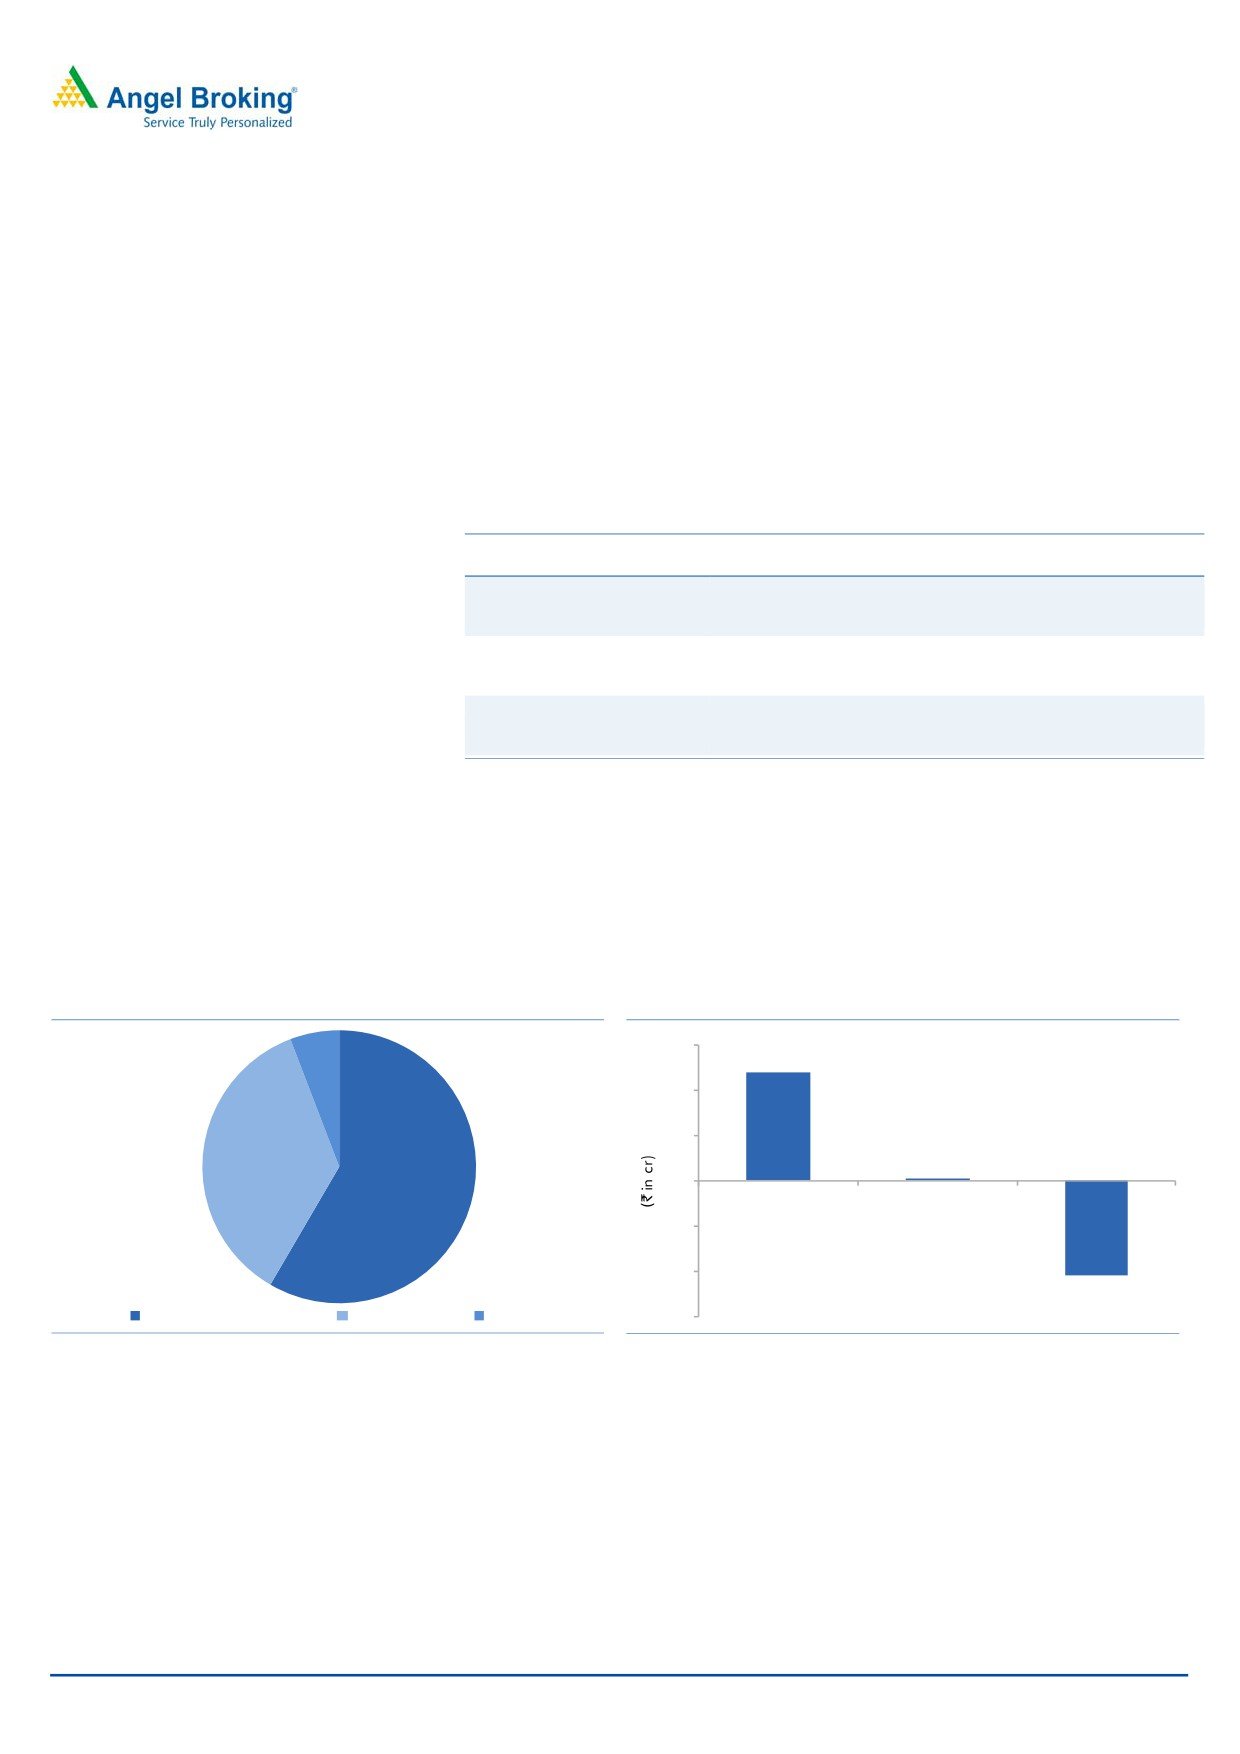
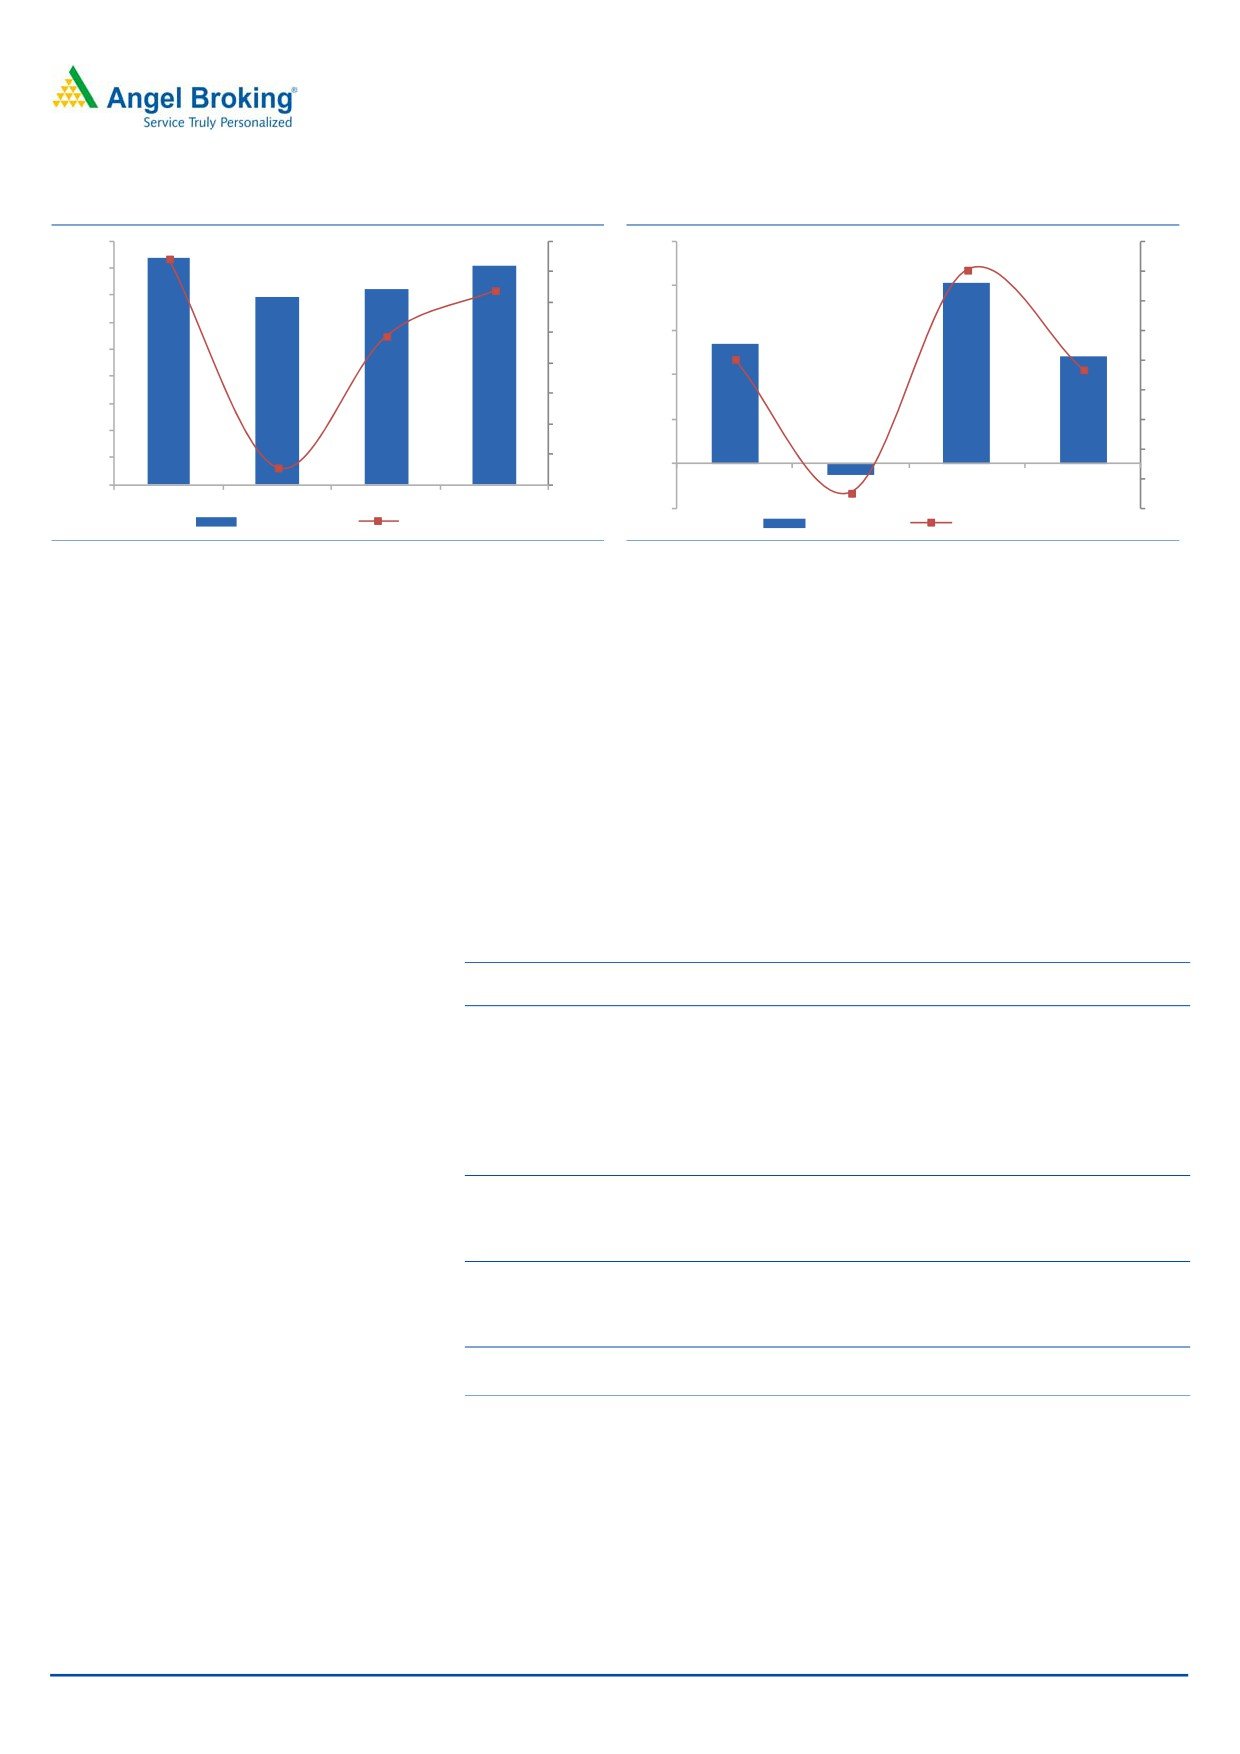
Exhibit 7: Order Inflow & Order Book movement
Exhibit 8: Order Book split (segment-wise)
8,000
7,000
6,000
28%
28%
5,000
4,000
3,000
2,000
1,000
0
44%
FY12
FY13
FY14
FY15
FY16E
FY17E
Order Inflows
Order Book
Mining segment
Rail & Metro segment
Defense segment
Source: Company, Angel Research
Source: Company, Angel Research
The government’s increased thrust towards Mining, Defense and Metro amongst
other verticals, when coupled with BEML’s strong market positioning across the
segments, strengthens our view that BEML should report 25% CAGR in its order
inflow during FY2015-17E to `3,200cr. This, on the back of strong execution,
strengthens our view that the order book would de-grow by 11% CAGR during
FY2015-17E to `4,517cr.
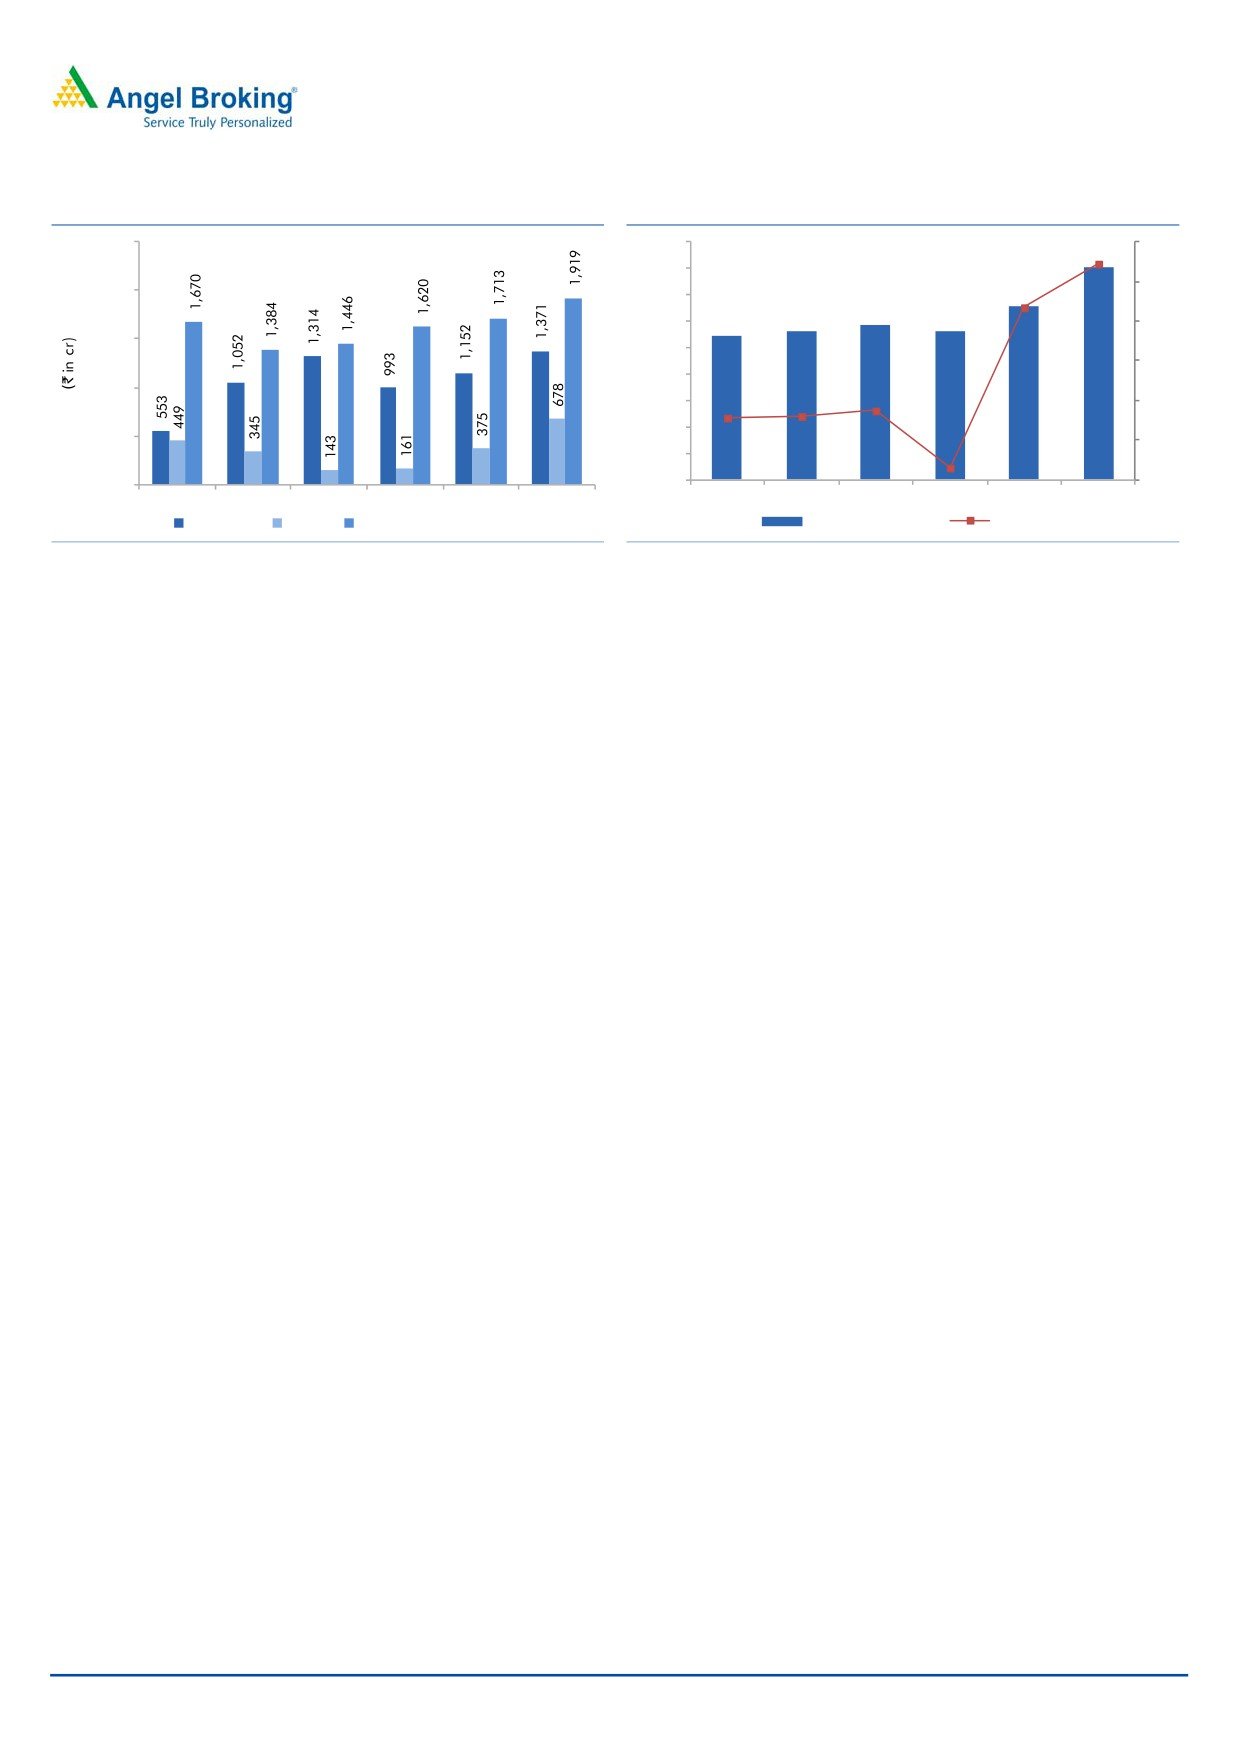
Expect strong 19% top-line CAGR during FY2015-17E…
At the backdrop of strong revival in the order inflow environment (across all the
three business segments), we expect BEML to ramp-up its execution, going
forward. We expect BEML to report strong growth across two of its business
segments, ie Rail & Metro and Defense, which have been under pressure in the last
2-3 years (on lower revenue base). The government’s thrust towards Metro
development and expansion across 15+cities will create huge demand for Rolling
stock, which in turn should benefit BEML the most, with it being one of the low cost
Metro coach manufacturers. We expect the Rail & Metro segment of the company
to report 18% top-line CAGR during FY2015-17E to `1,371cr. Further, with the
removal of ban on Tatra trucks, growth prospects for BEML’s Defense segment
look strong. We expect the Defense segment to report 105% top-line CAGR during
FY2015-17E to `678cr. Our view of strong growth in the Defense segment is
owing to (1) higher budgetary allocation made towards the Defense sector and
(2) considering that BEML is the single supplier of Tatra trucks to Indian defense.
Also, their MCE segment is expected to report
9% top-line CAGR during
FY2015-17E to `1,919cr. Growth across the MCE division would be driven by
strong new equipment demand and replacement demand emanating from CIL,
SAIL and NMDC’s capex cycle (as all of them are pursuing strong capex).
June 29, 2015
10
Initiating coverage | BEML
Exhibit 9: Segment-wise Revenue movement
Exhibit 10: Revenue & yoy growth
2,500
4,500
25%
4,006
4,000
22%
20%
2,000
3,500
3,277
2,912
2,809
2,809
3,000
2,727
15%
17%
1,500
2,500
10%
2,000
1,000
1,500
5%
1,000
500
4%
3%
3%
-4%
0%
500
(0)
-5%
(0)
FY12
FY13
FY14
FY15
FY16E
FY17E
FY12
FY13
FY14
FY15
FY16E
FY17E
Rail & Metro Defense Construction & Mining
Revenues (` in cr)
yoy growth (%)
Source: Company, Angel Research
Source: Company, Angel Research
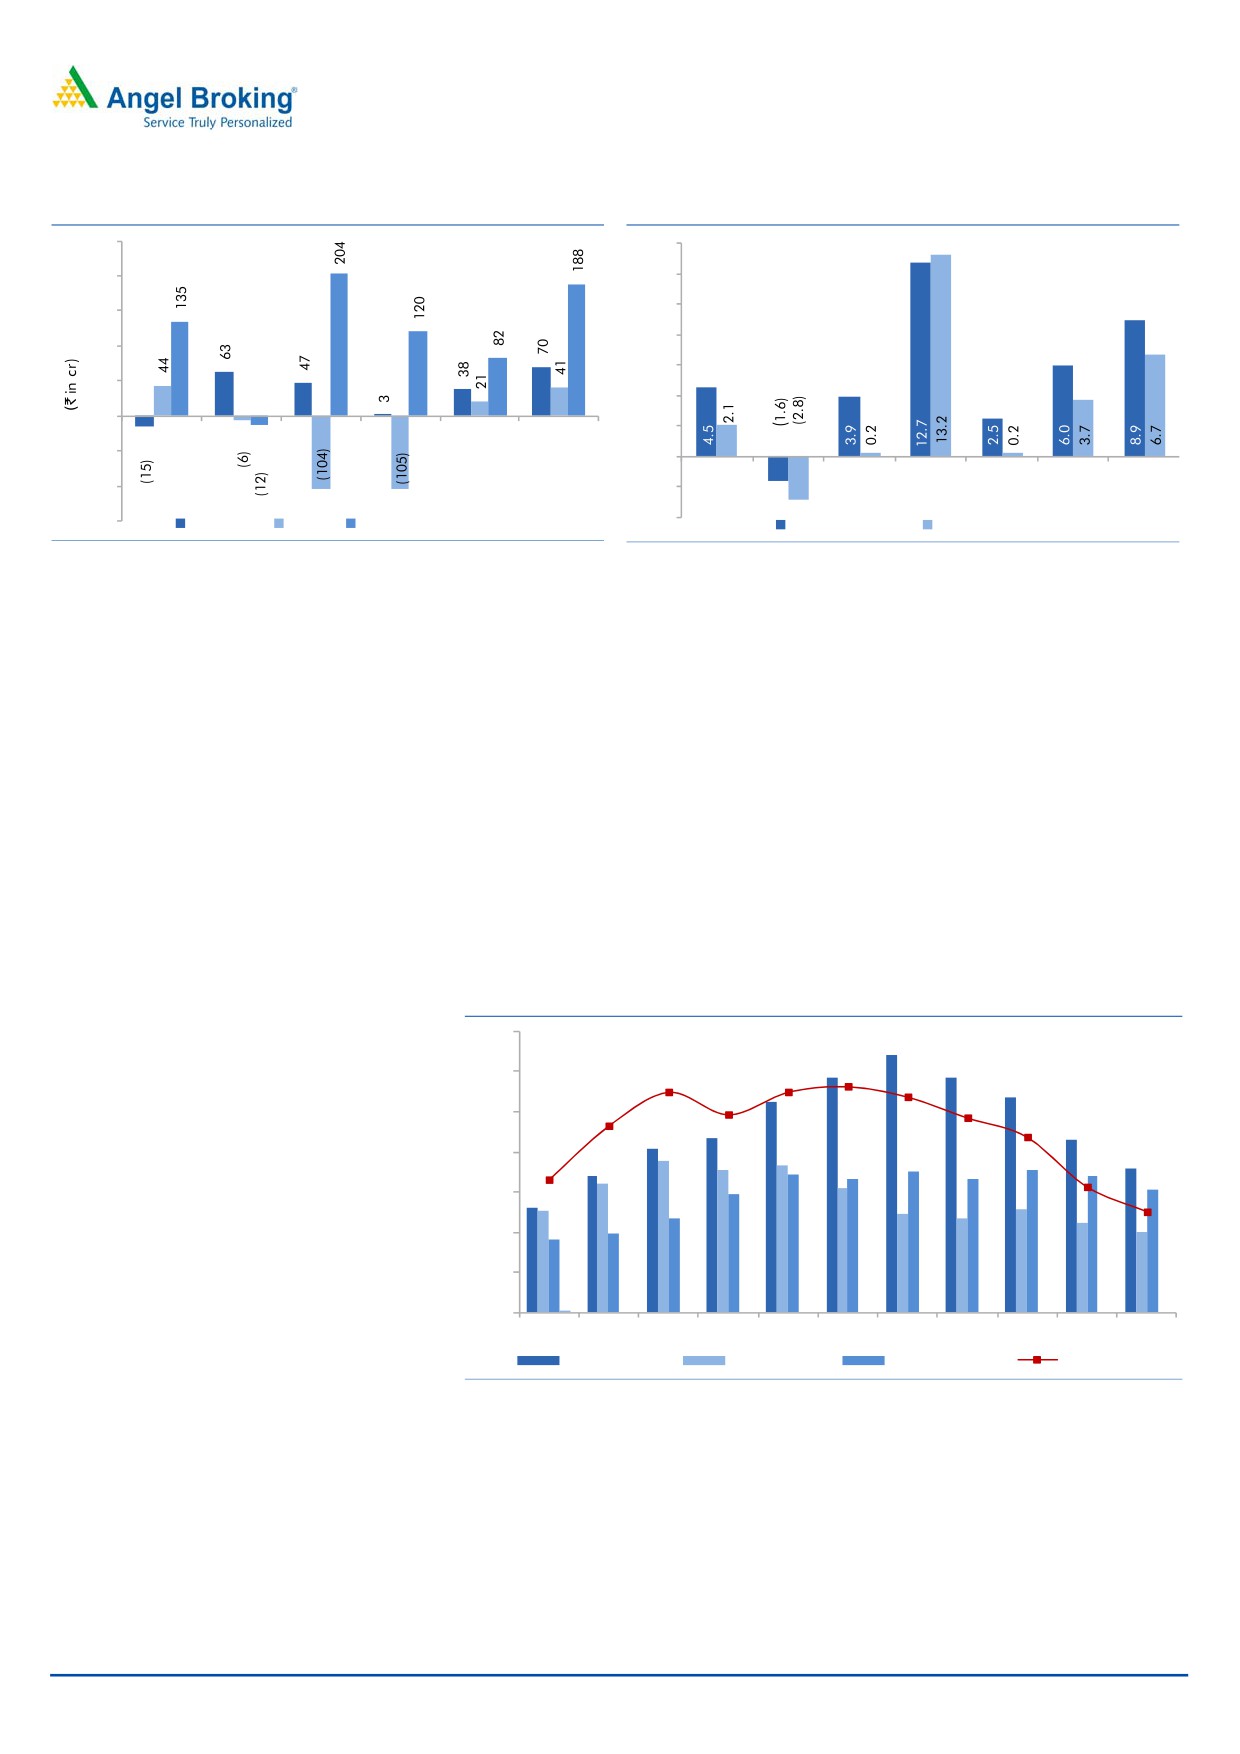
Strong execution to fuel the much required turnaround…
Higher fixed cost base across business segments and almost stagnated revenue
base has put BEML in a tough spot. BEML reported negative EBITDA margins in
FY2013 (-1.6%) and 1HFY2015 (-10.3%); margins for 1HFY2015 are the worst in
the company’s recent history. But on the back of stronger execution, 2HFY2015
witnessed a turn-around.
Further, if we look into segment-wise details, Defense segment reported margins in
red during FY2015 (reflecting weak execution). Also, Mining Equipment and Rail &
Metro segments witnessed margin contraction on account of higher fixed cost
base.
Led by revival across business segments (as highlighted above), we expect BEML to
report a strong 19% top-line CAGR during FY2015-17E to `4,006cr. BEML at
FY2015-end had 10,328 employees. Considering revenue growth potential during
FY2016-17E, when coupled with (1) ~800 employees retiring during the same
period, (2) control over admin. and marketing expenses, (3) cost control initiatives
at the shop floor level, and (4) next pay commission hike coming in to effect from
Jan-2018 only, we are of the view that BEML would be well positioned to absorb
fixed costs, which in turn should translate into margin expansion. We expect BEML
to extend its FY2015 EBITDA level turnaround to FY2016 (at 6.0%) and further
expand margins during FY2017E (to 8.9%).
June 29, 2015
11
Initiating coverage | BEML
Exhibit 11: Segment-wise EBIT
Exhibit 12: Company level EBITDA & PAT Margins
250
14.0
200
12.0
10.0
150
8.0
100
6.0
50
4.0
0
2.0
FY12
FY13
FY14
FY15
FY16E
FY17E
(50)
0.0
FY12
FY13
FY14
4QFY15
FY15
FY16E
FY17E
(100)
(2.0)
(150)
(4.0)
Rail & Metro Defense Construction & Mining
EBITDA Margins (%) PAT Margins (%)
Source: Company, Angel Research
Source: Company, Angel Research
With EBITDA level turnaround already seen, we expect the entire benefits to flow
down to PAT level. This, when coupled with ease in working capital cycle and lower
interest rate cycle, should help BEML report PAT level margin expansion. On the
whole, we expect PAT margins to improve from 0.2% in FY2015 to 6.7% in
FY2017 (reflecting sharp PAT growth from `7cr in FY2015 to `268cr in FY2017E.
Working Capital cycle to ease going forward…
BEML is well geared to capitalize on the emerging opportunities across its business
segments. Slowdown in the capex cycle across business segments had taken a toll
on the company’s growth prospects. Anticipation of sharp demand from MCE
segment led BEML build higher inventories, which contributed majorly to the stretch
in the Net Working Capital (NWC) cycle.
Exhibit 13: Decline in Inventory days to ease NWC cycle...
350
282
300
275
275
269
247
243
233
250
219
200
166
157
150
126
100
50
0
FY07
FY08
FY09
FY10
FY11
FY12
FY13
FY14
FY15
FY16E FY17E
Inventory (in days)
Debtors (in days)
CL & Prov. (in days)
NWC (in days)
Source: Company, Angel Research
However, with early indications of capex cycle revival across Mining sector, mainly
led by Coal India, we are optimistic that BEML should be able to further lower its
NWC days (from 282 days in FY2012 to 126 days in FY2017E).
Ease in the NWC cycle of BEML, in our view would lead to decline in the overall
debt levels of the company. As a result, the debt of BEML would decline from
`592cr (as of FY2015-end) to `317cr by FY2017E. Simultaneously, the Net D/E
ratio would decline from 0.2x as of FY2015-end to 0.0x by FY2017-end.
June 29, 2015
12
Initiating coverage | BEML
Upcoming business phase to see strong CFO generation…
BEML is well geared to capitalize on the emerging opportunities across its business
segments. Slowdown in the capex cycle across business segments in the past
couple of years had taken a toll on the company’s growth prospects.
Currently, all of the 9 assembly units/ plants are unable to absorb the higher fixed
cost base. At the backdrop of demand uptick across all the business segments, and
improvement in WC cycle (in terms of no. of days) when coupled with minimal
capex outlay requirements (except for maintenance capex part), lead to our view
getting strengthened that BEML is expected to report strong cash flow from
operations (CFO), going forward. We expect BEML to generate `1,140cr of cash
flow from operations during FY2015-17E, which could be used to either reinvest
back into the business or reward shareholders with higher dividend.
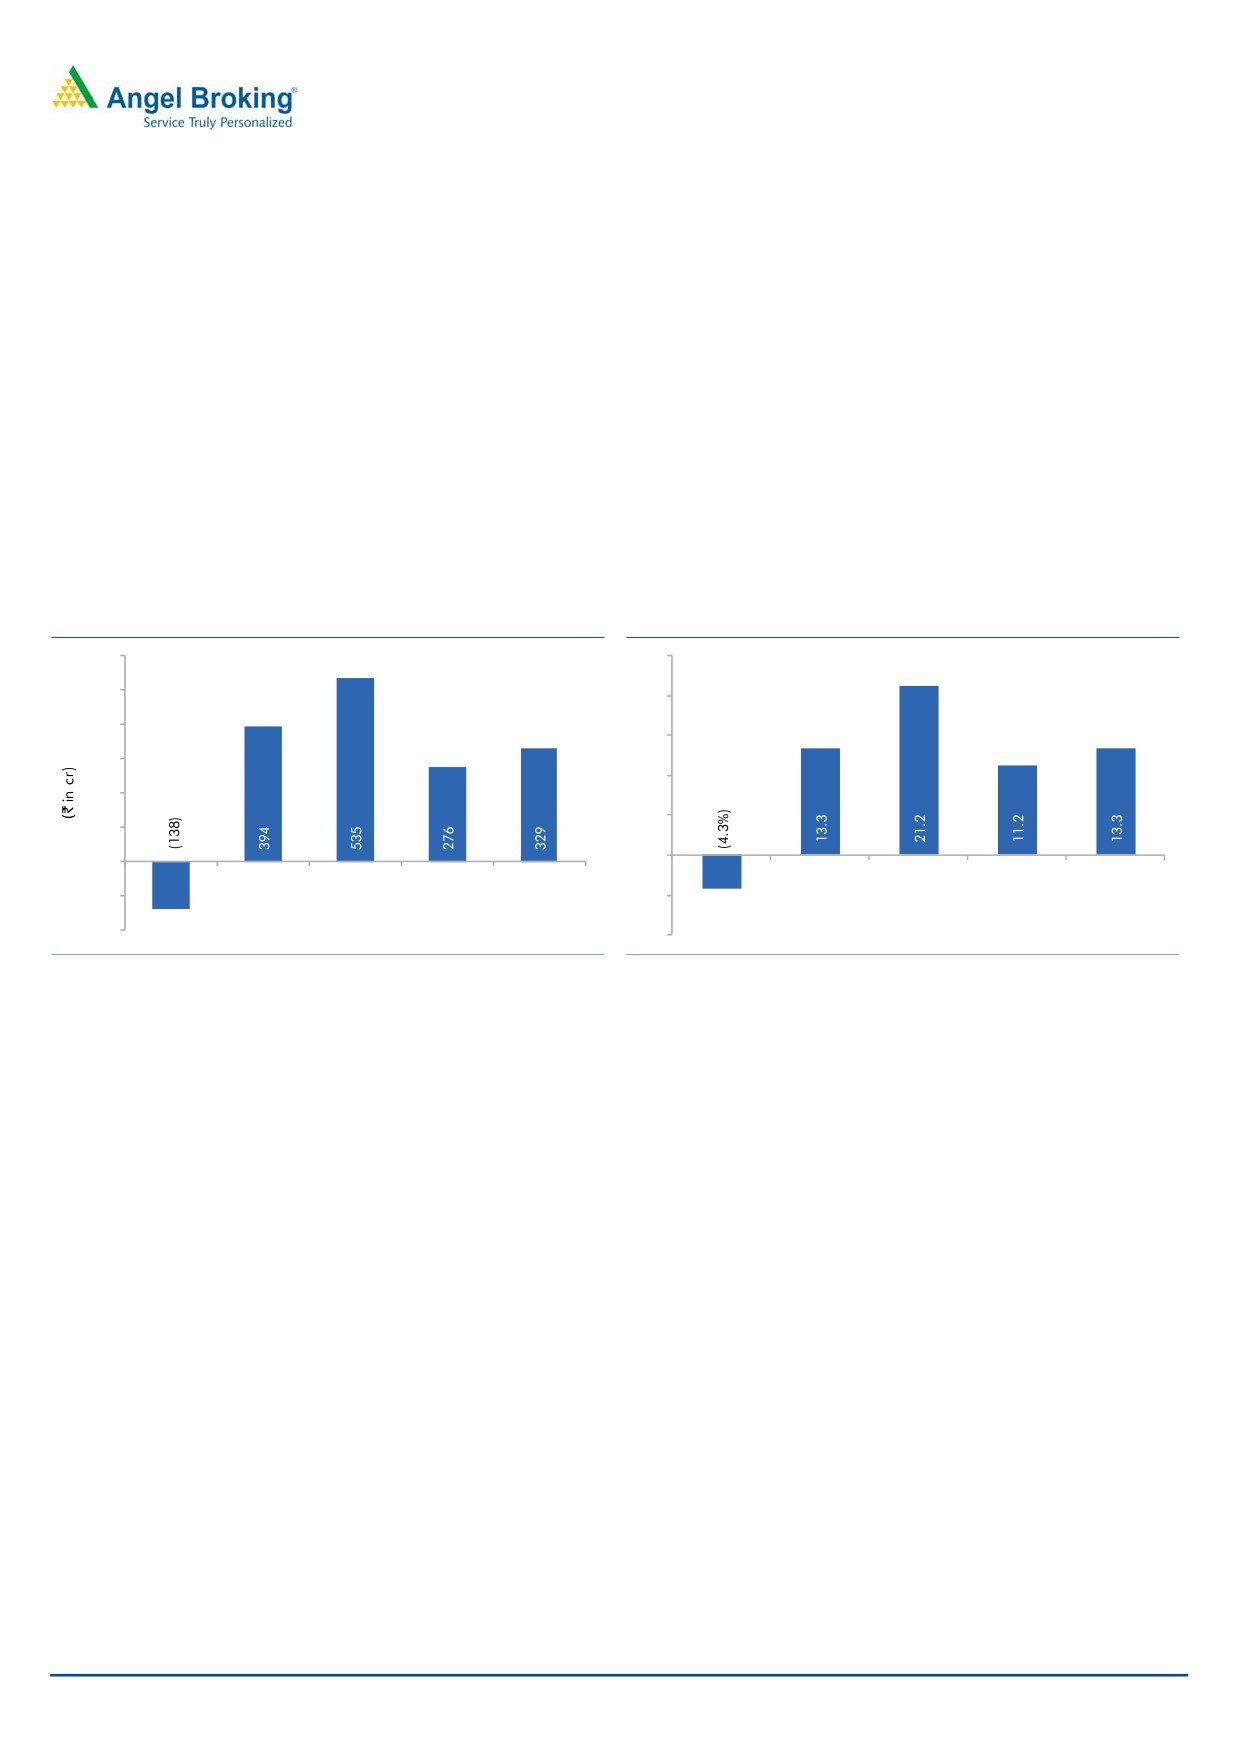
Exhibit 14: Cash flow from Operations
Exhibit 15: OCF Yield
600
25
500
20
400
15
300
10
200
5
100
0
0
FY13
FY14
FY15
FY16E
FY17E
FY13
FY14
FY15
FY16E
FY17E
(100)
(5)
(200)
(10)
Source: Company, Angel Research
Source: Company, Angel Research
BEML’s yield on Operating Cash Flows (OCF) for FY2015 stood at 21.2%, which is
very impressive. We expect BEML to report OCF yield of 11.2% and 13.3% for
FY2016E and FY2017E, which again is noteworthy.
June 29, 2015
13
Initiating coverage | BEML
About the Company
BEML is a Mini-Ratna Category-1 public sector undertaking (PSU) under the control
of Ministry of Defence (MoD), operating in three distinct business segments
namely, Mining & Construction Equipment, Defence, and Rail & Metro.
Having commenced operations in 1964, with the transfer of Railway Coach
Manufacturing facilities from Hindustan Aeronautics Ltd, BEML has over the years
diversified into manufacturing various types of mining and construction
equipments, Metro coaches and specialised defence vehicles/ products.
Exhibit 16: Business Segment Details
Business Segments
Production/ Assembling of
Mining & Construction Equip.
Dumpers, Bulldozers, Hydraulic Excavators, Rope Shovels,
(MCE)
Hydraulic Excavators, Wheel/ Backhoe Loaders, Tyre Handlers
Integrated Rail Coaches, Electrical Multiple Units (EMUs), Main
Rail & Metro
Line Electrical Multiple Units (MEMUs), Stainless Steel EMU
Tatra Trucks, Armored Recovery Vehicles, Ammunization
Defense Products
Loader Vehicles, Bheema
Source: Company, Angel Research
In the back-drop of down cycle seen across MCE and Rail & Metro segments, and
ban on Tatra Trucks affecting the Defense segment performance, BEML reported a
flat top-line CAGR during FY2013-15 to `2,809cr. Shift in mix, and recent cost
cutting initiatives led BEML report a turn-around from `80cr of net loss in FY2013
to `7cr of net profit in FY2015.
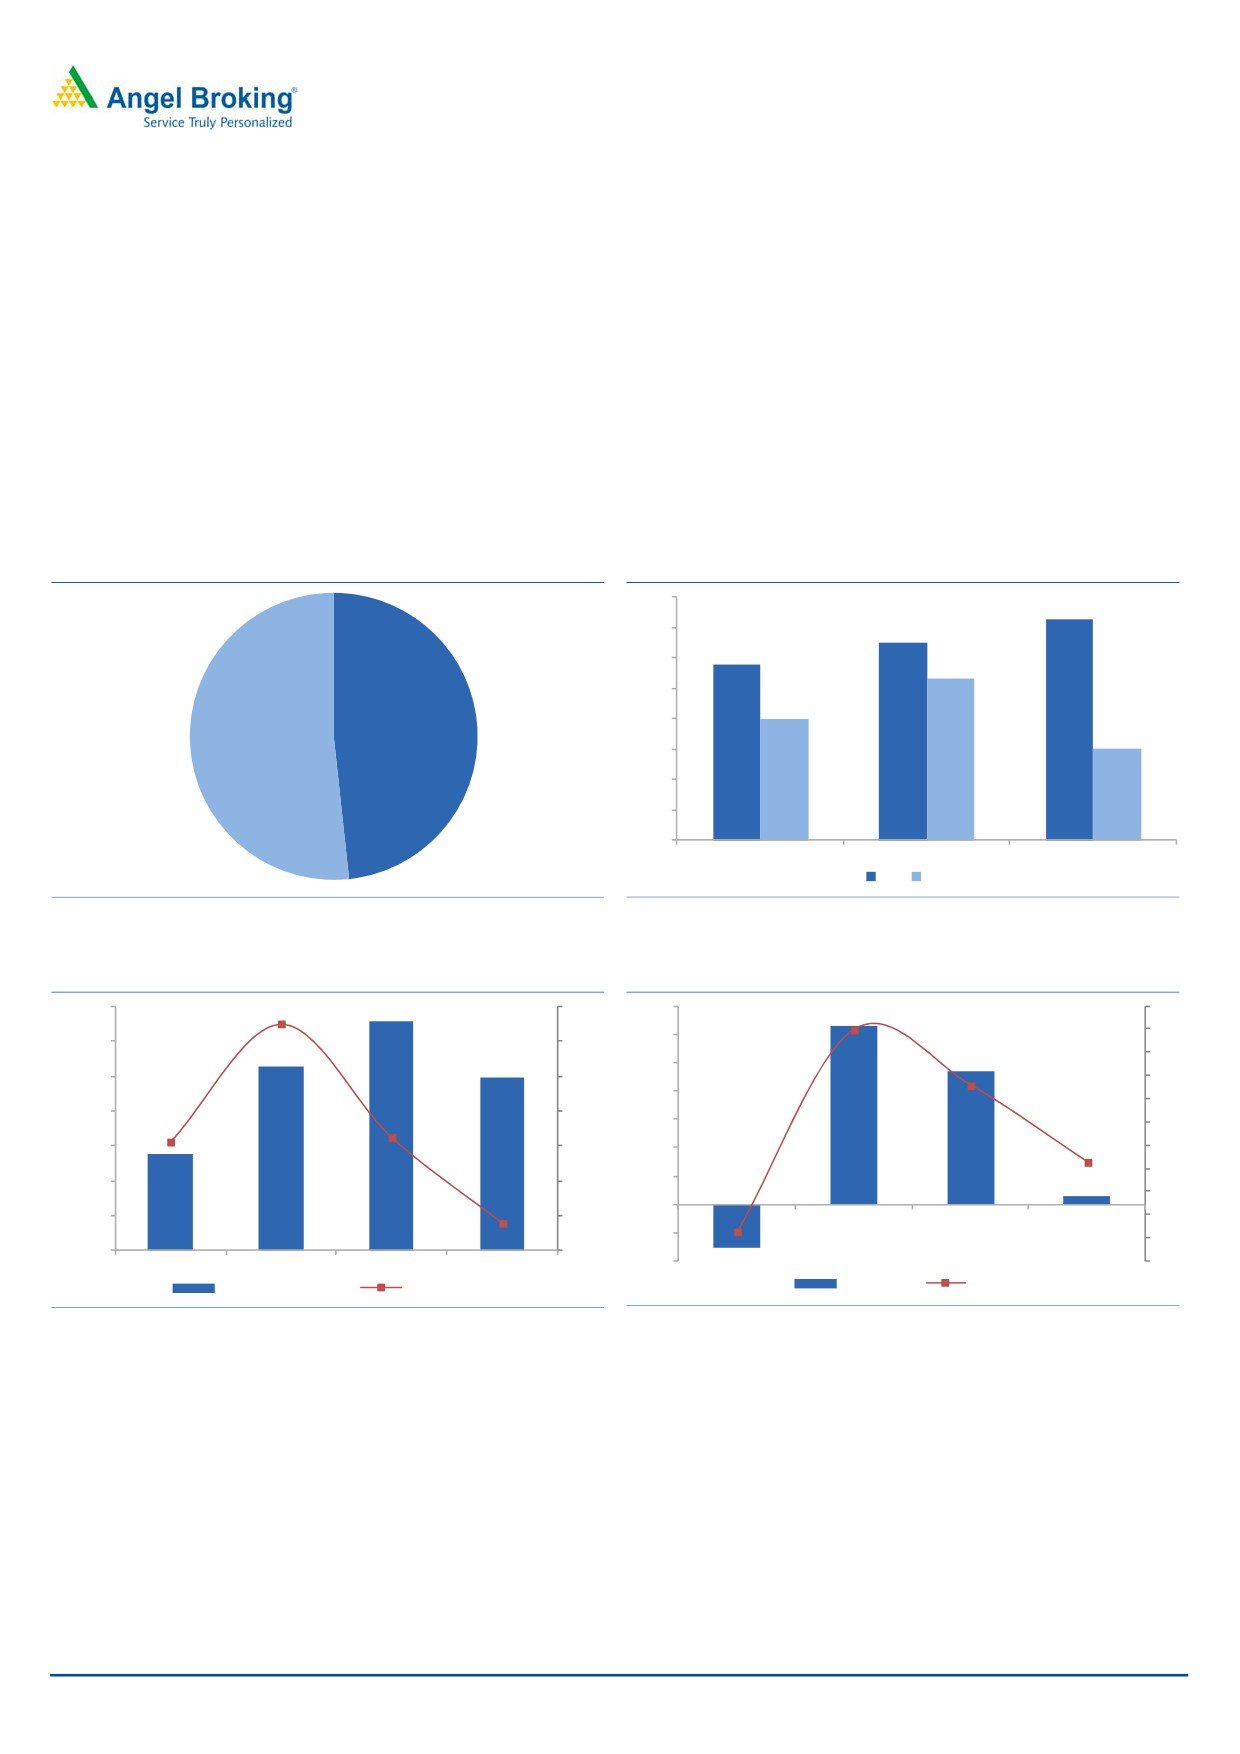
Exhibit 17: Revenue mix (segment-wise; FY15)
Exhibit 18: EBIT mix (segment-wise; FY15)
150
6%
120
100
50
36%
3
0
58%
Const. & Mining Equip.
Rail & Metro
Defense
(50)
(100)
(105)
Const. & Mining Equip.
Rail & Metro
Defense
(150)
Source: Company, Angel Research
Source: Company, Angel Research
Noticeably, BEML has witnessed a turn-around in the last quarters’ results, mainly
driven by recent cost cutting initiatives at the shop floor level, lower dependency on
imports, and cut in admin and marketing expenses.
June 29, 2015
14
Initiating coverage | BEML
(A) Metro & Railways segment under pain
Poor Wagon ordering affected the Railways sub-segment
For wagon supplies, BEML only bids for Indian Railways (IR)’ tenders. Prior to
FY2013, IR annually procured ~600-700 rail coaches from BEML. However,
during FY2014/15, BEML only made 130/145 coaches for IR. Decline in BEML’s
railways business was owing to (1) lower tendering by IR with ~25,000 wagons
tendered during FY2012-15 vs annual procurement activity of ~18,000-20,000
wagons during FY2009-12 in a highly crowded market (industry capacity stands at
~30,000 wagons annually), and with (2) BEML intentionally abstaining from
tendering for wagons, given that wagon works are highly labor intensive.
Exhibit 19: Rail & Metro Segment Revenue split
Exhibit 20: Rail & Metro Wagon/ Coach Sale volumes
160
145
140
130
115
120
106
100
80
80
Metro, 48%
60
Railways, 52%
60
40
20
(0)
FY13
FY14
FY15
Rail
Metro
Source: Company, Angel Research
Source: Company, Angel Research
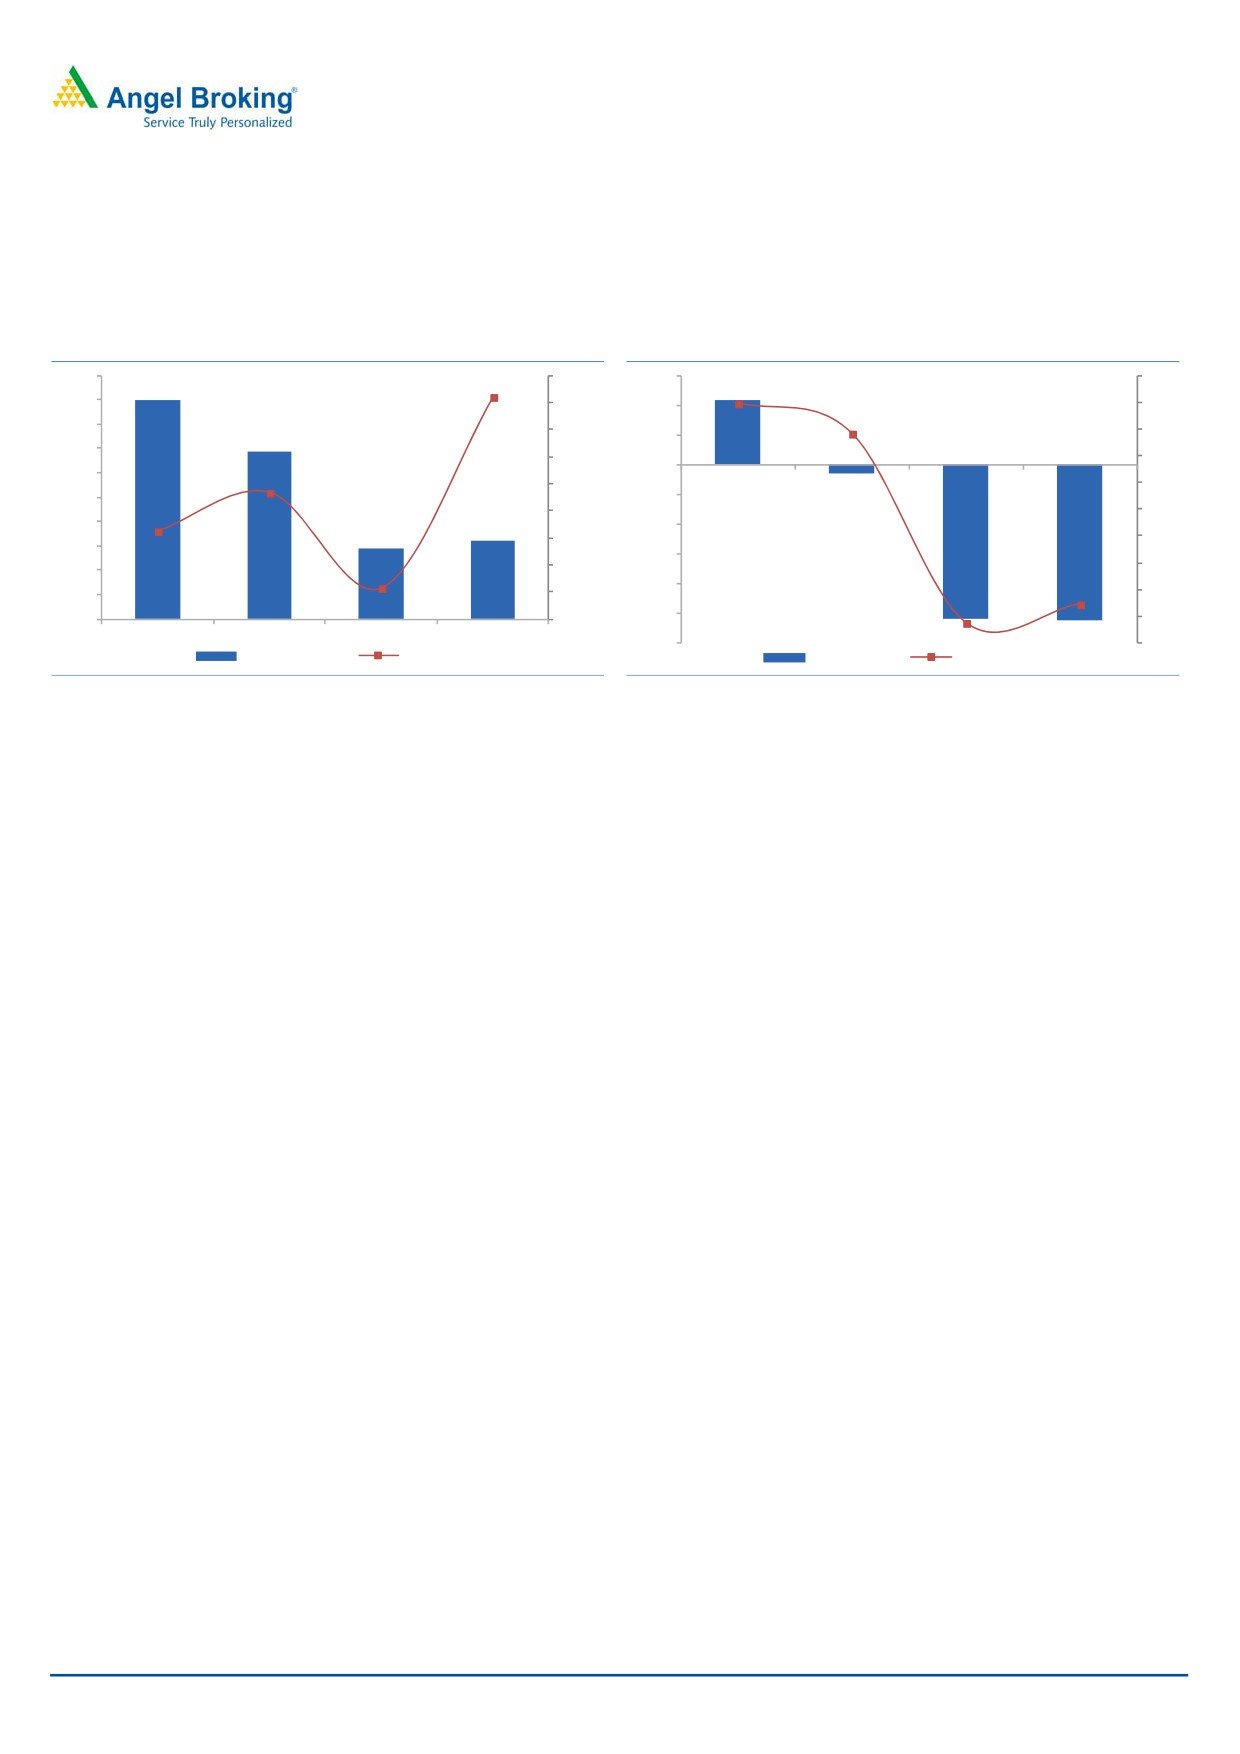
Exhibit 21: Rail & Metro Segment Revenue
Exhibit 22: Rail & Metro Segment EBIT
1,400
90.2
100
70
7
6
60
1,200
80
6.0
5
50
1,000
60
4
40
3
800
40
3.6
24.9
993
22.3
30
2
0.3
600
20
20
1
0
400
0
10
(15)
63
47
3
(1)
(24.4)
0
200
(20)
(2)
FY12
FY13
FY14
FY15
553
1,052
1,314
(10)
(3)
(0)
(40)
(20)
(2.7)
(4)
FY12
FY13
FY14
FY15
EBIT (` in cr)
EBIT Margin (%)
Revenues (` in cr)
yoy growth
Source: Company, Angel Research
Source: Company, Angel Research
Muted award activity led to poor execution at Metro business
Having entered the Metro space in 2009, BEML to-date has delivered ~800 Metro
coaches for Jaipur, Bengaluru and Delhi Metro projects. In addition to the 3 above
mentioned projects, given the limited award activity in Metro space during
FY2013-15, BEML witnessed revenue decline in this sub-segment.
In the back-drop of weak award activity and higher fixed cost base, Rail and Metro
segment reported negative 3% revenue and negative 78% EBIT CAGR during
FY2013-15.
June 29, 2015
15
Initiating coverage | BEML
(B) Defense segment adversely impacted since Tatra Scam..
Since the Tatra scam broke-out in 2012, Defense segment revenues have been on
a declining trend (from the highs of `717cr in FY2011 to `161cr in FY2015).
Exhibit 23: Defense Segment Revenue
Exhibit 24: Defense Segment EBIT
500
12.2
20.0
60
20
9.7
450
10.0
10
40
(1.6)
400
0.0
0
20
350
44
(10.0)
(10)
0
300
(23.2)
(20.0)
FY12
FY13
FY14
FY15
(20)
250
(20)
(37.4)
(30.0)
(6)
(30)
200
(40)
(104)
(105)
(40.0)
(40)
150
(60)
(58.4)
(50.0)
(50)
100
(80)
(65.4)
(60.0)
(60)
50
449
345
143
161
(72.3)
0
(70.0)
(100)
(70)
FY12
FY13
FY14
FY15
(120)
(80)
Revenues (` in cr)
yoy growth
EBIT (` in cr)
EBIT Margin (%)
Source: Company, Angel Research
Source: Company, Angel Research
Historically, BEML derives a major chunk of the Defense segment revenues from
(1) Tatra Vehicles, which are used for carrying various types of missiles and rocket
launchers), and (2) Armored Recovery Vehicles. BEML has played an important role
in integrated guided missile development projects by supplying ground support
vehicles. It has also manufactured aggregates for Akash missile, and designed and
manufactured Armored Repair and Recovery Vehicle (ARRV) for Combat Vehicles
Research & Development Establishment (CVRDE). Since 1986, BEML has supplied
over 7,000 Tatra trucks to the Indian Army.
The Defense segment reported negative 32% revenue CAGR during FY2013-15 to
`161cr. The segment level EBIT losses widened from `6cr in FY2013 to `105cr in
FY2015, reflecting inability to absorb higher fixed costs.
(C) Spare sales & Servicing support MCE segment growth
BEML derives
70-80% of MCE segment revenues from Coal India (and
subsidiaries), SAIL and NMDC, indicating high dependency on Mining Equipment
sub-segment and less on the Construction Equipments. Again within Mining
Equipments, a major chunk of revenues are from the sale of Dozers and Dumpers
which account for ~500-650 units of the total ~600-850 units of equipments sold
annually.
Issues disconcerting the Mining cycle have adversely impacted the MCE segment of
the company in the last few years. During the years FY2011-15, the segment sales
have been hovering at ~1,700cr, where every year, loss of equipment sales have
been compensated by either higher exports, equipment servicing, or spare part
sales. Also, it is to be noted that mining companies tend to club their requirements
of several years and invite periodic tenders for mining equipments, which further
take several months to process. Often the actual delivery of machines spans over a
number of years. Therefore sales in any particular year do not necessarily
represent that year’s demand, so market growth is best interpreted over a longer
time horizon only.
June 29, 2015
16
Initiating coverage | BEML
Exhibit 25: MCE segment Revenue
Exhibit 26: MCE segment EBIT
1,800
20.0
250
16
14.1
17.2
1,600
12.0
15.0
14
200
1,400
10.0
12
4.5
1,200
8.1
5.0
150
7.4
10
1,000
0.0
8
800
100
(5.0)
6
600
(17.1)
(10.0)
50
4
400
(0.9)
204
135
120
2
200
(15.0)
1,670
1,384
1,446
1,620
0
(12)
0
(20.0)
FY12
FY13
FY14
FY15
0
FY12
FY13
FY14
FY15
(50)
(2)
Revenues (` in cr)
yoy growth
EBIT (` in cr)
EBIT Margin (%)
Source: Company, Angel Research
Source: Company, Angel Research
Despite issues grappling the Mining sector during FY2013-15, focus on spare part
sales and equipment servicing helped the MCE segment to report 8% revenue
CAGR during FY2013-15 to `1,620cr. Shift in mix towards high margin exports
and spare part sales helped BEML report turn-around in its segment level EBIT
from loss of `12cr in FY2013 to profit of `120cr in FY2015.
Details of Manufacturing Plants
BEML has 9 manufacturing units located across Kolar Gold Field (KGF), Bangalore,
Palakkad and Mysore, which are into manufacturing products for the Mining
Equipment, Rail & Metro and Defense business segments.
Exhibit 27: Details of Manufacturing facilities
Production Facilities
Segments Production details
Bulldozers, Hydraulic Excavators, Wheel Loaders,
Kolar Gold Field
Dozers, Pipe Layers, Tyre Handlers, Hydraulic Cranes,
MCE
(KGF) Complex
Walking Dragline, Electric Rope Shovels, Engineering
Mine Ploughs
R&M
Rail Coach & Wagon components & aggregates
Defense Armored Recovery Vehicles, Transmissions, Axles
Rail coaches, AC EMUs, DEMU's, SS EMU's, MEMUs,
Bangalore Complex
R&M
OHE Cars, Stainless Steel Metro Cars
Milrail Coaches, Ejector & Air Cleaner assemblies, and
Defense
Military Wagons
Palakkad Complex
R&M
Rail Coach parts & aggregates
Tatra Heavy duty Trucks, Sarvatra Bridge Systems,
Defense
Heavy Recovery Vehicles
Rear Dump Trucks, Motor Graders, Water Sprinklers,
Mysore Complex
MCE
Engines for all their product offerings
Source: Company, Angel Research
June 29, 2015
17
Initiating coverage | BEML
Valuation
At the current market price of `1,218/share, BEML is trading at FY2016E and
FY2017E P/E multiple of 41.7x and 19.0x, respectively. Historically, since Feb-
2001, BEML’s stock has traded at a 1-year forward P/E multiple of 27x (excluding
when BEML made losses). Earnings growth of the company has been very volatile
since FY2013. We expect BEML to report 19% top-line and 529% bottom-line
CAGR during FY2015-17E, with such strong growth expected to sustain beyond
FY2017 as well. We expect BEML to continue to enjoy premium valuations on
account of strong long-term growth outlook and low competitive threat across all
the business segment in which it operates.
Considering the strong earnings growth, which is likely to stretch beyond FY2017,
we have assigned a 1-year forward P/E multiple of 22.0x (~19% discount to its
long-term historical average). Our target multiple of 22.0x captures, (1) strong
business recovery in FY2016/17E, which is expected to last for another 3-5 years,
(2) strong margin recovery from here-on, considering the market positioning within
relatively lesser competitive business areas (guarded by structural advantage BEML
enjoys given its PSU status). On assigning 22.0x P/E multiple to our FY2017E EPS
estimate of `64/share, we arrive at a price target of `1,414.
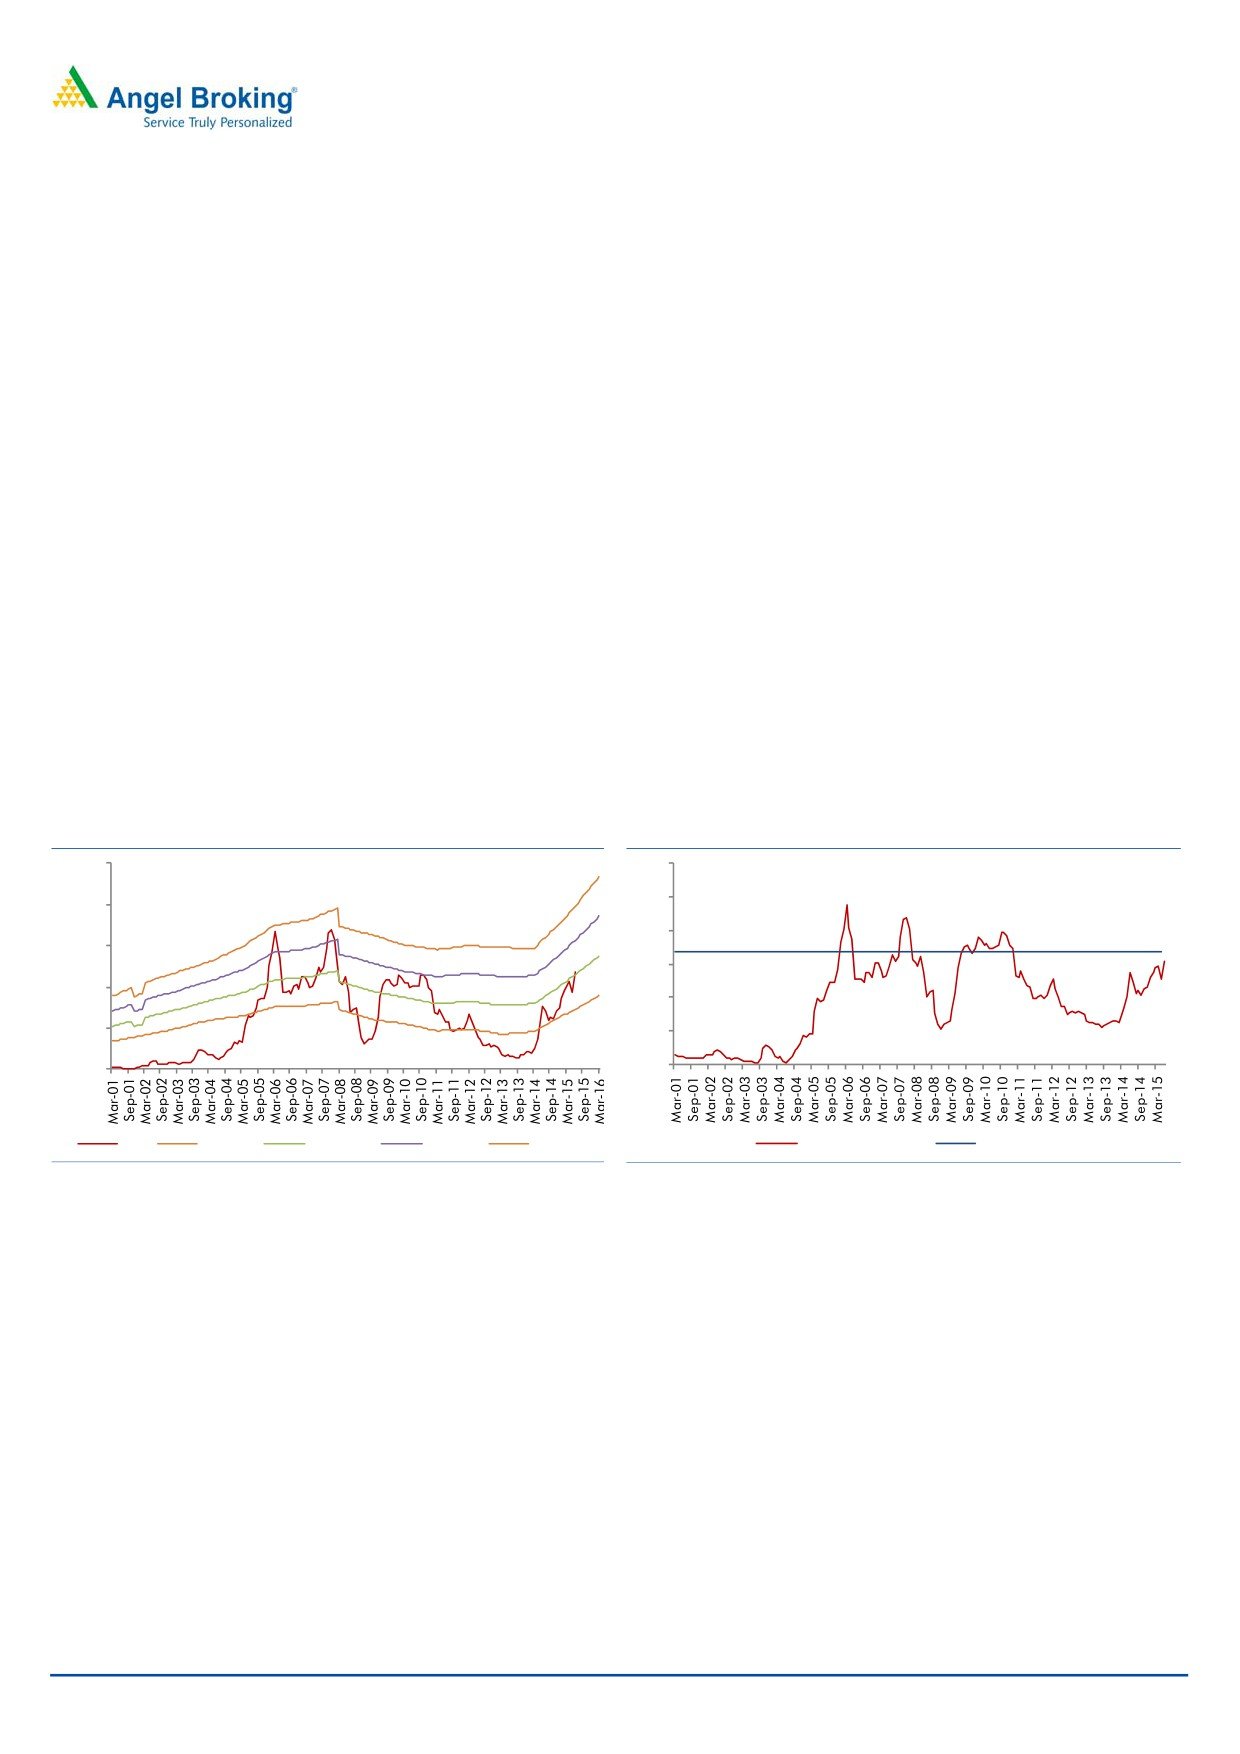
Exhibit 28: 1-year forward EV/ Sales band (x)
Exhibit 29: 1-year forward Avg. EV/Sales band (x)
2,500
3.0
2.5
2,000
2.0
1,500
1.5
1,000
1.0
500
0.5
0
0.0
Price
EV/Sales-1
EV/Sales-1.5
EV/Sales-2
EV/Sales2.5
Price
EV/Sales-1.5
Source: Angel Research
Source: Angel Research
We did an alternate check to assess whether the assigned target P/E multiple
justifies our price target. BEML’s stock at `1,218/share would be trading at FY2016E
and FY2017E, EV/sales multiple of 1.6x and 1.3x, respectively. At the implied price target of
`1,414/share, BEML’s share would be still trading at FY2017 EV/sales of 1.5x, which is at
~12% discount to its long-term average. Given the 16% upside from current levels, we
initiate coverage on BEML stock with Buy rating.
June 29, 2015
18
Initiating coverage | BEML
Risks to our Estimates
Delays in MCE and Metro capex cycle recovery from here-on could be a big
risk to our estimates.
Significant loss of market share vs. our assumption of slight loss of market
share, across MCE segment could be a risk to our assumptions.
Any sharp appreciation in the Rupee (INR) could make MCE segment imports
competitive, which again could be a risk to our market share assumptions and
be a threat to our earnings growth estimates.
June 29, 2015
19
Initiating coverage | BEML
Profit and Loss Statement
Y/E March (` cr)
FY13
FY14
FY15
FY16E
FY17E
Net Sales
2,809
2,912
2,809
3,277
4,006
% Chg
3.0
3.7
(3.5)
16.7
22.2
Total Expenditure
2,854
2,798
2,739
3,082
3,649
Cost of Raw Materials Con.
1,645
1,711
1,583
1,846
2,311
Purchase of Stock-in-trade
9
3
0
1
0
Employee benefits Expense
739
717
769
787
805
Other Expenses
460
367
387
448
532
EBITDA
(45)
113
70
196
357
% Chg
NMF
NMF
(38.2)
179.8
82.7
EBIDTA %
(1.6)
3.9
2.5
6.0
8.9
Depreciation
50
54
52
55
59
EBIT
(95)
60
18
141
298
% Chg
NMF
NMF
(70.2)
693.0
111.8
Interest & Financial Charges
141
110
71
51
34
Other Income
104
63
60
66
79
PBT
(132)
13
7
156
343
Exceptional Items
10
16
0
0
0
Prior Period Adjustments
0
(19)
0
0
0
Tax
(42)
4
0
34
75
% of PBT
32.1
35.2
2.2
22.0
22.0
PAT
(80)
5
7
122
268
% Chg
NMF
NMF
44.8
1,699.6
120.0
PAT %
(2.8)
0.2
0.2
3.7
6.7
Basic EPS
(19.2)
1.1
1.6
29.2
64.3
Diluted EPS
(19.2)
1.1
1.6
29.2
64.3
% Chg
NMF
NMF
44.8
1699.6
120.0
Note: NMF- Not Meaningful
June 29, 2015
20
Initiating coverage | BEML
Balance Sheet
Y/E March (` cr)
FY13
FY14
FY15
FY16E
FY17E
Sources of Funds
Equity Capital
42
42
42
42
42
Reserves Total
2,038
2,038
2,035
2,135
2,356
Networth
2,080
2,080
2,077
2,177
2,398
Total Debt
1,214
905
592
528
317
Other Long-term Liabilities
406
379
317
337
355
Long-term Provisions
149
136
164
184
199
Total Liabilities
3,850
3,500
3,150
3,226
3,269
Application of Funds
Gross Block
1,184
1,201
1,253
1,316
1,385
Accumulated Depreciation
653
702
754
809
868
Net Block
531
499
499
507
518
Capital WIP & Intan. under Dev.
142
173
162
145
144
Investments
4
4
3
3
3
Deferred Tax Assets (net)
105
100
101
101
101
Inventories
2,456
2,152
1,921
1,920
1,959
Sundry Debtors
862
977
992
987
1,088
Cash and Bank Balance
77
16
144
256
246
Loans & Advances
603
532
400
406
448
Current Liabilities
1,366
1,261
1,441
1,511
1,678
Net Current Assets
2,632
2,417
2,017
2,057
2,063
Other Assets
436
308
368
413
440
Total Assets
3,850
3,500
3,150
3,226
3,269
June 29, 2015
21
Initiating coverage | BEML
Cash Flow Statement
Y/E March (` cr)
FY13
FY14
FY15P
FY16E
FY17E
Profit before tax
(122)
9
7
156
343
Depreciation
53
55
52
55
59
Other Adjustments
96
(35)
(28)
(18)
(18)
Change in Working Capital
(275)
282
434
66
(10)
Interest & Financial Charges
141
110
71
51
34
Direct taxes paid
(31)
(26)
(0)
(34)
(75)
Cash Flow from Operations
(138)
394
535
275
333
(Inc)/ Dec in Fixed Assets
(170)
(53)
(42)
(45)
(69)
(Inc)/ Dec in Invest. & Int. received
38
25
22
18
18
Cash Flow from Investing
(132)
(28)
(20)
(27)
(51)
Inc./ (Dec.) in Borrowings
303
(306)
(312)
(64)
(211)
Issue/ (Buy Back) of Equity
0
0
0
0
0
Dividend Paid (Incl. Tax)
(24)
(12)
(5)
(21)
(47)
Finance Cost
(124)
(109)
(71)
(51)
(34)
Cash Flow from Financing
155
(427)
(388)
(137)
(292)
Inc./(Dec.) in Cash
(116)
(61)
128
112
(10)
Opening Cash balances
192
77
16
144
256
Closing Cash balances
77
16
144
256
246
June 29, 2015
22
Initiating coverage | BEML
Key Ratios
Y/E March
FY13
FY14
FY15P
FY16E
FY17E
Valuation Ratio (x)
P/E (on FDEPS)
NMF
NMF
NMF
41.7
19.0
P/CEPS
NMF
87.1
86.1
28.8
15.5
Dividend yield (%)
0.2
0.1
0.1
0.4
0.8
EV/Sales
2.2
2.1
2.0
1.6
1.3
EV/EBITDA
NMF
52.7
79.0
27.3
14.4
EV / Total Assets
1.6
1.7
1.8
1.7
1.6
Per Share Data (`)
EPS (Basic)
(19.2)
1.1
1.6
29.2
64.3
EPS (fully diluted)
(19.2)
1.1
1.6
29.2
64.3
Cash EPS
(7.1)
14.0
14.1
42.3
78.4
DPS
2.5
1.0
1.0
4.4
9.6
Book Value
499.5
499.4
498.7
522.8
575.8
Returns (%)
RoCE (Pre-tax)
(2.8)
1.8
0.6
4.9
10.2
Angel RoIC (Pre-tax)
(2.9)
2.0
0.7
5.2
11.0
RoE
(4.3)
0.4
0.3
5.7
11.7
Turnover ratios (x)
Asset Turnover (Gross Block) (x)
2.4
2.4
2.3
2.6
3.0
Inventory / Sales (days)
321
292
268
216
180
Receivables (days)
123
117
129
111
100
Payables (days)
175
166
178
170
154
WC days
269
243
219
157
126
Leverage Ratios (x)
D/E ratio (x)
0.5
0.4
0.2
0.1
0.0
Interest Coverage Ratio (x)
NMF
0.5
0.3
2.8
8.8
Note: NMF- Not Meaningful
June 29, 2015
23
Initiating coverage | BEML
Research Team Tel: 022 - 39357800
DISCLAIMER
Angel Broking Private Limited (hereinafter referred to as “Angel”) is a registered Member of National Stock Exchange of India Limited,
Bombay Stock Exchange Limited and MCX Stock Exchange Limited. It is also registered as a Depository Participant with CDSL and
Portfolio Manager with SEBI. It also has registration with AMFI as a Mutual Fund Distributor. Angel Broking Private Limited is a
registered entity with SEBI for Research Analyst in terms of SEBI (Research Analyst) Regulations, 2014 vide registration number
INH000000164. Angel or its associates has not been debarred/ suspended by SEBI or any other regulatory authority for accessing
/dealing in securities Market. Angel or its associates including its relatives/analyst do not hold any financial interest/beneficial
ownership of more than 1% in the company covered by Analyst. Angel or its associates/analyst has not received any compensation /
managed or co-managed public offering of securities of the company covered by Analyst during the past twelve months. Angel/analyst
has not served as an officer, director or employee of company covered by Analyst and has not been engaged in market making activity
of the company covered by Analyst.
This document is solely for the personal information of the recipient, and must not be singularly used as the basis of any investment
decision. Nothing in this document should be construed as investment or financial advice. Each recipient of this document should
make such investigations as they deem necessary to arrive at an independent evaluation of an investment in the securities of the
companies referred to in this document (including the merits and risks involved), and should consult their own advisors to determine
the merits and risks of such an investment.
Reports based on technical and derivative analysis center on studying charts of a stock's price movement, outstanding positions and
trading volume, as opposed to focusing on a company's fundamentals and, as such, may not match with a report on a company's
fundamentals.
The information in this document has been printed on the basis of publicly available information, internal data and other reliable
sources believed to be true, but we do not represent that it is accurate or complete and it should not be relied on as such, as this
document is for general guidance only. Angel Broking Pvt. Limited or any of its affiliates/ group companies shall not be in any way
responsible for any loss or damage that may arise to any person from any inadvertent error in the information contained in this report.
Angel Broking Pvt. Limited has not independently verified all the information contained within this document. Accordingly, we cannot
testify, nor make any representation or warranty, express or implied, to the accuracy, contents or data contained within this document.
While Angel Broking Pvt. Limited endeavors to update on a reasonable basis the information discussed in this material, there may be
regulatory, compliance, or other reasons that prevent us from doing so.
This document is being supplied to you solely for your information, and its contents, information or data may not be reproduced,
redistributed or passed on, directly or indirectly.
Neither Angel Broking Pvt. Limited, nor its directors, employees or affiliates shall be liable for any loss or damage that may arise from
or in connection with the use of this information.
Note: Please refer to the important ‘Stock Holding Disclosure' report on the Angel website (Research Section). Also, please refer to the
latest update on respective stocks for the disclosure status in respect of those stocks. Angel Broking Pvt. Limited and its affiliates may
have investment positions in the stocks recommended in this report.
Disclosure of Interest Statement
BEML
1. Analyst ownership of the stock
No
2. Angel and its Group companies ownership of the stock
No
3. Angel and its Group companies' Directors ownership of the stock
No
4. Broking relationship with company covered
No
Note: We have not considered any Exposure below ` 1 lakh for Angel, its Group companies and Directors
Ratings (Based on expected returns
Buy (> 15%)
Accumulate (5% to 15%)
Neutral (-5 to 5%)
over 12 months investment period):
Reduce (-5% to -15%)
Sell (< -15)
June 29, 2015
24