1QFY2019 Result Update | Pharmaceutical
August 10, 2018
Aurobindo Pharma
BUY
CMP
`601
Performance Highlights
Target Price
`780
Y/E march (` cr)
1QFY19
4QFY18
% chg (QoQ)
1QFY18
% chg (yoy)
Investment Period
12 months
Net sales
4,182
3,989
4.8
3,621
15.5
Other income
112
105
7.2
81
38.6
Stock Info
Operating profit
710
746
(4.7)
784
(9.4)
Sector
Pharmaceutical
Interest
98
41
140.4
25
298.3
Market Cap (` cr)
35,207
Adj. Net profit
456
529
(13.8)
518
(12.1)
Net debt (` cr)
3,277
Source: Company, Angel Research
Beta
1.1
52 Week High / Low
809/527
For 1QFY2019, Aurobindo Pharma (APL) posted decent set of numbers on
Avg. Daily Volume
54,388
topline. On sales front, the company posted sales of `4,182cr v/s. `3,621cr in
Face Value (`)
1
1QFY2018, a yoy growth of 15.5%. On the operating front, the EBITDA margin
BSE Sensex
38,024
at 17.0% v/s. 21.6% in 1QFY2018.Consequently, the Adj. PAT came in at
Nifty
11,471
`456cr v/s. `518cr in 1QFY2018, a yoy de-growth of 12.1%. We maintain our
Reuters Code
ARBN.BO
Buy rating on the stock.
Bloomberg Code
ARBP.IN
OPM under pressure: On sales front, the company a yoy growth of 15.5%.The
formulation sales (`3,501cr) posted a yoy growth of 14.7%, while API (`748cr)
posted a yoy growth of 19.7%. Europe (`1,199cr) posted a yoy growth of 30.7%,
Shareholding Pattern (%)
while company’s key market USA (`1,890cr) posted a growth of 11.5% yoy. The
Promoters
51.9
business accounted for 28.2% of revenues. In Euro terms, sales grew by 16.0%
MF / Banks / Indian Fls
17.8
yoy. On the operating front, the EBITDA margin at 17.0% v/s. 21.6% in
FII / NRIs / OCBs
15.8
1QFY2018, mainly on back of drop in gross margins, which came in at 54.4%
Indian Public / Others
14.5
V/s 58.6% in 1QFY2018. Profitability was impacted largely due to certain one-off
product related provisions; which amounted to `100cr. Consequently, the PAT
Abs. (%)
3m 1yr
3yr
came in at `456cr, a yoy de-growth of 12.1%.
Sensex
#
19.6
35.3
Outlook and valuation: We expect Aurobindo to report net revenue CAGR of
Aurobindo
#
(12.2)
(22.8)
~16% & net profit to grow at ~9% CAGR during FY2018-20E, due to increased
R&D expenditure. However, valuations of the company are cheap V/s its peers
and own fair multiples of 17-18x. We recommend a Buy rating with a target
price of `780.
Key financials (Consolidated)
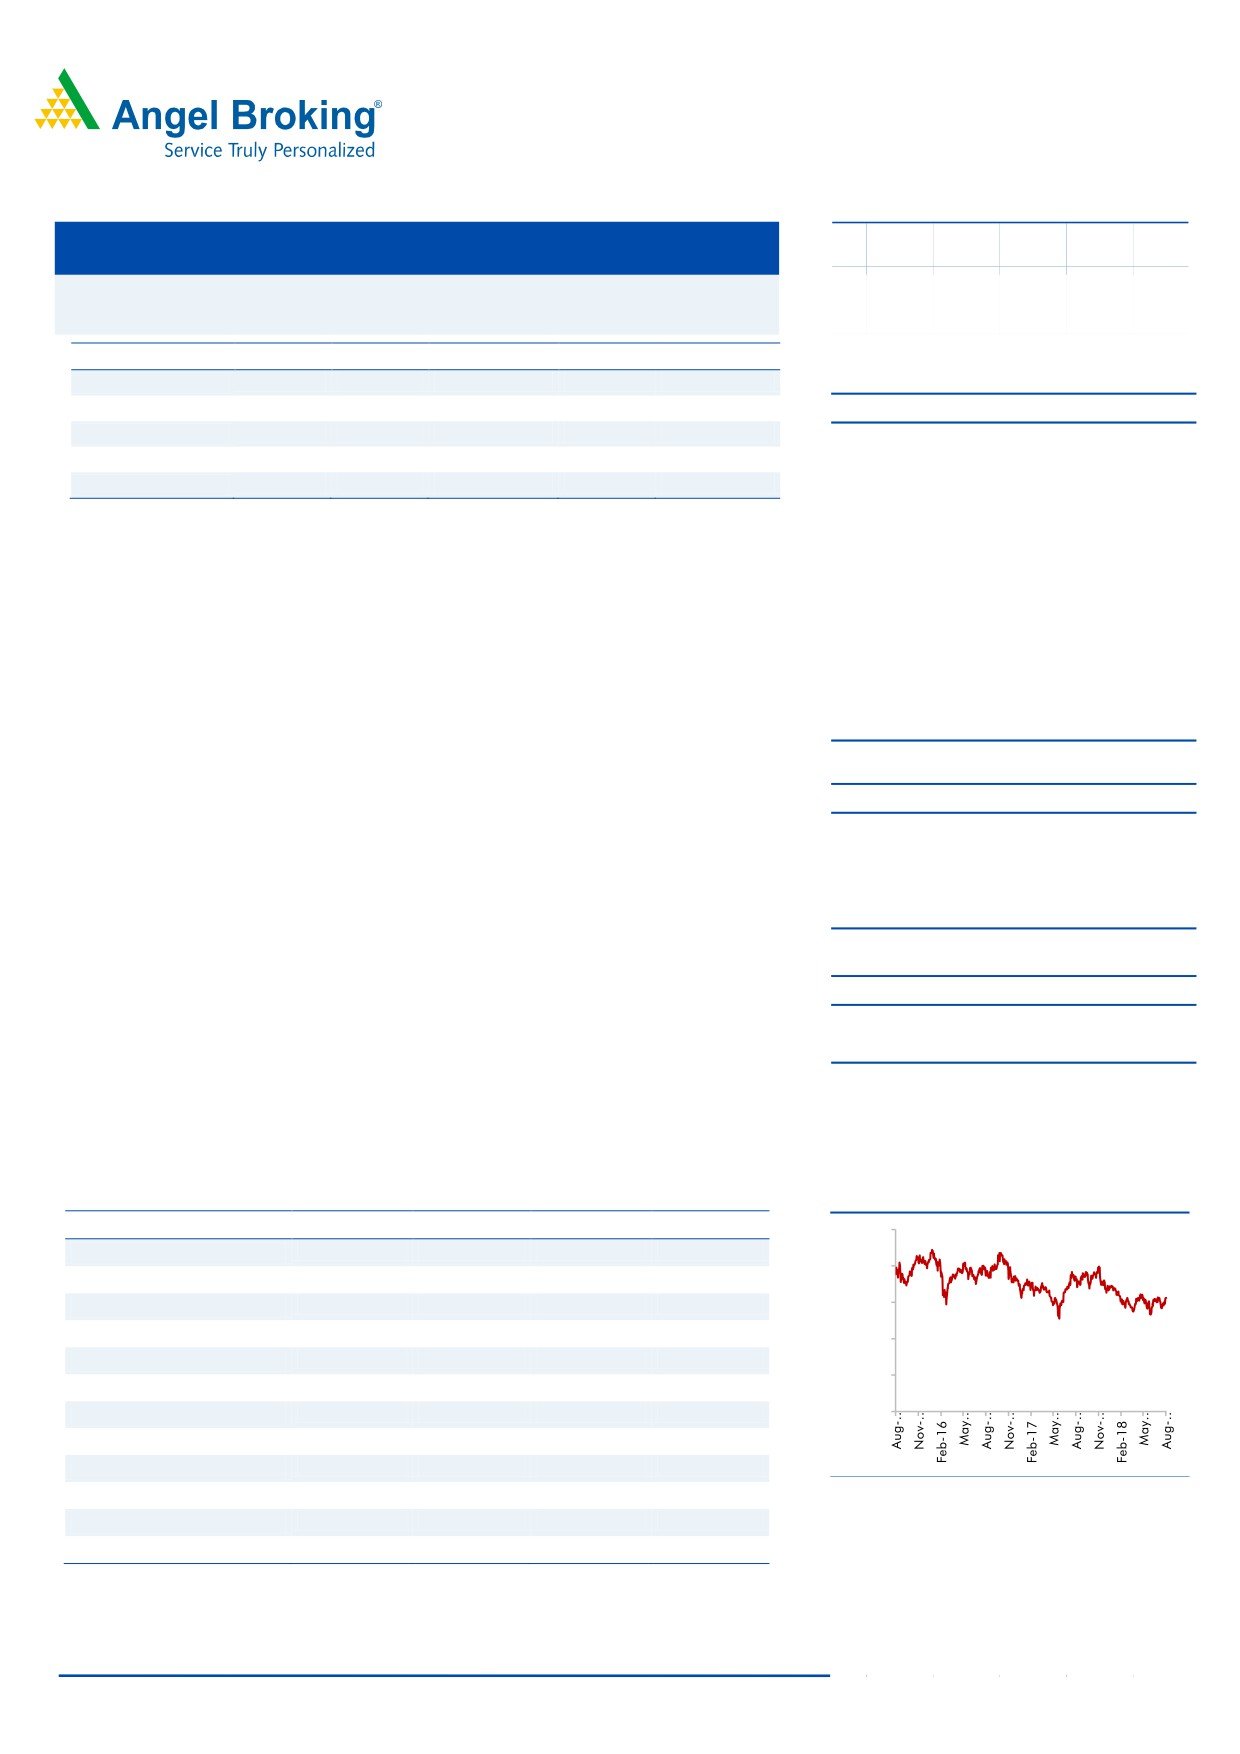
3-year daily price chart
Y/E March (` cr)
FY2017
FY2018
FY2019E
FY2020E
1,000
Net sales
14,845
16,233
18,701
21,829
800
% chg
8.3
9.4
15.2
16.7
2,302
2,423
2,753
2,877
600
Adj. Net profit
13.7
5.3
13.6
4.5
% chg
400
EPS (`)
39.4
41.5
47.1
49.3
200
EBITDA margin (%)
21.5
21.6
21.7
19.6
15.2
14.5
12.7
12.2
-
P/E (x)
RoE (%)
27.6
23.0
21.4
18.7
RoCE (%)
23.1
20.6
20.1
19.6
P/BV (x)
3.9
3.2
2.6
2.2
Source: Company, Angel Research
EV/Sales (x)
2.7
2.5
2.1
1.8
EV/EBITDA (x)
12.4
11.4
9.7
9.0
Source: Company, Angel Research; Note: CMP as of August 09, 2018
Sarabjit Kour Nangra
+91 22 3935 7800 Ext: 6806
Please refer to important disclosures at the end of this report
1
Aurobindo Pharma | 1QFY2019 Result Update
Exhibit 1: 1QFY2019 performance (Consolidated)
% chg
Y/E March (` cr)
1QFY2019
4QFY2018
1QFY2018
% chg (yoy)
FY2018
FY2017
% chg (yoy)
(QoQ)
Net sales
4,182
3,989
4.8
3,621
15.5
16,233
14,845
9.4
Other income
112
105
7.2
81
38.6
372
366
1.7
Total income
4,294
3,712
15.7
3,702
16.0
16,605
15,211
9.2
Gross profit
2,274
2,319
(1.9)
2,123
7.1
9,480
8,411
12.7
Gross margins
54.4
58.1
58.6
58.4
56.7
Operating profit
710
746
(4.7)
784
(9.4)
3,522
3,189
10.4
OPM (%)
17.0
18.7
(9.1)
21.6
21.7
21.5
Interest
98
41
140.4
25
298.3
94
67
41.6
Dep & amortization
155
157
(1.3)
131
17.8
558
428
30.5
PBT
571
651
(12.4)
709
(19.5)
3,241
3,061
5.9
Provision for taxation
116
122
(5.6)
191
(39.5)
818
760
7.7
Net profit
455
529
(13.9)
518
(12.2)
2,423
2,301
5.3
Less : Exceptional items (gains)/loss
-
-
-
-
-
-
MI & share in associates
0
(0)
(0)
(0)
(0)
-
PAT after Exceptional items
456
529
(13.8)
518
(12.1)
2,423
2,301
5.3
Adjusted PAT
456
529
(13.8)
518
(12.1)
2,423
2,301
5.3
EPS (`)
7.8
9.0
8.8
41.3
39.3
Source: Company, Angel Research
Exhibit 2: Sales break-up (Consolidated)
(` cr)
1QFY2019
4QFY2018
% chg (QoQ)
1QFY2018
% chg (yoy)
FY2018
FY2017
% chg
Formulations
3,501
3,249
7.8
3051
14.8
13,533
12,045
12.4
US
1890
1739
8.7
1694
11.5
7442
6827
9.0
Europe & ROW
1456
1361
6.9
1112
31.0
5252
4033
30.2
ARV
156
149
4.7
245
(36.4)
840
1185
(29.2)
API
748
800
(6.5)
625
19.7
2,962
3,042
(2.6)
SSP
492
533
(7.7)
409
20.3
1992
204
(2.5)
Cephs
256
267
(4.0)
216
18.5
970
999
(2.9)
Total Sales
4,249
4,048
5.0
3,678
15.5
16,495
15,088
9.3
Source: Company, Angel Research
Result Takeaways
US has witnessed 11.5% yoy during 1QFY2019; on
like-to-like basis, the
growth in the business sales grew by 7%; and accounted for 44.5% of sales.
US Injectable (sales of US$210mn); will post a growth of 30% yoy, backed by
launch of 10-12 pdts. For 1QFY2019, the sales of Injectable business is
around US$36mn.
R&D as a percent of sales to be 4.0% of sales in 1QFY2019; expected to be
5% of sales in FY2019E.
Profitability was impacted largely due to certain one-off product related
provisions; which amounted to `100cr on the gross margins front. Thus, gross
margins will move back to 58% in 2QFY2019.
August 10,2018
2
Aurobindo Pharma | 1QFY2019 Result Update
The company filed 7 ANDAs, including 3 ANDAs for injectable with USFDA
during the quarter. Received final approval for 13 ANDAs and tentative
approval for 3 ANDAs during the quarter.
As on 30 th Jun 2018, on a cumulative basis, the company filed 487 ANDAs
with USFDA and received approval for 375 ANDAs including 33 tentative*
approvals.
Sales from EU formulations in 1QFY18-19 witnessed a strong growth of
30.7% at `1,199cr, driven by strong growth in some of the key markets. The
business accounted for 28.2% of revenues. In Euro terms, sales grew by 16.0%
yoy.
Capex was US$70mn for 1QFY2019; capex guided at US$170mn in FY2019.
Debt as on June’2018 was ~`5,298cr & cash is around `1,387cr.
Recommendation rationale
Well placed for challenging times in USA: Aurobindo has a robust pipeline
(has filed 487 ANDA’s; second highest amongst Indian companies) & is
investing to enhance its foray into complex generic (mainly injectables,
ophthalmic etc.) & biosimilar, which will drive its next leg of growth. In the
current price competitive market, company is well placed; given it’s vertically
integrated with 70% of raw material requirements being meet through
internally. In addition, almost no single product of the company contributes
than 3% of sales; unlike others peers, who have high product concentration.
This is also evident from the performance of the company in USA in
FY2018. Company expects pricing pressure to stabilize at +/- 5% yoy over
the medium term. The company expects to launch ~30-40 products in the
US, over the next six months, which will aid growth in the US business.
Overall USA will grow at 15.7% CAGR over FY2018-20E.
Europe to grow steady, while ARV could provide extra boost: Europe, which
is another key region for the company, is expected to post CAGR of 20.0%
during FY2018-20E, while ROW is expected to post a CAGR of 18.0%
during same period. However, growth during the period would be more
predominate in the ARV segment, where company has confirmed tenders of
US$80-100mn to be executed over next two years.
Outlook and valuation
We expect Aurobindo to report net revenue CAGR of ~16% & net profit to grow at
~9% CAGR during FY2018-20E, due to increased R&D expenditure. However,
valuations of the company are cheap V/s its peers and own fair multiples of 17-
18x.We maintain our Buy rating on the stock.
August 10,2018
3
Aurobindo Pharma | 1QFY2019 Result Update
Exhibit 3: Key assumptions
FY2019E
FY2020E
Sales Growth (%)
15.2
16.7
Operating Margins (%)
21.7
19..6
Capex (`cr)
1,388
1,200
Source: Company, Angel Research
Company background
Aurobindo Pharma manufactures generic pharmaceuticals and APIs. The
company’s manufacturing facilities are approved by several leading regulatory
agencies like the USFDA, UK MHRA, WHO, Health Canada, MCC South Africa
and ANVISA Brazil among others. The company’s robust product portfolio is
spread over six major therapeutic/product areas encompassing antibiotics,
antiretrovirals, CVS, CNS, gastroenterological, and anti-allergics.
August 10,2018
4
Aurobindo Pharma | 1QFY2019 Result Update
Profit & loss statement (Consolidated)
Y/E March (` cr)
FY2015
FY2016
FY2017
FY2018
FY2019E
FY2020E
Gross sales
12,221
13,937
15,084
16,493
18,986
22,162
Less: Excise duty
178
227
239
260
285
332
Net Sales
12,043
13,710
14,845
16,233
18,701
21,829
Other operating income
77
245
245
267
267
267
Total operating income
12,121
13,955
15,090
16,500
18,968
22,096
% chg
49.6
15.1
8.1
9.3
15.0
16.5
Total Expenditure
9,557
10,931
11,656
12,728
14,650
17,546
Net Raw Materials
5,506
6,162
6,434
6,753
7,761
9,277
Other Mfg costs
1,204
1,371
1,484
1,623
1,870
2,183
Personnel
1,302
1,543
1,768
2,131
2,450
2,818
Other
1,115
1,386
1,426
1,555
1,710
1,881
R&D
430
470
543
667
858
1,386
EBITDA
2,486
2,779
3,189
3,505
4,051
4,284
% chg
20.1
11.8
14.8
9.9
15.6
5.7
(% of Net Sales)
20.6
20.3
21.5
21.6
21.7
19.6
Depreciation& Amortization
333
392
428
558
678
769
EBIT
2,154
2,386
2,762
2,947
3,373
3,515
% chg
22.5
10.8
15.7
6.7
14.5
4.2
(% of Net Sales)
17.9
17.4
18.6
18.2
18.0
16.1
Interest & other Charges
84
93
67
78
75
50
Other Income
81
205
121
105
105
105
(% of PBT)
3.6
7.5
4.0
3.2
2.9
2.7
Share in profit of Associates
-
-
-
-
-
-
Recurring PBT
2,227
2,744
3,061
3,241
3,670
3,837
% chg
28.4
23.2
11.5
5.9
13.2
4.5
Extraordinary Expense/(Inc.)
59.6
-
-
-
-
-
PBT (reported)
2,168
2,744
3,061
3,241
3,670
3,837
Tax
596.6
720.7
759.6
818.3
917.5
959.2
(% of PBT)
27.5
26.3
24.8
25.2
25.0
25.0
PAT (reported)
1,571
2,024
2,301
2,423
2,753
2,878
PAT after MI (reported)
1,576
2,025
2,302
2,423
2,753
2,877
Basic EPS (Rs)
27.7
34.6
39.3
41.4
47.1
49.2
% chg
21.5
25.1
13.7
5.3
13.6
4.5
August 10,2018
5
Aurobindo Pharma | 1QFY2019 Result Update
Balance sheet (Consolidated)
Y/E March (` cr)
FY2015
FY2016
FY2017
FY2018
FY2019E FY2020E
SOURCES OF FUNDS
Equity Share Capital
29
59
59
59
59
59
Share Application Money
-
-
-
-
-
-
Reserves & Surplus
5,127
7,229
9,313
11,622
14,053
16,594
Shareholders Funds
5,156
7,287
9,372
11,680
14,112
16,652
26
3
2
2
1
1
Minority Interest
Long-term provisions
24
23
22
56
56
56
Total Loans
3,864
4,415
3,084
4,483
3,000
2,000
Deferred Tax Liability
211
(182)
(118)
76
76
76
9,280
11,546
12,362
16,297
17,189
18,730
Total Liabilities
APPLICATION OF FUNDS
Gross Block
6,095
6,093
7,625
8,998
10,386
11,586
Less: Acc. Depreciation
1,794
2,186
2,614
3,172
3,850
4,619
Net Block
3,752
3,907
5,011
5,826
6,535
6,966
Capital Work-in-Progress
310
310
310
310
310
310
64
812
971
1,968
1,968
1,968
Goodwill
Investments
20
123
246
312
312
312
Long-term loans and adv.
486
269
338
343
343
395
Current Assets
8,279
10,294
9,206
12,188
13,078
15,031
Cash
469
834
513
1,262
492
342
8
831
409
10
10
10
Loans & Advances
Other
7,802
8,629
8,284
10,916
12,576
14,679
Current liabilities
3,634
4,168
3,720
4,649
5,356
6,252
Net Current Assets
4,645
6,127
5,487
7,539
7,722
8,779
9,280
11,546
12,362
16,297
17,189
18,730
Total Assets
August 10,2018
6
Aurobindo Pharma | 1QFY2019 Result Update
Cash flow statement (Consolidated)
Y/E March (` cr)
FY2015
FY2016
FY2017
FY2018
FY2019E FY2020E
Profit before tax
2,168
2,744
3,061
3,241
3,670
3,837
Depreciation
333
392
428
558
678
769
(Inc)/Dec in Working Capital
(757)
(1,333)
388
(1,298)
(953)
(1,155)
Less: Other income
81
205
121
105
105
105
Direct taxes paid
(597)
(721)
(760)
(818)
(918)
(959)
Cash Flow from Operations
1,066
877
2,996
1,577
2,373
2,386
(Inc.)/Dec.in Fixed Assets
(1,989)
3
(1,532)
(1,374)
(1,388)
(1,200)
(Inc.)/Dec. in Investments
-
103
123
66
-
-
Other income
81
205
121
105
105
105
Cash Flow from Investing
(1,908)
311
(1,288)
(1,203)
(1,282)
(1,095)
Issue of Equity
-
-
-
-
-
-
Inc./(Dec.) in loans
94
552
(1,331)
1,398
(1,483)
(1,000)
Dividend Paid (Incl. Tax)
(171)
(171)
(171)
(171)
(322)
(337)
Others
1,209
(1,204)
(527)
(854)
(56)
(91)
Cash Flow from Financing
1,133
(823)
(2,030)
373
(1,861)
(1,428)
Inc./(Dec.) in Cash
291
365
(321)
748
(770)
(137)
Opening Cash balances
179
469
834
513
1,262
492
Closing Cash balances
469
834
513
1,262
492
342
August 10,2018
7
Aurobindo Pharma | 1QFY2019 Result Update
Key ratios
Y/E March
FY2015
FY2016
FY2017
FY2018 FY2019E FY2020E
Valuation Ratio (x)
P/E (on FDEPS)
21.7
17.4
15.3
14.5
12.8
12.2
P/CEPS
9.2
14.5
12.9
11.8
10.2
9.6
P/BV
3.4
4.8
3.8
3.0
2.5
2.1
0.7
0.4
0.4
0.4
0.8
0.8
Dividend yield (%)
EV/Sales
1.7
2.8
2.5
2.4
2.0
1.7
EV/EBITDA
8.4
14.0
11.8
11.0
9.3
8.6
EV / Total Assets
2.3
3.4
3.1
2.4
2.2
2.0
Per Share Data (`)
EPS (Basic)
27.7
34.6
39.3
41.4
47.1
49.2
EPS (fully diluted)
27.7
34.6
39.3
41.4
47.1
49.2
Cash EPS
65.4
41.3
46.6
50.9
58.6
62.3
DPS
4.5
2.5
2.5
2.5
4.7
4.9
Book Value
176.6
124.5
160.1
199.6
241.1
284.6
Dupont Analysis
EBIT margin
17.9
17.4
18.6
18.2
18.0
16.1
Tax retention ratio
72.5
73.7
75.2
74.8
75.0
75.0
Asset turnover (x)
1.5
1.4
1.3
1.2
1.2
1.3
ROIC (Post-tax)
19.2
18.3
18.7
16.7
16.2
15.2
Cost of Debt (Post Tax)
1.6
1.7
1.3
1.5
1.5
1.5
Leverage (x)
0.8
0.6
0.4
0.3
0.2
0.1
Operating ROE
33.4
27.9
25.4
20.8
19.5
17.1
Returns (%)
ROCE (Pre-tax)
25.3
22.9
23.1
20.6
20.1
19.6
Angel ROIC (Pre-tax)
27.6
26.5
27.4
25.3
24.8
23.0
ROE
36.4
32.5
27.6
23.0
21.4
18.7
Turnover ratios (x)
Asset Turnover (Gross Block)
2.4
2.3
2.2
2.0
2.0
2.0
Inventory / Sales (days)
90
100
101
113
105
104
Receivables (days)
93
107
89
65
65
65
Payables (days)
98
126
119
114
114
111
WC cycle (ex-cash) (days)
119
124
124
124
130
129
Solvency ratios (x)
Net debt to equity
0.7
0.5
0.3
0.3
0.2
0.1
Net debt to EBITDA
1.4
1.3
0.8
0.9
0.6
0.4
Interest Coverage (EBIT / Int.)
25.5
25.8
41.4
37.9
45.1
70.3
August 10,2018
8
Aurobindo Pharma | 1QFY2019 Result Update
Research Team Tel: 022 - 39357800
DISCLAIMER
Angel Broking Private Limited (hereinafter referred to as “Angel”) is a registered Member of National Stock Exchange of India Limited,
Bombay Stock Exchange Limited and Metropolitan Stock Exchange Limited. It is also registered as a Depository Participant with CDSL
and Portfolio Manager with SEBI. It also has registration with AMFI as a Mutual Fund Distributor. Angel Broking Private Limited is a
registered entity with SEBI for Research Analyst in terms of SEBI (Research Analyst) Regulations, 2014 vide registration number
INH000000164. Angel or its associates has not been debarred/ suspended by SEBI or any other regulatory authority for accessing
/dealing in securities Market. Angel or its associates/analyst has not received any compensation / managed or co-managed public
offering of securities of the company covered by Analyst during the past twelve months.
This document is solely for the personal information of the recipient, and must not be singularly used as the basis of any investment
decision. Nothing in this document should be construed as investment or financial advice. Each recipient of this document should
make such investigations as they deem necessary to arrive at an independent evaluation of an investment in the securities of the
companies referred to in this document (including the merits and risks involved), and should consult their own advisors to determine
the merits and risks of such an investment.
Reports based on technical and derivative analysis center on studying charts of a stock's price movement, outstanding positions and
trading volume, as opposed to focusing on a company's fundamentals and, as such, may not match with a report on a company's
fundamentals. Investors are advised to refer the Fundamental and Technical Research Reports available on our website to evaluate the
contrary view, if any.
The information in this document has been printed on the basis of publicly available information, internal data and other reliable
sources believed to be true, but we do not represent that it is accurate or complete and it should not be relied on as such, as this
document is for general guidance only. Angel Broking Pvt. Limited or any of its affiliates/ group companies shall not be in any way
responsible for any loss or damage that may arise to any person from any inadvertent error in the information contained in this report.
Angel Broking Pvt. Limited has not independently verified all the information contained within this document. Accordingly, we cannot
testify, nor make any representation or warranty, express or implied, to the accuracy, contents or data contained within this document.
While Angel Broking Pvt. Limited endeavors to update on a reasonable basis the information discussed in this material, there may be
regulatory, compliance, or other reasons that prevent us from doing so.
This document is being supplied to you solely for your information, and its contents, information or data may not be reproduced,
redistributed or passed on, directly or indirectly.
Neither Angel Broking Pvt. Limited, nor its directors, employees or affiliates shall be liable for any loss or damage that may arise from
or in connection with the use of this information.
Disclosure of Interest Statement
Aurobindo Pharma
1. Financial interest of research analyst or Angel or his Associate or his relative
No
2. Ownership of 1% or more of the stock by research analyst or Angel or associates or relatives
No
3. Served as an officer, director or employee of the company covered under Research
No
4. Broking relationship with company covered under Research
No
Ratings (Based on expected returns
Buy (> 15%)
Accumulate (5% to 15%)
Neutral (-5 to 5%)
over 12 months investment period):
Reduce (-5% to -15%)
Sell (< -15)
August 10,2018
9