IPO Note | FMCG
September 19, 2017
Prataap Snacks Limited
NEUTRAL
sue Open: September 22, 2017
Is
IPO Note
Issue Close: September 26, 2017
Prataap Snacks is one of the top snack food companies in India and with 27%
revenue CAGR between FY13-FY17, it is also one of the fastest growing
Issue Details
companies in its sector. It has three product lines i.e. Extruded Snacks, Chips and
Namkeen and has brands such as Chulbule and Yellow Diamond. It has 3
Face Value: `5
manufacturing facilities, 218 distributors and 3,500 super stockists.
Present Eq. Paid up Capital: `10.7cr
Fastest growing organized snacks player: Prataap Snacks has seen a strong
revenue growth since inception and from FY13-FY17 its revenue grew at a CAGR
Offer for Sale: 30lakh Shares (*`279-
**282cr)
of 27% vs. organized snack food industry growth of 14% (2010-16). This has
been due to its strong distribution network and acquisition of Yellow Diamond
Fresh issue: *21.5 lakh -**21.3 lakh shares
brand which is doing well. With the focus on growth, company has gained 8%
(`200cr)
and 3% market share in organized extruded snacks and chips market respectively.
Post Eq. Paid up Capital: `11.7cr
Company is foraying in chocolate-based confectionary products which will benefit
Issue size (amount): *`479.5cr -**481.9 cr
Prataap to report above industry growth rate going ahead.
Price Band: `930-938
Inconsistent profitability: With the focus on gaining the market share, its
profitability has remained inconsistent. The gross margins (GM) during FY13-17
Lot Size: 15 shares and in multiple thereafter
have been between 26-31% which is weak compared to its peer DFM Foods’
Post-issue implied mkt. cap:
*`2,183cr
-
which made GM of ~40% in FY17. With weak GM and higher depreciation,
**`2,200cr
company’s EBITDA margins have been consistently weak and have come down
Promoters holding Pre-Issue: 92.7%
from 8% in FY13 to 4.5% in FY17. PAT margins have also shrunk to just 1% in
Promoters holding Post-Issue: 71.4%
FY17 from 4.3% in FY13 due to the potato crop related issues.
*Calculated on lower price band
Weak return ratios: With the poor profitability, company has also seen poor set of
** Calculated on upper price band
return ratios. The highest of RoE in the last five years has been 12.6% in FY16
which declined to just 4.2% in FY17. This is weaker than its peer DFM Foods (20%
Book Building
in FY17). Its ROCE has also been lower than cost of capital during this period.
QIBs
50% of issue
Valuations and outlook: At 202x of its FY17 earnings, the issue is richly valued at
upper end of its price band i.e. `938. Ignoring its lower profitability in FY17 and
Non-Institutional
15% of issue
valuating the issue on FY16 EPS still yields a high P/E of 73.0x. FMCG companies
Retail
35% of issue
commanding such high P/Es have a very strong profitability and returns profile
such as Britannia (which is not an exact peer due to size and product portfolio). Its
peer in exactly same industry i.e. DFM Foods, also has good margins (10% in
FY17) and handsome return profile (~20%). For Prataap to justify this high
Post Issue Shareholding Pattern
valuation, remarkable improvement in profitability is required which may come at
the cost of lower growth. Considering this, we rate Prataap Snacks as Neutral.
Promoters Group
71.4
Key Financials
DIIs/FIIs/Public & Others
28.6
Y/E March (` cr)
FY2014
FY2015
FY2016
FY2017
Net Sales
445.6
558.8
757.2
903.9
% chg
29.6
25.4
35.5
19.4
Net Profit
5.4
9.9
27.4
9.9
% chg
(63.8)
84.1
176.4
(63.9)
OPM (%)
4.5
6.1
7.5
4.5
EPS (Rs)
2.5
4.6
12.8
4.6
P/E (x)
371.8
202.0
73.1
202.2
P/BV (x)
11.3
10.5
9.2
8.4
RoE (%)
3.0
5.2
12.6
4.2
RoCE (%)
3.9
8.4
14.6
5.2
EV/Sales (x)
5.0
4.0
3.0
2.5
Shrikant Akolkar
EV/EBITDA (x)
110.0
65.8
39.7
55.2
+91 22 39357800 Ext: 6846
Source: Company, Angel Research
Please refer to important disclosures at the end of this report
1
Prataap Snacks| IPO Note
Company background
Prataap Snacks is one of the top six Indian snack food companies in terms of
revenues in 2016, and features among the fastest growing companies in the
Indian organized snack market between 2010 and 2016. Company has three
product lines i.e. Extruded Snacks (potato or cereal based snacks) Chips (fried,
sliced chips or crisps made from potatoes, hummus, lentils etc) and Namkeen
(traditional savoury Indian snack such as moong dal, masala or fried nuts, sev and
bhujia). Company operates brands such as Chulbule, Yellow Diamond, etc.
Extruded snacks, Potato Chips and Namkeen represented 63%, 24%, and 12%, of
its total revenue in FY17.
Company owns and operates 3 manufacturing facilities, one located at Indore,
and two in Assam. The total capacity of these three facilities is 80,500 MTPA. It has
also engaged in two facilities on contract manufacturing basis, located at
Bengaluru, and at Kolkata. Its distribution network included 218 super stockists
and over 3,500 distributors. Prataap is one of the leading players in the East Zone
with a strong presence in the North and West Zones and it is also increasing
penetration in the South Zone. Company has appointed Salman Khan, a popular
Hindi movie actor, as its brand ambassador.
Its Potato Chips, Rings, Chulbule and Namkeen products currently generate
revenues of over ₹100cr each. Company also has a subsidiary named Pure N Sure
which intends to foray in chocolate-based confectionary snacks by setting up a
manufacturing facility.
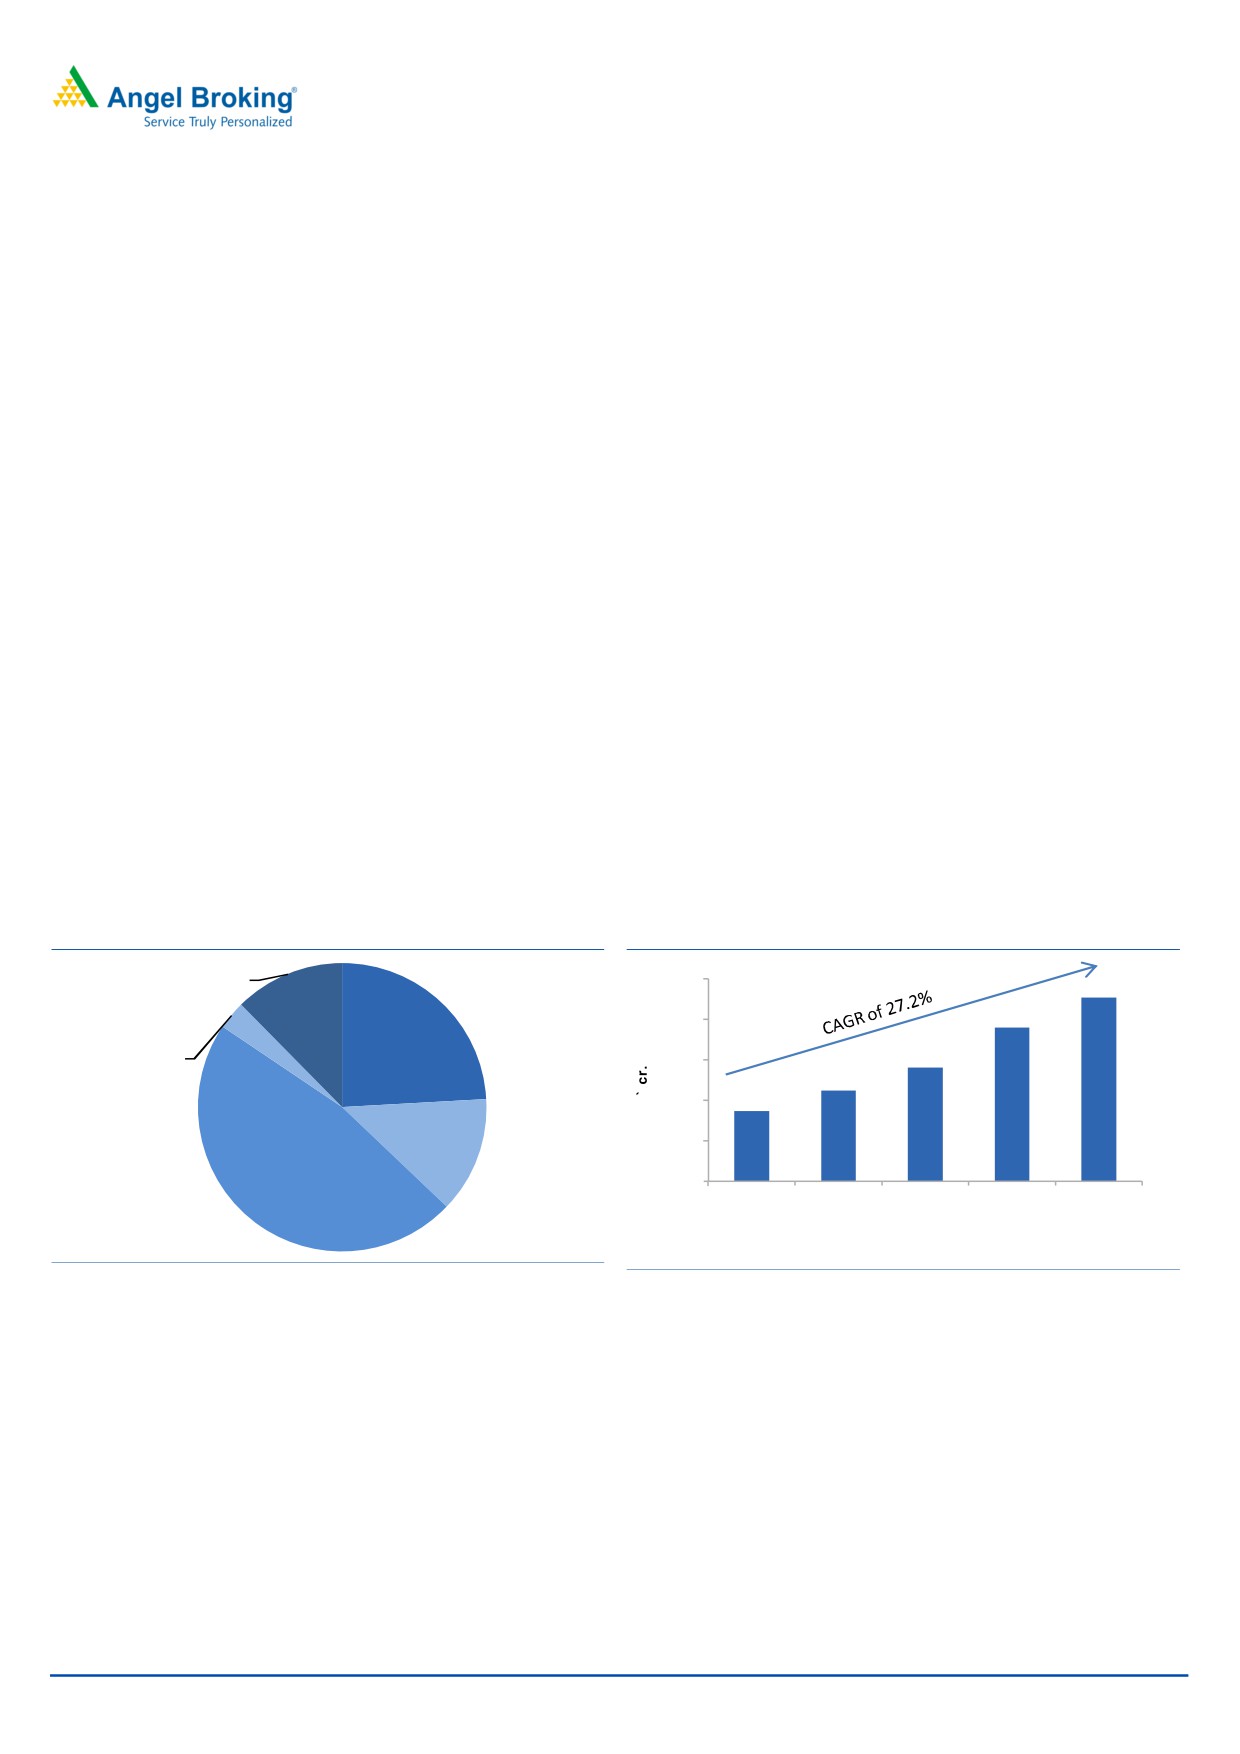
Exhibit 1: Revenue mix FY17
Exhibit 2: FY13-FY17 revenue CAGR at 27%
Namkeen,
1,000
908
12.3%
760
Potato
800
Chips,
Pellets,
562
24.1%
600
3.2%
449
347
400
Chulbule,
200
13.0%
Puff and
Rings,
0
47.3%
FY13
FY14
FY15
FY16
FY17
Source: Company, Angel Research
Source: Company, Angel Research
September 19, 2017
2
Prataap Snacks| IPO Note
Issue details
The IPO consists of OFS (~`282cr) and a fresh issue (`200cr). Through this IPO,
Sequoia Capital as well as some founders are selling some part of their shares
from the company. Before the IPO, Sequoia Capital held majority i.e. ~62% stake
in the company, this was bought by Sequoia in 2011. After the IPO, Sequoia
Capital’s stake would come down to 48.4%. The founders of the company hold the
31.1% stake in the company which will also come down to 23%. The company has
raised `50cr before the IPO at the price of `938 per share.
Exhibit 3: Selling shareholders and pre and post IPO shareholding pattern
Shareholder
Percentage of pre-issue capital
Shares sold
Percentage of post- issue capital
Sequoia Capital
61.6%
1,780,810
48.4%
Rajesh Mehta
4.9%
361,920
2.9%
Naveen Mehta
4.9%
139,200
3.9%
Arvind Mehta
3.5%
183,740
2.4%
Arun Mehta
3.3%
139,200
2.4%
Kanta Mehta
1.4%
66,820
1.0%
Rita Mehta
1.5%
0
1.4%
Premlata Kumat
3.0%
77,950
2.4%
Swati Bapna
1.1%
22,270
0.9%
Apoorva Kumat
3.1%
116,930
2.3%
Amit Kumat
3.3%
116,930
2.5%
Sandhya Kumat
0.6%
0
0.6%
Rakhi Kumat
0.5%
0
0.5%
Public
7.3%
28.6%
Total shares
100.0%
3,005,770
100.0%
Source: Company, Angel Research, Sequoia Capital = Sequoia Capital GFIV Mauritius Investments + SCI Growth Investments II + Sequoia Capital India
Growth Investment Holdings I
Objects of the offer
Partial / full repayment/pre-payment, of certain borrowings
Modernization of existing facilities and setting up of a new production line and
construction of a building
Investment in its subsidiary, Pure N Sure, towards enabling the repayment/pre-
payment of certain borrowings
Marketing and brand-building activities
General corporate purposes
September 19, 2017
3
Prataap Snacks| IPO Note
Investment Rationale
Fastest growing organized snacks player: Prataap Snacks has seen a strong
revenue growth since inception and from FY13-FY17 its revenue grew at a CAGR
of 27% vs. organized snack food industry growth of 14% (2010-16). This has been
due to its strong distribution network and acquisition of Yellow Diamond brand
which is doing well. With the focus on growth, company has gained 8% and 3%
market share in organized extruded snacks and chips market respectively.
Company is foraying in chocolate-based confectionary products which will benefit
Prataap to report above industry growth rate going ahead.
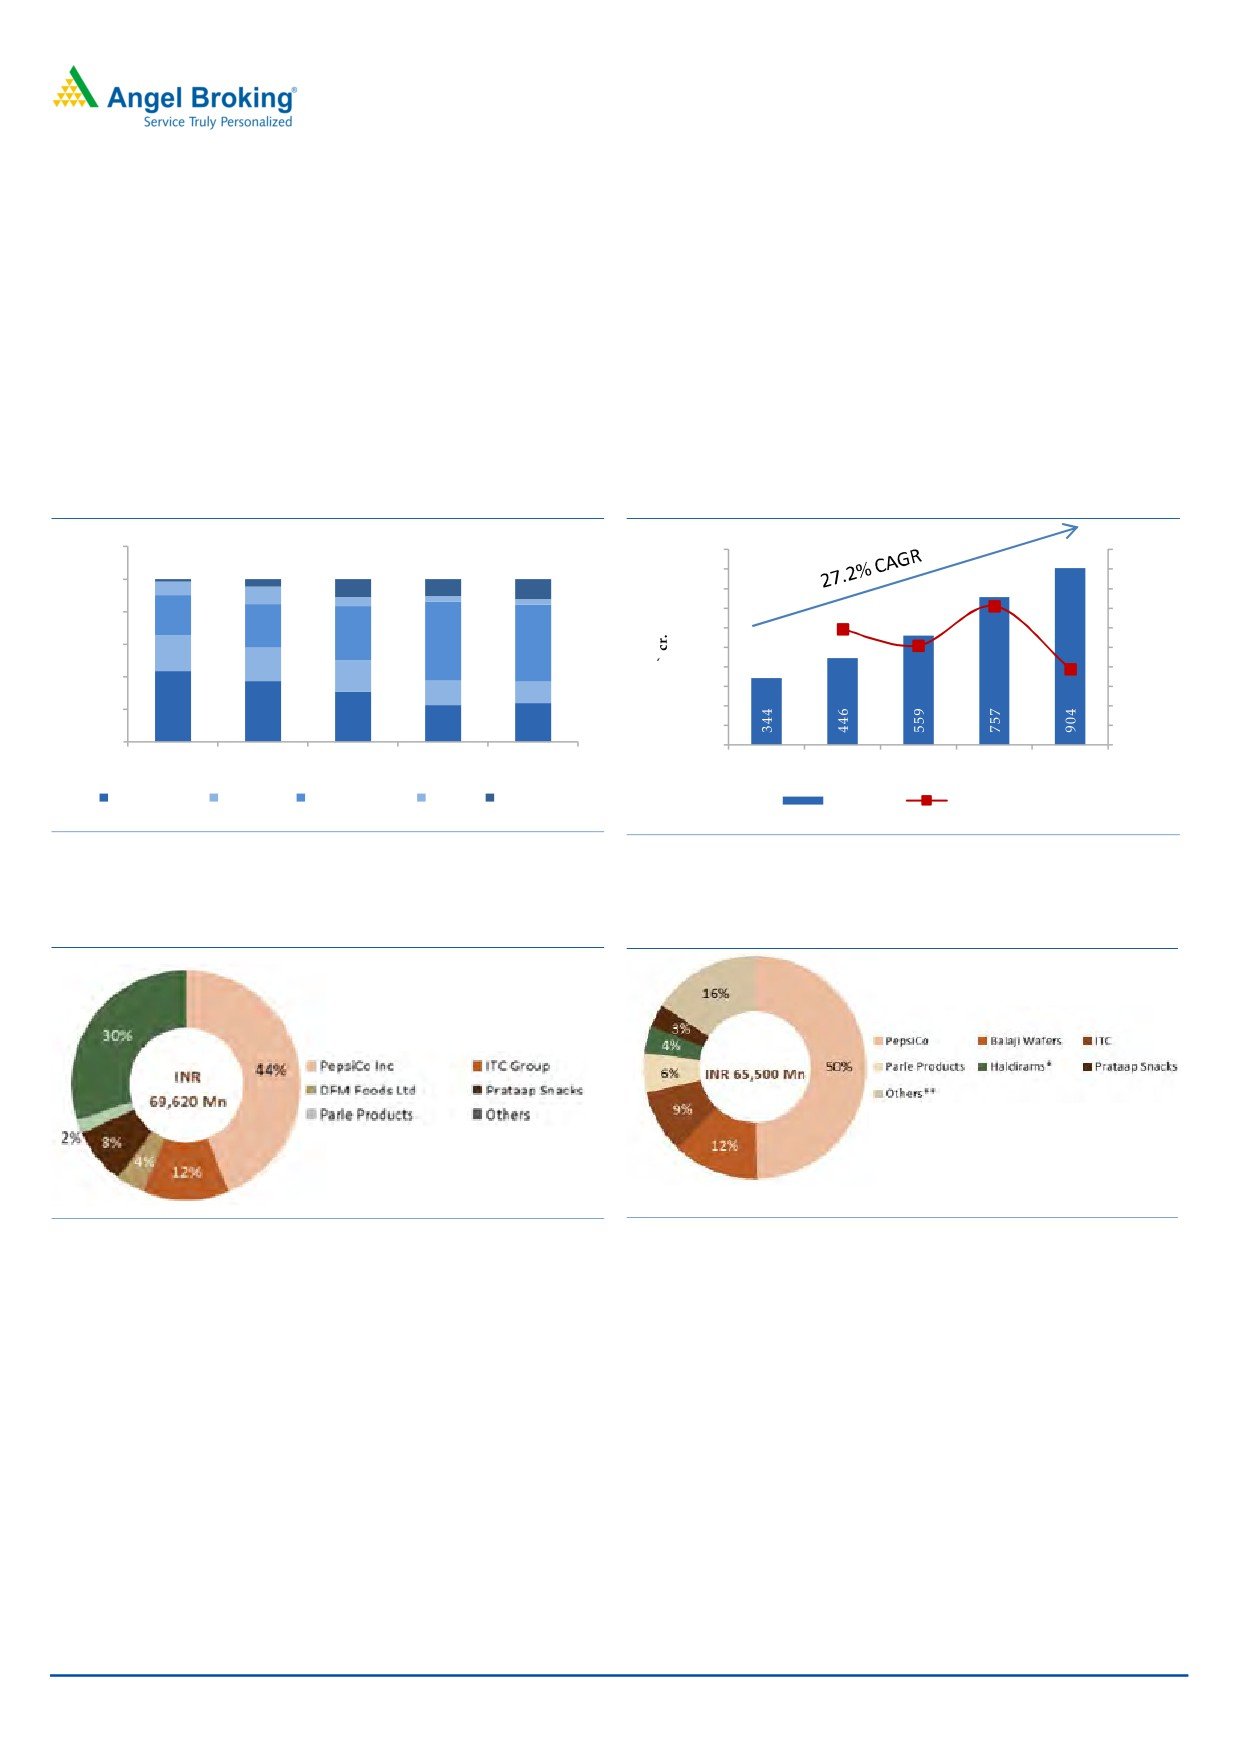
Exhibit 4: Evolution of its business mix
Exhibit 5: 27% CAGR in revenue between FY13-FY17
120.0%
1,000
50.0%
1.7%
4.6%
12.3%
900
45.0%
11.0%
10.5%
100.0%
800
35.5%
40.0%
80.0%
700
35.0%
24.6%
29.6%
26.9%
600
25.4%
30.0%
33.2%
60.0%
48.3%
47.3%
21.8%
500
19.4%
25.0%
20.5%
400
20.0%
40.0%
19.4%
300
15.0%
15.1%
13.0%
20.0%
43.7%
37.4%
200
10.0%
30.9%
22.7%
24.1%
100
5.0%
0.0%
0
0.0%
FY13
FY14
FY15
FY16
FY17
FY13
FY14
FY15
FY16
FY17
Potato Chips
Chulbule
Puff and Rings
Pellets
Namkeen
Net sales
YoY Growth
Source: DRHP, Angel Research
Source: DRHP, Angel Research
Exhibit 6: 8% market share in organized extruded snacks
Exhibit 7: 3% in market share in organized chips
Source: DRHP, Angel Research
Source: DRHP, Angel Research
Inconsistent profitability: With the focus on gaining the market share, its
profitability has remained inconsistent. The gross margins (GM) during FY13-17
have been between 26-31% which is weak compared to its peer DFM Foods’
which made GM of ~40% in FY17. With weak GM and higher depreciation,
company’s EBITDA margins have been consistently weak and have come down
from 8% in FY13 to 4.5% in FY17. PAT margins have also shrunk to just 1% in
FY17 from 4.3% in FY13 due to the potato crop related issues.
September 19, 2017
4
Prataap Snacks| IPO Note
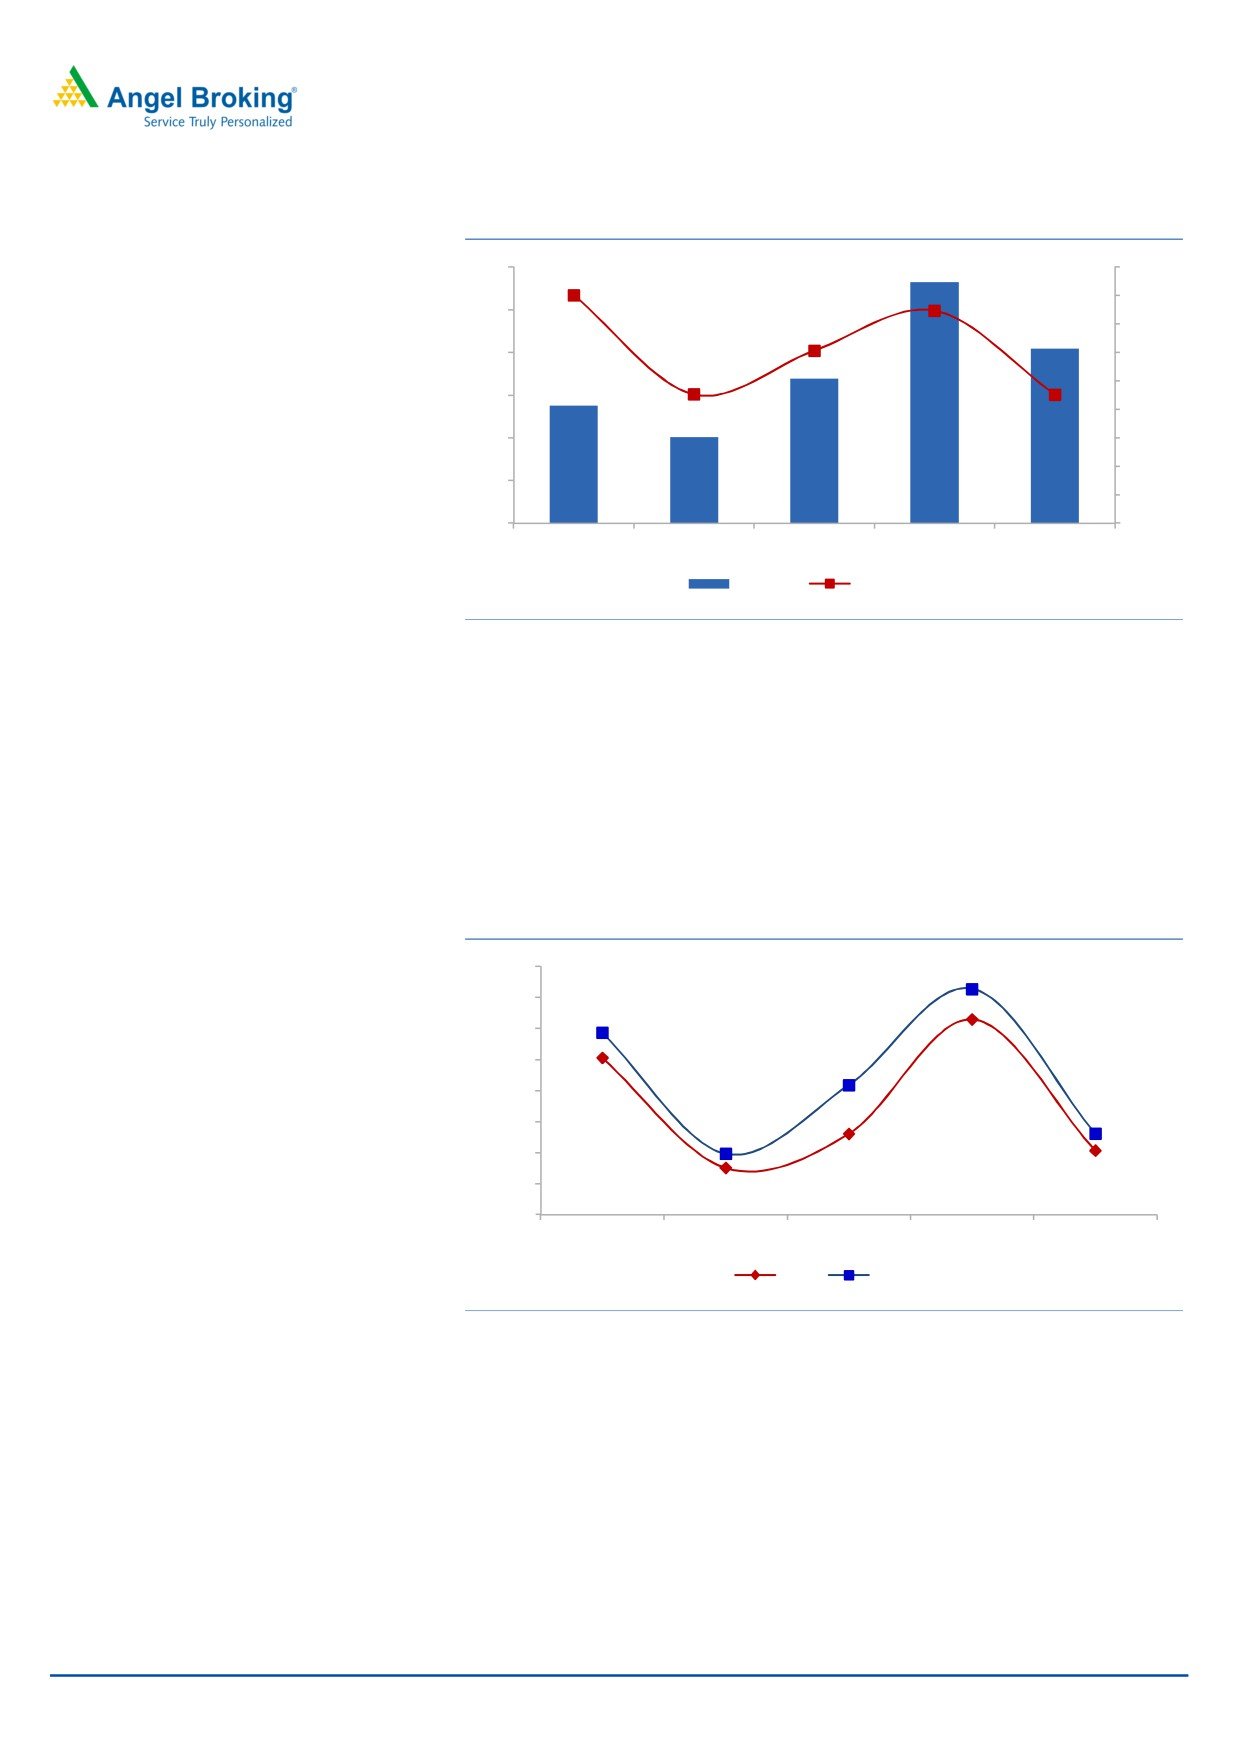
Exhibit 8: Inconsistent EBITDA margins
60
9.0%
8.0%
8.0%
50
7.5%
7.0%
40
6.1%
6.0%
5.0%
30
4.5%
4.5%
4.0%
20
3.0%
2.0%
10
1.0%
0
0.0%
FY13
FY14
FY15
FY16
FY17
EBITDA
EBITDA Margin
Source: DRHP, Angel Research
Weak return ratios: Due to the poor profitability, company has seen weak return
ratios. The higher RoE that company has seen was 12.6% in FY16 which declined
to just 4.2% in FY17 vs. DFM Foods’ RoE of ~20% in FY17.
Its ROCE has also been weak during FY13-FY17. The return on capital has been
significantly less than cost of capital for the last five years in row, while cost of
capital has been ~16-17%; the ROCE in the last five years has averaged at 8.8%
indicating that the company is not generating enough returns.
Exhibit 9: Inconsistent return ratios and ROCE below cost of capital
16.0%
14.6%
14.0%
11.7%
12.0%
12.6%
10.0%
8.4%
10.1%
8.0%
5.2%
6.0%
3.9%
4.0%
5.2%
4.2%
2.0%
3.0%
0.0%
FY13
FY14
FY15
FY16
FY17
ROE
ROCE
Source: DRHP, Angel Research
September 19, 2017
5
Prataap Snacks| IPO Note
Outlook and Valuation:
At 202x of its FY17 earnings, the issue is richly valued at upper end of its price
band i.e. `938. Ignoring its lower profitability in FY17 and valuating the issue on
FY16 EPS still yields a high P/E of 73.0x. FMCG companies commanding such
high P/Es have a very strong profitability and returns profile such as Britannia
(which is not an exact peer due to size and product portfolio). Its peer in exactly
same industry i.e. DFM Foods, also has good margins (10% in FY17) and
handsome return profile (~20%). For Prataap to justify this high valuation,
remarkable improvement in profitability is required which may come at the cost of
lower growth. Considering this, we rate Prataap Snacks as Neutral.
Exhibit 10: Valuation matrix
Parameter
DFM foods Britannia Industries
Prataap Snacks
EBITDA margins
9.9%
14.1%
4.5%
RoE
19.6%
32.9%
4.2%
ROCE
14.9%
41.1%
5.2%
P/E
86
59
202
EV/EBITDA
43
41
50
Source: Capitaline, Angel Research, Comparison based on latest reported annual numbers
Upside risks
Faster growth in the sales: The company has grown as a CAGR of >30% between
FY13-16 however in FY17, growth rate slowed to below 20% on yoy basis. With
the funds raised through fresh issue in the IPO company intends to invest in the
new manufacturing facilities to foray in the new range of products which may lead
to increase in the growth rates and this can take the growth rate back to ~30%
yoy.
Improvement in the margins: Prataap has seen an inconsistent profitability over the
last five years which has also impacted its return ratios. Improvement in the
profitability would improve its return ratios.
September 19, 2017
6
Prataap Snacks| IPO Note
Income statement
Y/E March (` cr)
FY2013
FY2014
FY2015
FY2016
FY2017
Total operating income
344
446
559
757
904
% chg
29.6
25.4
35.5
19.4
Total Expenditure
316
425
525
701
863
Raw Material Consumed
241
328
404
522
637
Personnel Expenses
5
9
14
19
25
Others Expenses
70
88
107
160
201
EBITDA
28
20
34
57
41
% chg
(% of Net Sales)
8.0
4.5
6.1
7.5
4.5
Depreciation& Amortisation
7
12
15
18
25
EBIT
21
8
19
39
16
% chg
(% of Net Sales)
6.0
1.9
3.3
5.1
1.8
Interest & other Charges
3
3
6
11
3
Recurring PBT
18
5
13
28
13
% chg
Extraordinary Expense/(Inc.)
-
-
-
-
-
PBT (reported)
18
5
13
28
13
Tax
3
(0)
3
0
3
(% of PBT)
16.6
(7.9)
23.8
0.7
23.5
PAT before MI
15
5
10
27
10
Minority Interest (after tax)
-
-
-
-
-
Profit/Loss of Associate Company
-
-
-
-
-
PAT after MI(reported)
15
5
10
27
10
Exceptional Items
-
-
-
-
-
Reported PAT
15
5
10
27
10
% chg
(63.8)
84.1
176.4
(63.9)
(% of Net Sales)
4.3
1.2
1.8
3.6
1.1
Basic EPS (`)
7
3
5
13
5
Fully Diluted EPS (`)
7
3
5
13
5
% chg
(63.8)
84.1
176.4
(63.9)
Source: DRHP, Angel Research
September 19, 2017
7
Prataap Snacks| IPO Note
Balance Sheet
Y/E March (` cr)
FY2013
FY2014
FY2015
FY2016
FY2017
SOURCES OF FUNDS
Equity Share Capital
1
1
1
1
3
Reserves& Surplus
146
176
188
216
235
Shareholders’ Funds
147
177
190
217
238
Minority Interest
0
0
-
-
-
Total Loans
30
38
32
47
66
Other long term liabilities
Long-term provisions
0
0
1
1
2
Deferred Tax Liability
3
3
6
6
9
Total Liabilities
180
219
228
271
314
APPLICATION OF FUNDS
Gross Block
136
165
194
221
267
Less: Acc. Depreciation
11
22
37
53
74
Net Block
125
143
157
168
193
Intangible assets
0
0
0
0
8
Capital Work in Progress
3
15
24
30
52
Other non current assets
12
28
31
40
47
Current Assets
82
93
86
102
128
Inventories
42
52
58
69
79
Sundry Debtors
4
12
14
18
20
Cash
29
22
4
6
11
Loans & Advances
6
7
10
8
12
Other Assets
1
1
1
2
6
Current liabilities
42
61
71
70
113
Net Current Assets
40
32
15
32
15
Total Assets
180
219
228
271
314
Source: DRHP, Angel Research
September 19, 2017
8
Prataap Snacks| IPO Note
Cash Flow Statement
Y/E March (` cr)
FY2013
FY2014
FY2015
FY2016
FY2017
Profit before tax
18
5
13
28
13
Depreciation
7
12
15
18
25
Change in Working Capital
(13)
(5)
(0)
(6)
5
Interest / Dividend (Net)
3
4
6
11
4
Direct taxes paid
(3)
(3)
(1)
(7)
(5)
Cash Flow from Operations
11
13
33
43
43
(Inc.)/ Dec. in Fixed Assets
(67)
(50)
(41)
(52)
(59)
(Inc.)/ Dec. in Investments
(25)
12
12
6
(11)
Cash Flow from Investing
(92)
(38)
(29)
(47)
(70)
Issue of Equity
30.0
25.0
2.4
-
11.2
Inc./(Dec.) in loans
42.0
8.4
(5.6)
9.3
26.1
Dividend Paid (Incl. Tax)
-
-
-
-
-
Interest / Dividend (Net)
(2.8)
(4.2)
(6.2)
(4.5)
(5.0)
Cash Flow from Financing
69
29
(9)
5
32
Inc./(Dec.) in Cash
(11)
4
(5)
2
5
Opening Cash balances
14
3
7
1
3
Closing Cash balances
3
7
1
3
8
Source: DRHP, Angel Research
September 19, 2017
9
Prataap Snacks| IPO Note
Key Ratios
Key Ratios
Y/E March
FY2013
FY2014
FY2015
FY2016
FY2017
Valuation Ratio (x)
P/E (on FDEPS)
134.5
371.8
202.0
73.1
202.2
P/CEPS
92.2
117.3
79.2
44.1
57.3
P/BV
13.6
11.3
10.5
9.2
8.4
Dividend yield (%)
0.0
0.0
0.0
0.0
0.0
EV/Sales
6.4
5.0
4.0
3.0
2.5
EV/EBITDA
79.9
110.0
65.8
39.7
55.2
EV / Total Assets
9.9
7.9
7.4
6.6
5.3
Per Share Data (`)
EPS (Basic)
7.0
2.5
4.6
12.8
4.6
EPS (fully diluted)
7.0
2.5
4.6
12.8
4.6
Cash EPS
10.2
8.0
11.8
21.3
16.4
DPS
0.0
0.0
0.0
0.0
0.0
Book Value
68.9
83.1
88.9
101.9
111.8
Returns (%)
ROCE
11.7
3.9
8.4
14.6
5.2
Angel ROIC (Pre-tax)
14.3
4.7
9.6
16.9
6.8
ROE
10.1
3.0
5.2
12.6
4.2
Turnover ratios (x)
Asset Turnover (Gross Block)
2.5
2.7
2.9
3.4
3.4
Inventory / Sales (days)
45
43
38
33
32
Receivables (days)
4
9
9
9
8
Payables (days)
25
33
32
27
31
Working capital cycle (ex-cash) (days)
24
20
14
15
9
Solvency ratios (x)
Net debt to equity
0.0
0.1
0.1
0.2
0.2
Net debt to EBITDA
0.0
0.8
0.8
0.7
1.3
Interest Coverage (EBIT / Interest)
7.2
2.4
3.4
3.5
5.4
Source: DRHP, Angel Research
September 19, 2017
10
Prataap Snacks| IPO Note
Research Team Tel: 022 - 39357800
DISCLAIMER
Angel Broking Private Limited (hereinafter referred to as “Angel”) is a registered Member of National Stock Exchange of India Limited,
Bombay Stock Exchange Limited and Metropolitan Stock Exchange Limited. It is also registered as a Depository Participant with CDSL
and Portfolio Manager with SEBI. It also has registration with AMFI as a Mutual Fund Distributor. Angel Broking Private Limited is a
registered entity with SEBI for Research Analyst in terms of SEBI (Research Analyst) Regulations, 2014 vide registration number
INH000000164. Angel or its associates has not been debarred/ suspended by SEBI or any other regulatory authority for accessing
/dealing in securities Market. Angel or its associates/analyst has not received any compensation / managed or co-managed public
offering of securities of the company covered by Analyst during the past twelve months.
This document is solely for the personal information of the recipient, and must not be singularly used as the basis of any investment
decision. Nothing in this document should be construed as investment or financial advice. Each recipient of this document should
make such investigations as they deem necessary to arrive at an independent evaluation of an investment in the securities of the
companies referred to in this document (including the merits and risks involved), and should consult their own advisors to determine
the merits and risks of such an investment.
Reports based on technical and derivative analysis center on studying charts of a stock's price movement, outstanding positions and
trading volume, as opposed to focusing on a company's fundamentals and, as such, may not match with a report on a company's
fundamentals. Investors are advised to refer the Fundamental and Technical Research Reports available on our website to evaluate the
contrary view, if any.
The information in this document has been printed on the basis of publicly available information, internal data and other reliable
sources believed to be true, but we do not represent that it is accurate or complete and it should not be relied on as such, as this
document is for general guidance only. Angel Broking Pvt. Limited or any of its affiliates/ group companies shall not be in any way
responsible for any loss or damage that may arise to any person from any inadvertent error in the information contained in this report.
Angel Broking Pvt. Limited has not independently verified all the information contained within this document. Accordingly, we cannot
testify, nor make any representation or warranty, express or implied, to the accuracy, contents or data contained within this document.
While Angel Broking Pvt. Limited endeavors to update on a reasonable basis the information discussed in this material, there may be
regulatory, compliance, or other reasons that prevent us from doing so.
This document is being supplied to you solely for your information, and its contents, information or data may not be reproduced,
redistributed or passed on, directly or indirectly.
Neither Angel Broking Pvt. Limited, nor its directors, employees or affiliates shall be liable for any loss or damage that may arise from
or in connection with the use of this information.
September 19, 2017
11